Thomas Davis (0.09) vs Ballyboden (0.15)
Dublin Senior Football Championship Final - 2019
#Summary ##Starting Line Up (Number, Player, Playing time) ###Thomas Davis 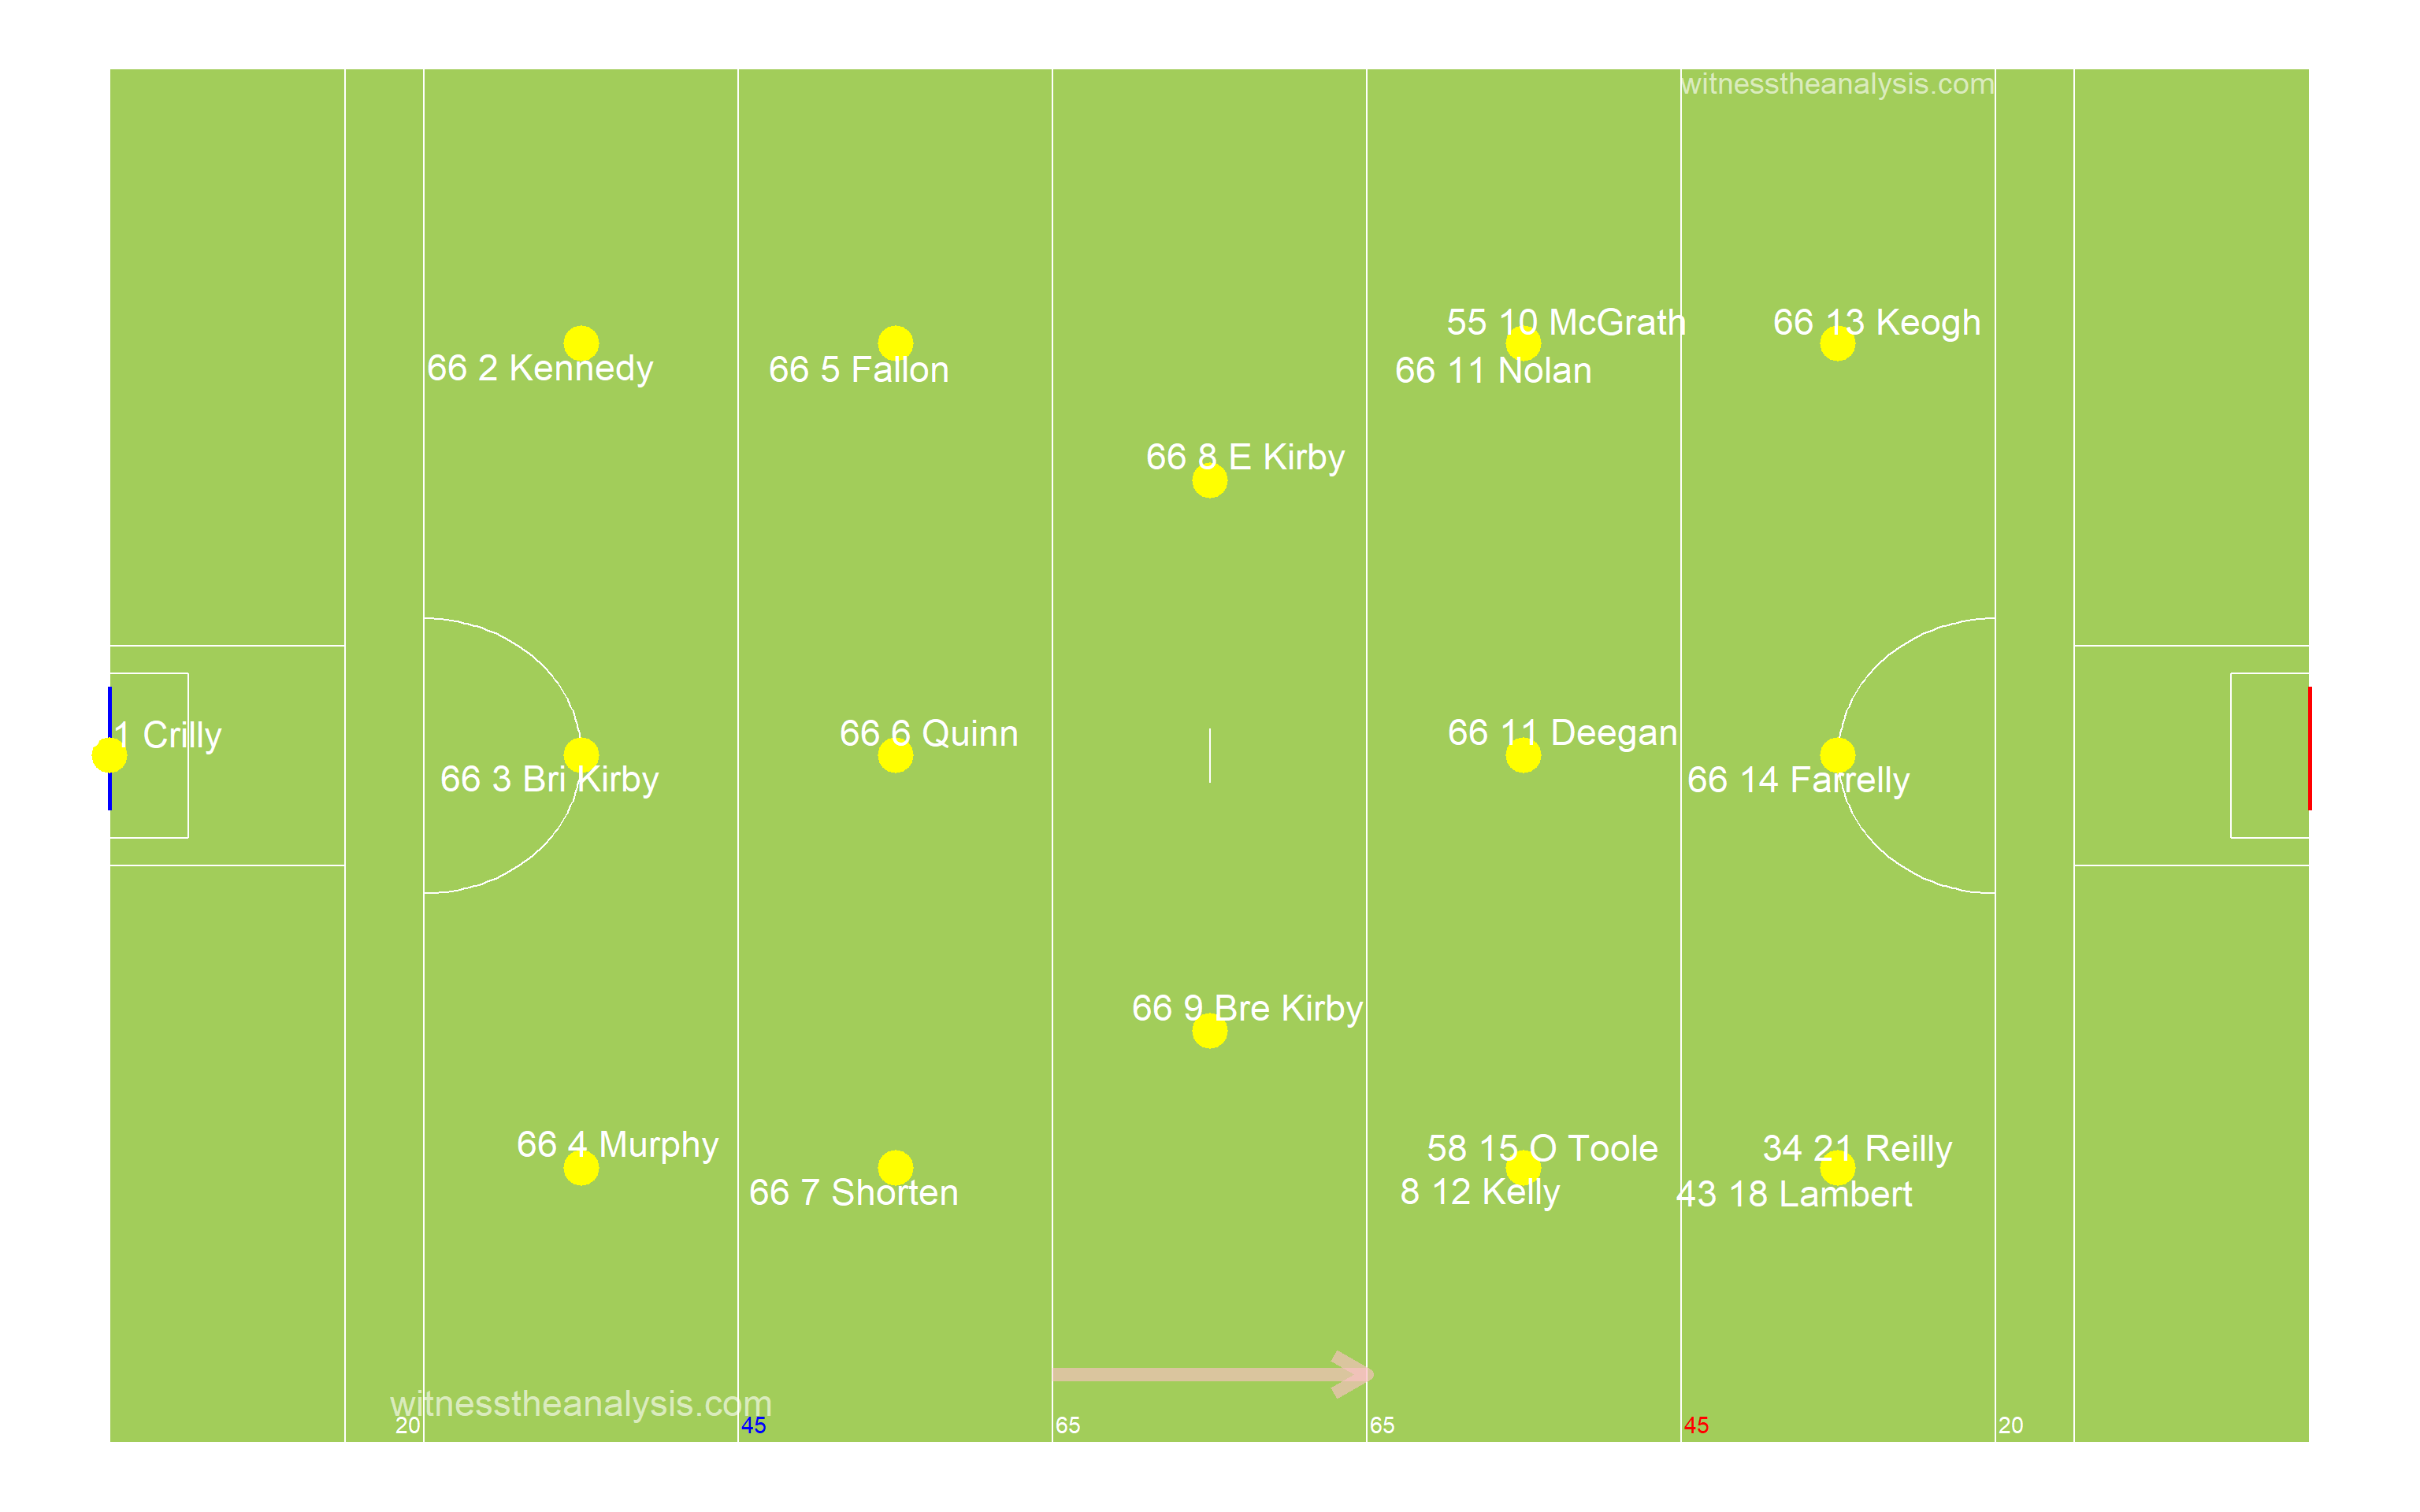
###Ballyboden 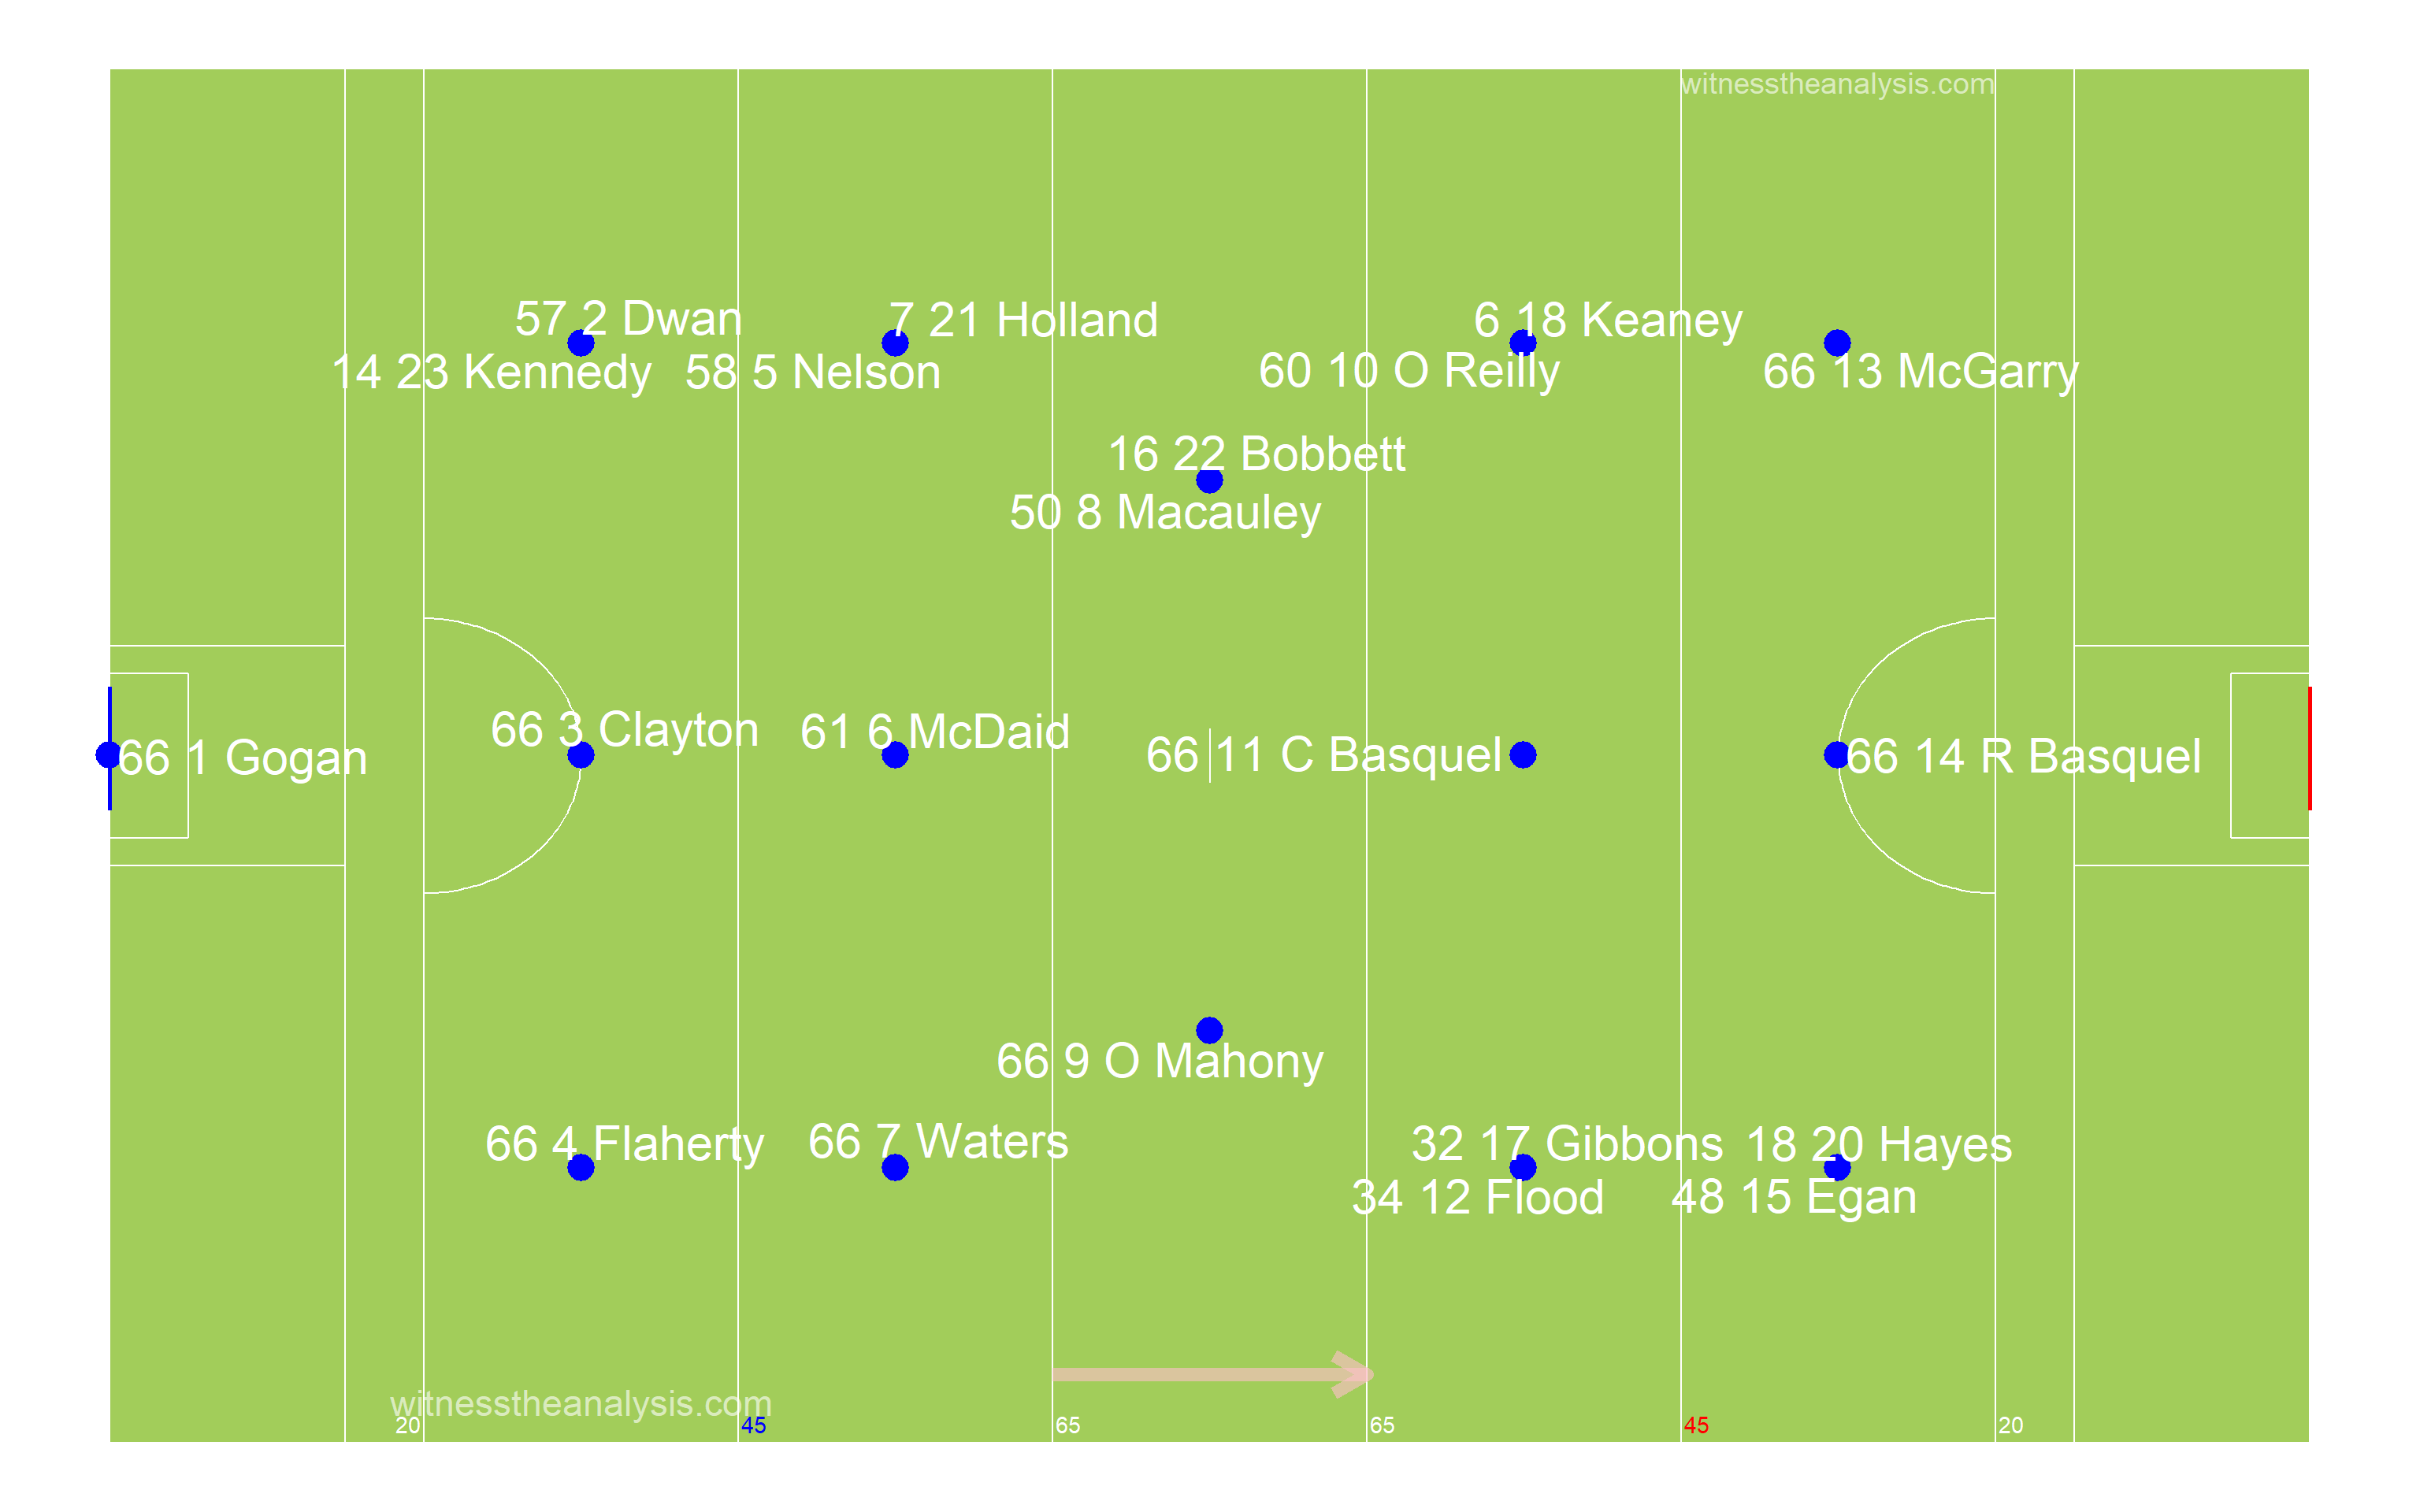
| Thomas.Davis | Ballyboden |
|---|---|
| Deegan (0-01, 0-01f) | Mahony (0-01) |
| E Kirby (0-04, 0-04f) | C Basquel (0-03, 0-02f) |
| Keogh (0-02) | R Basquel (0-06), 0-03f) |
| McGrath (0-01) | McGarry (0-04) |
| O Toole (0-01) | Flood (0-01) |
| Team | Score.Eff.. | Shots.PerPoss | Scores.PP | Op.Scores.PP | Fk.Score. | Ko. |
|---|---|---|---|---|---|---|
| Corofin | 53% | 48% | 20% | 20% | 75% | 50% |
| Pádraig Pearses | 27% | 45% | 8% | 8% | 50% | 59% |
##Scoring Timeline 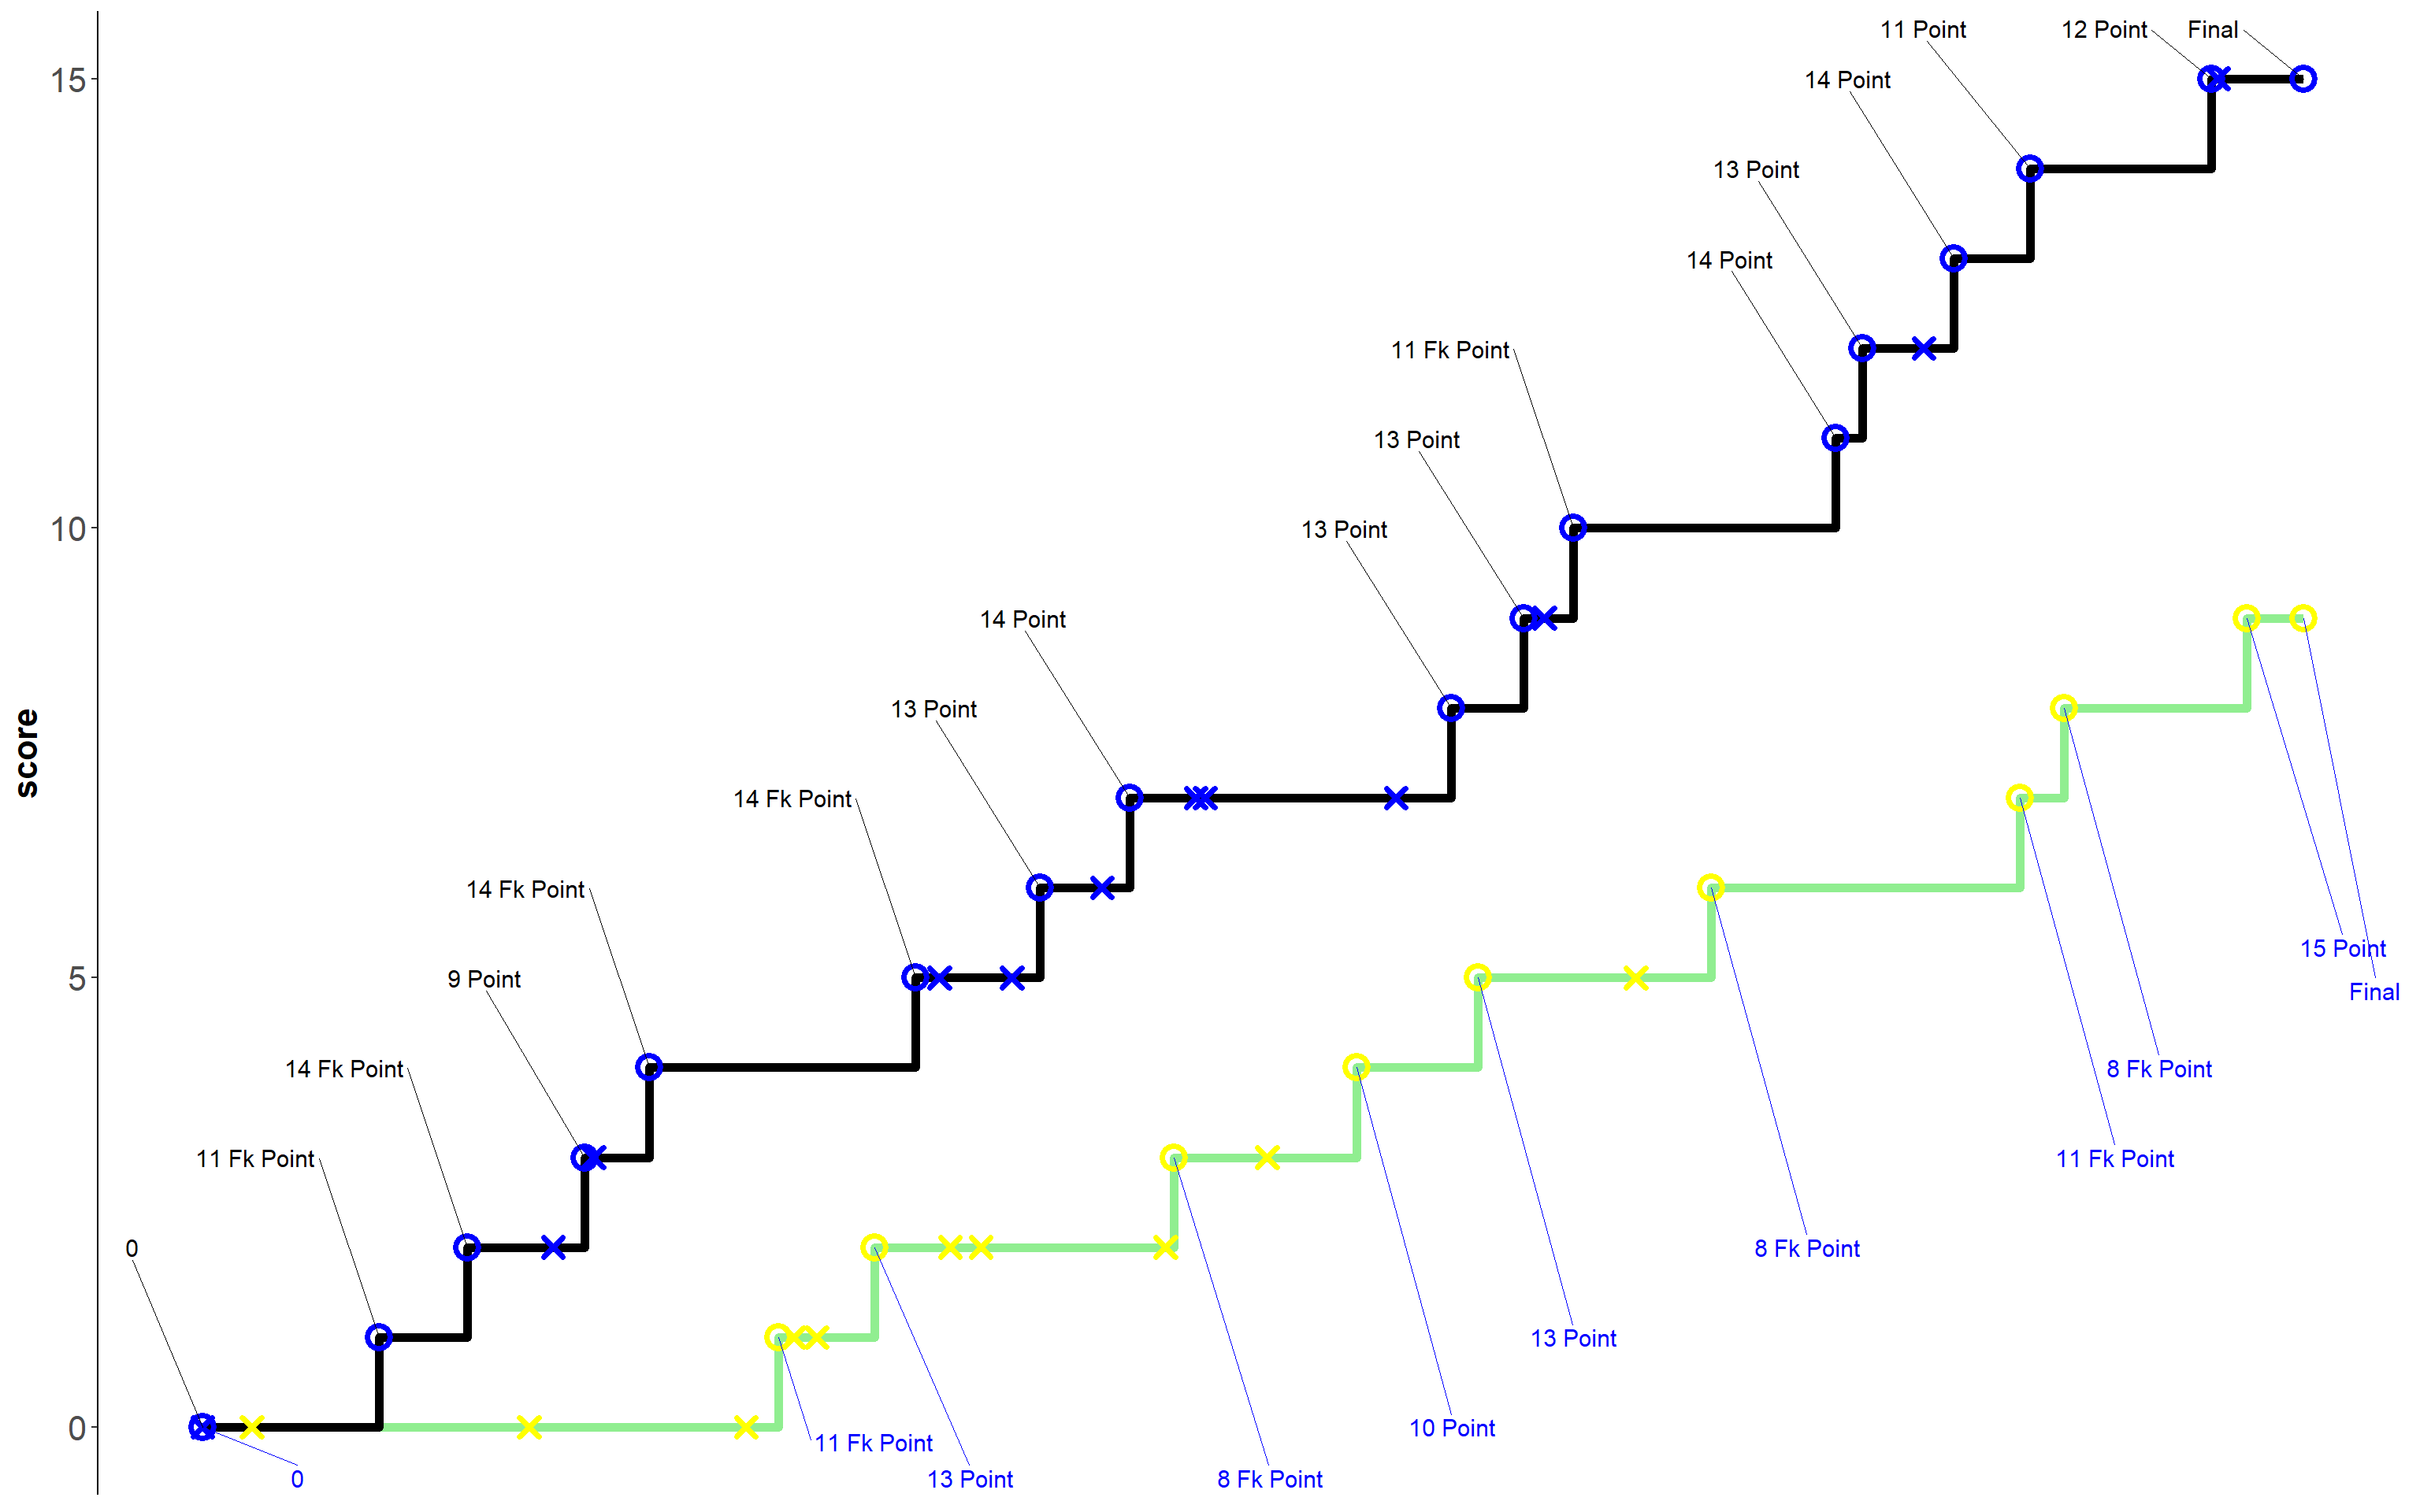
##Score Differential 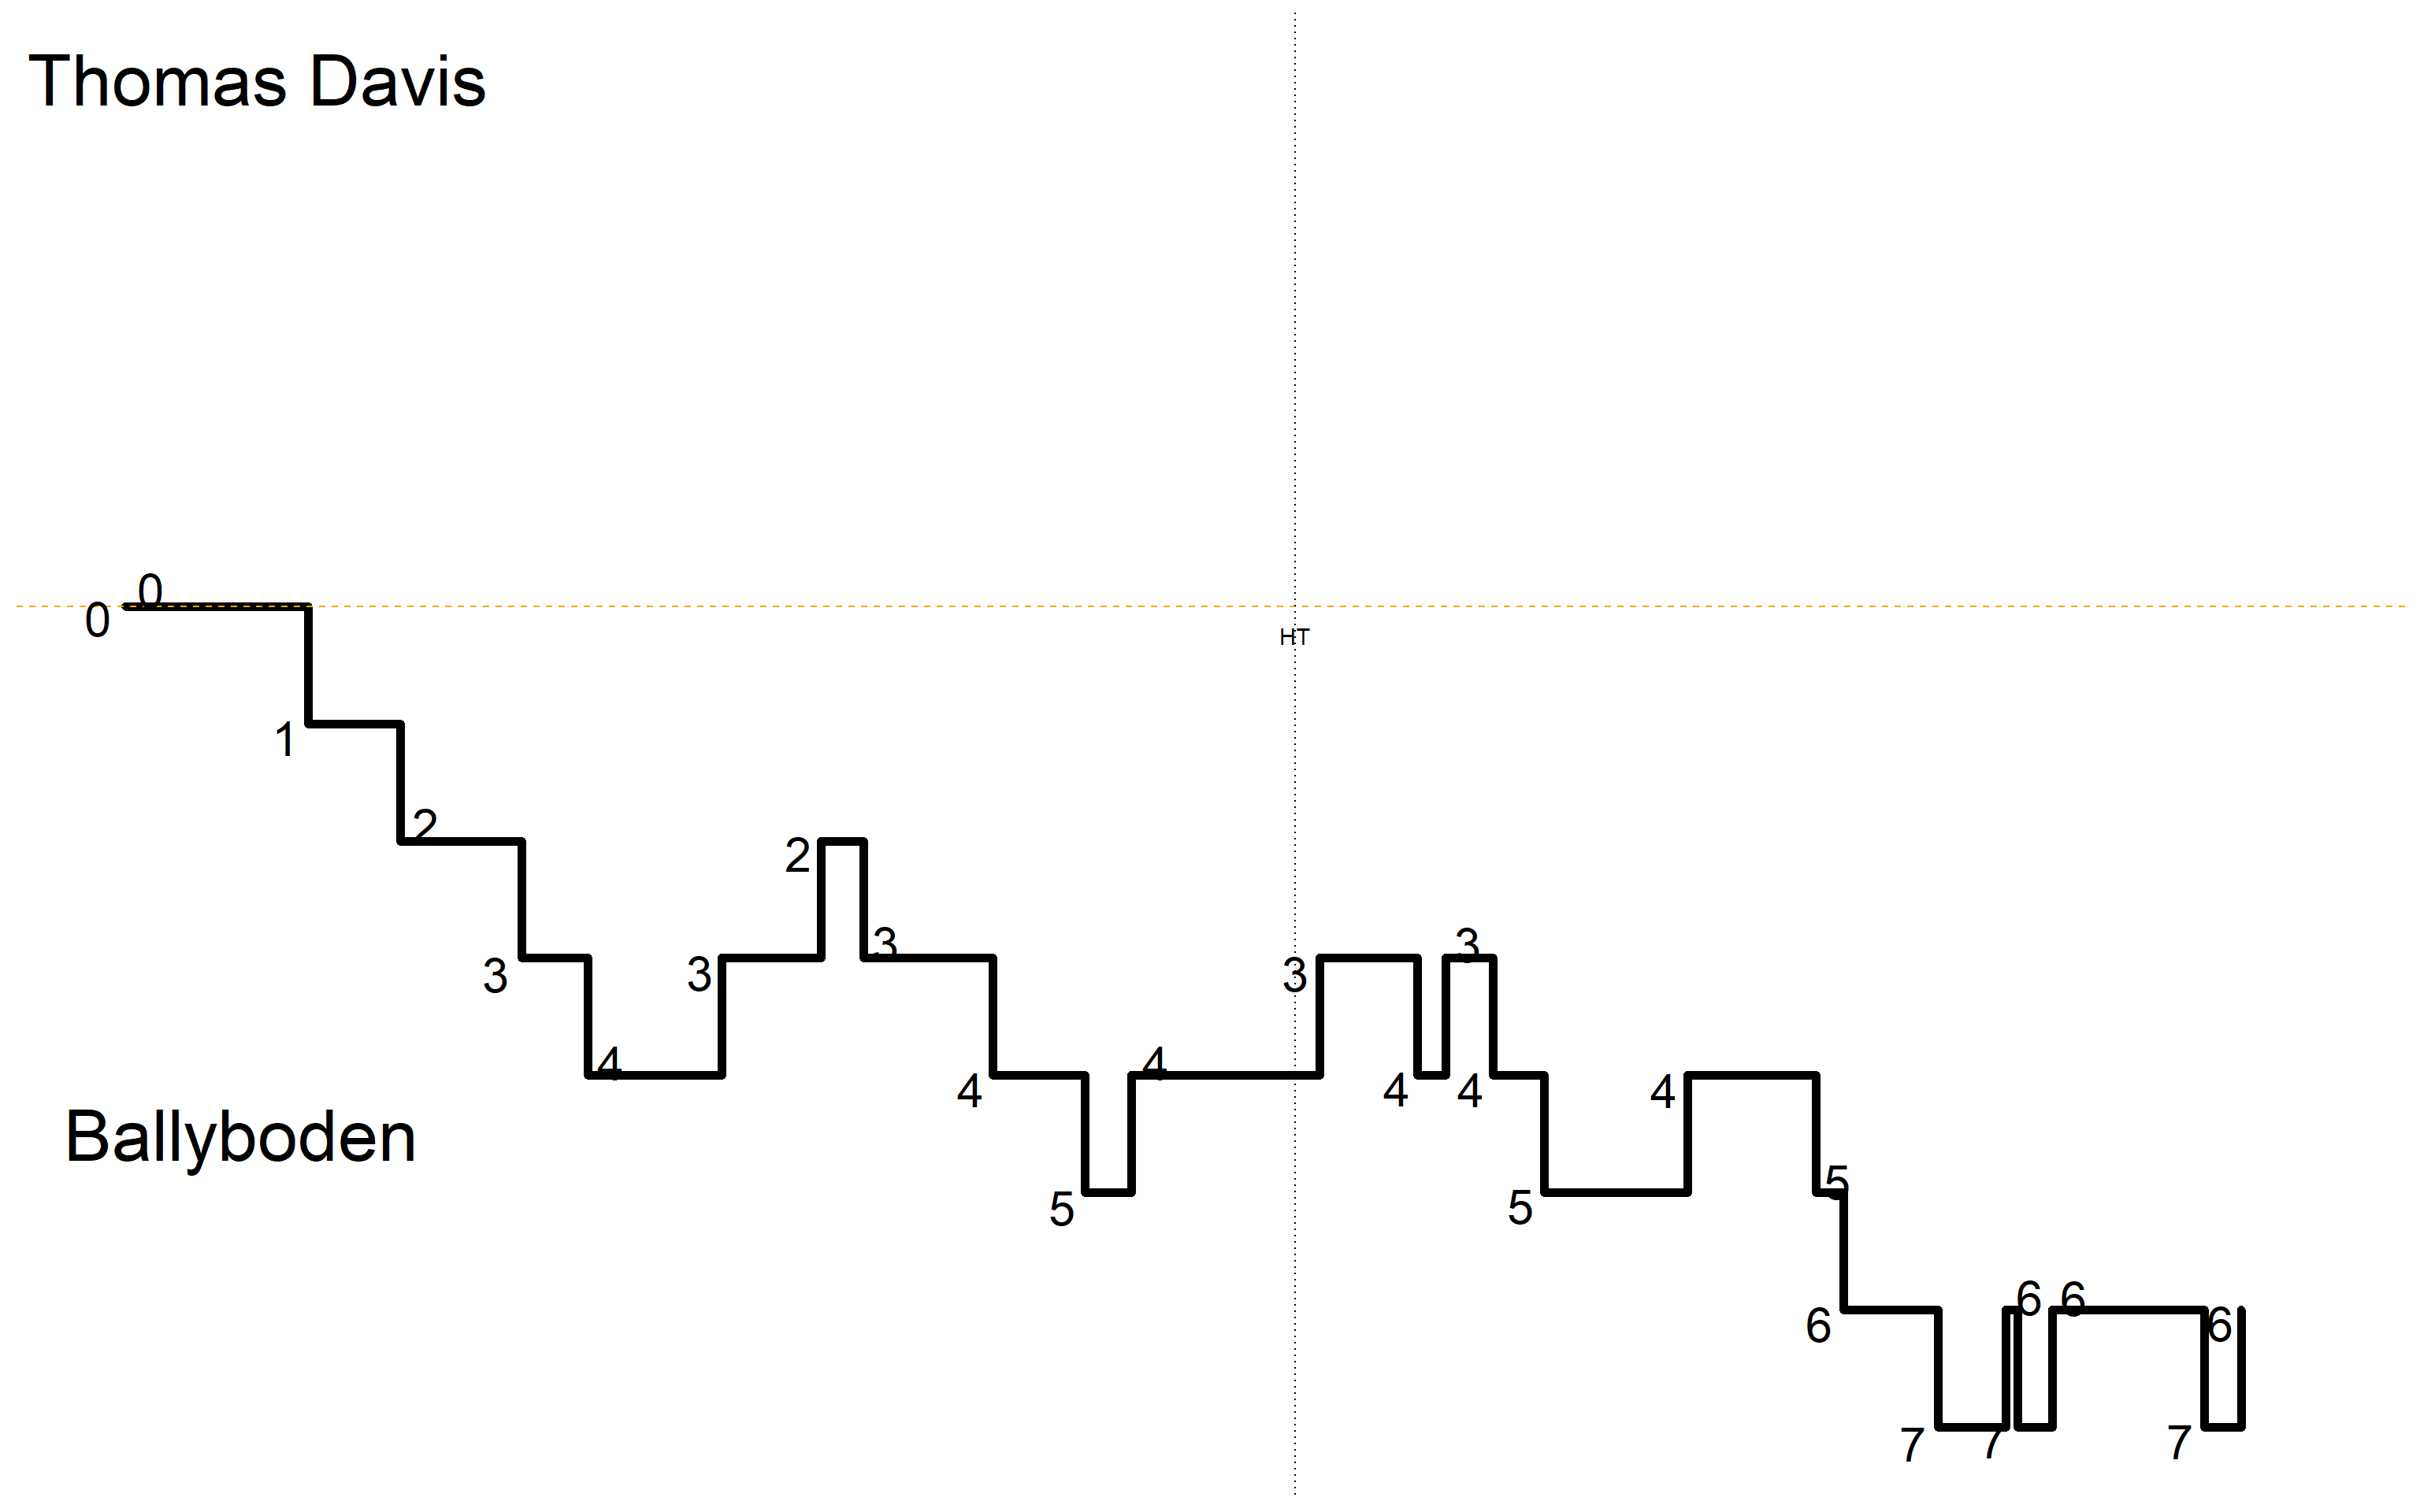
#Positioning & Possessions ##Average Position by Action ###Thomas Davis ###Game 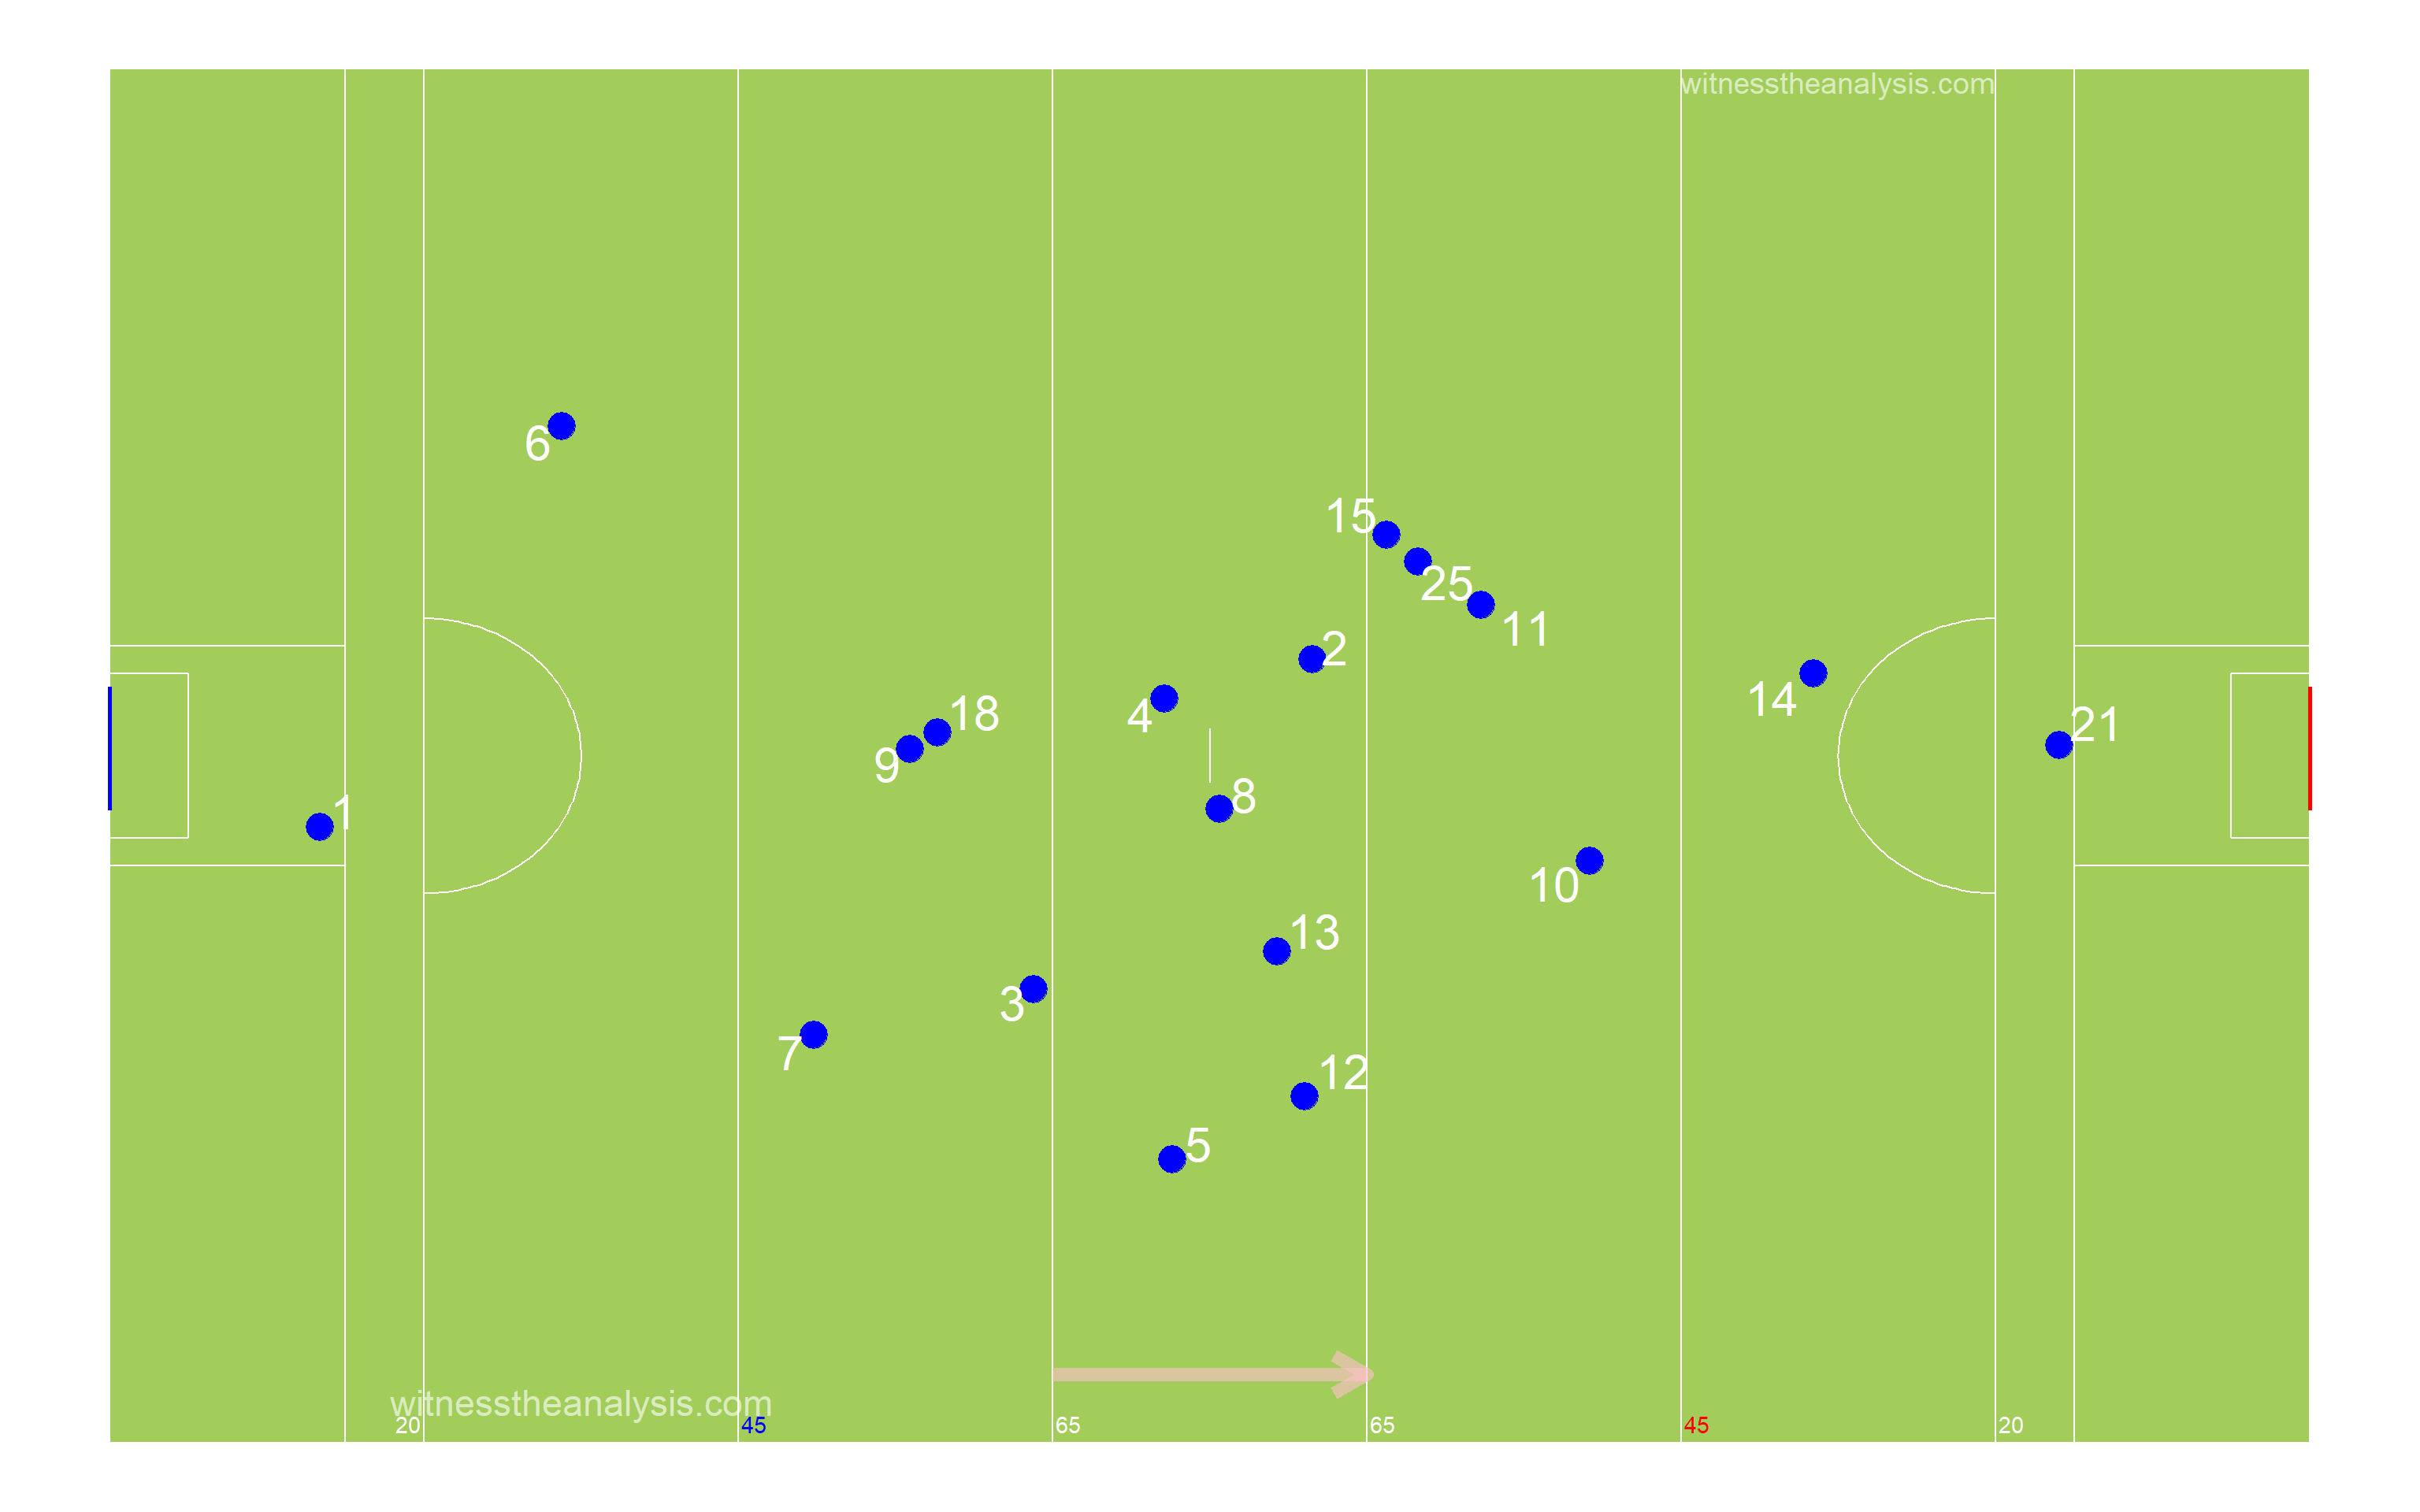
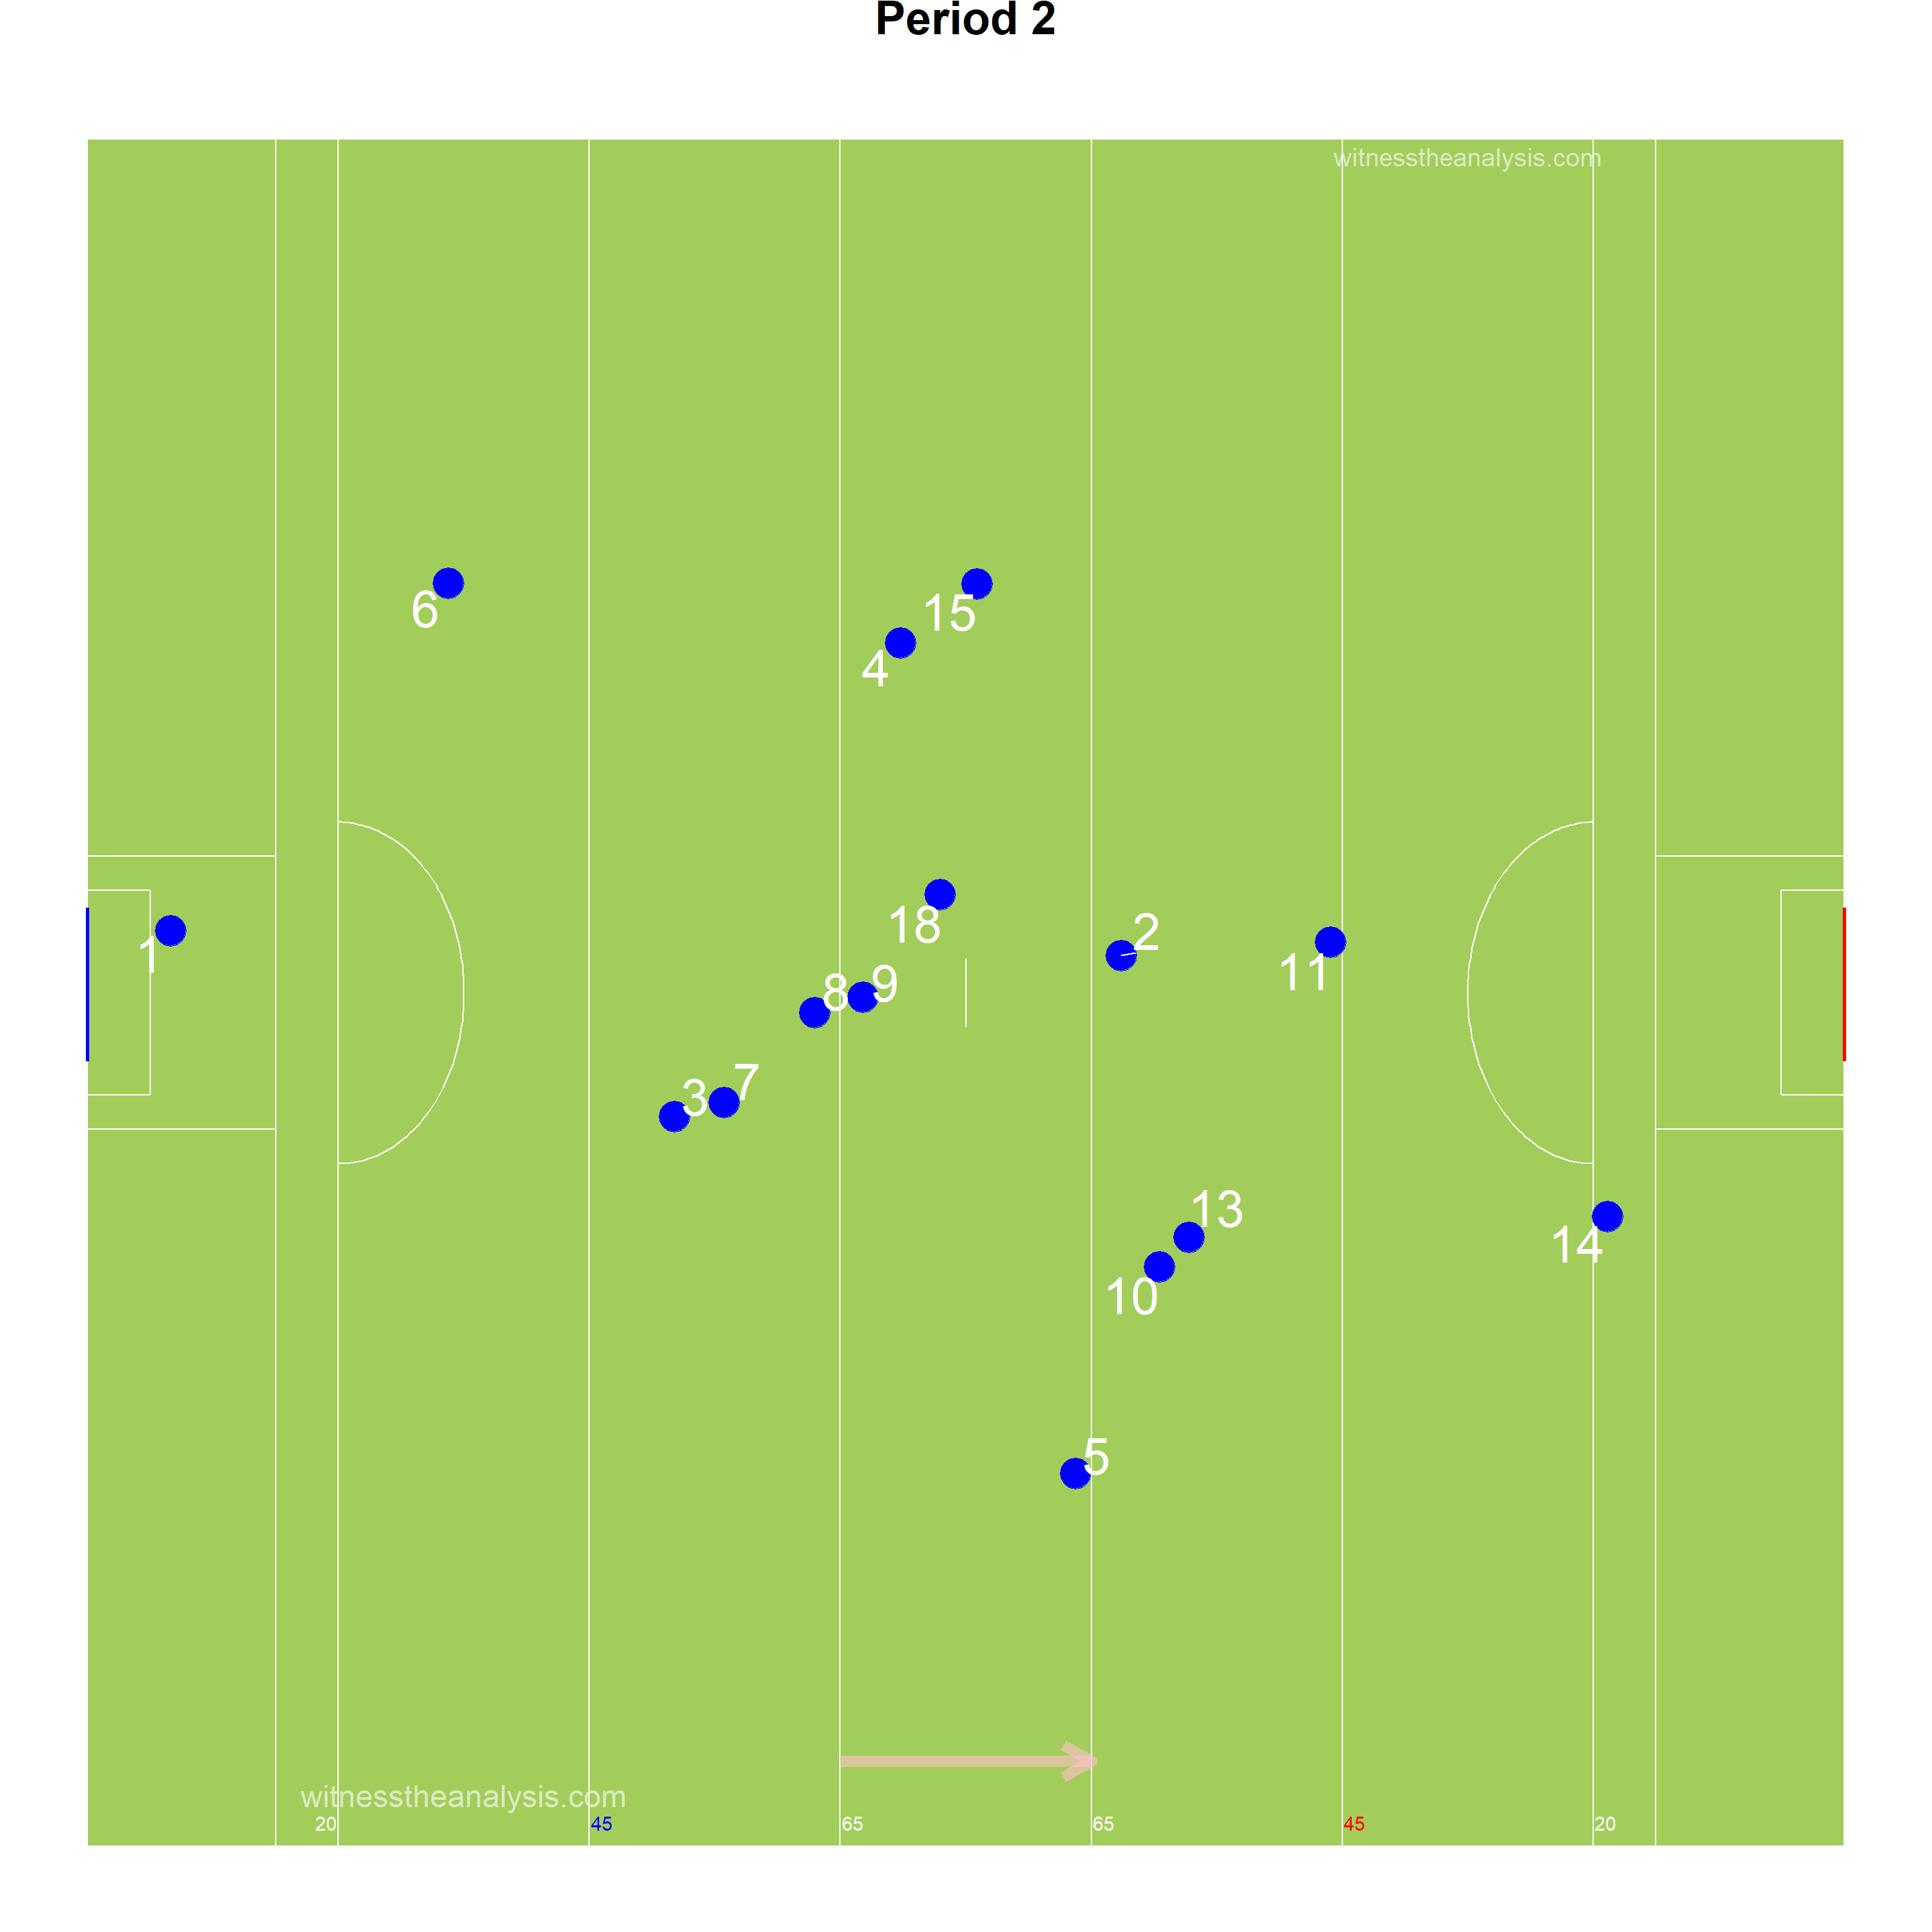
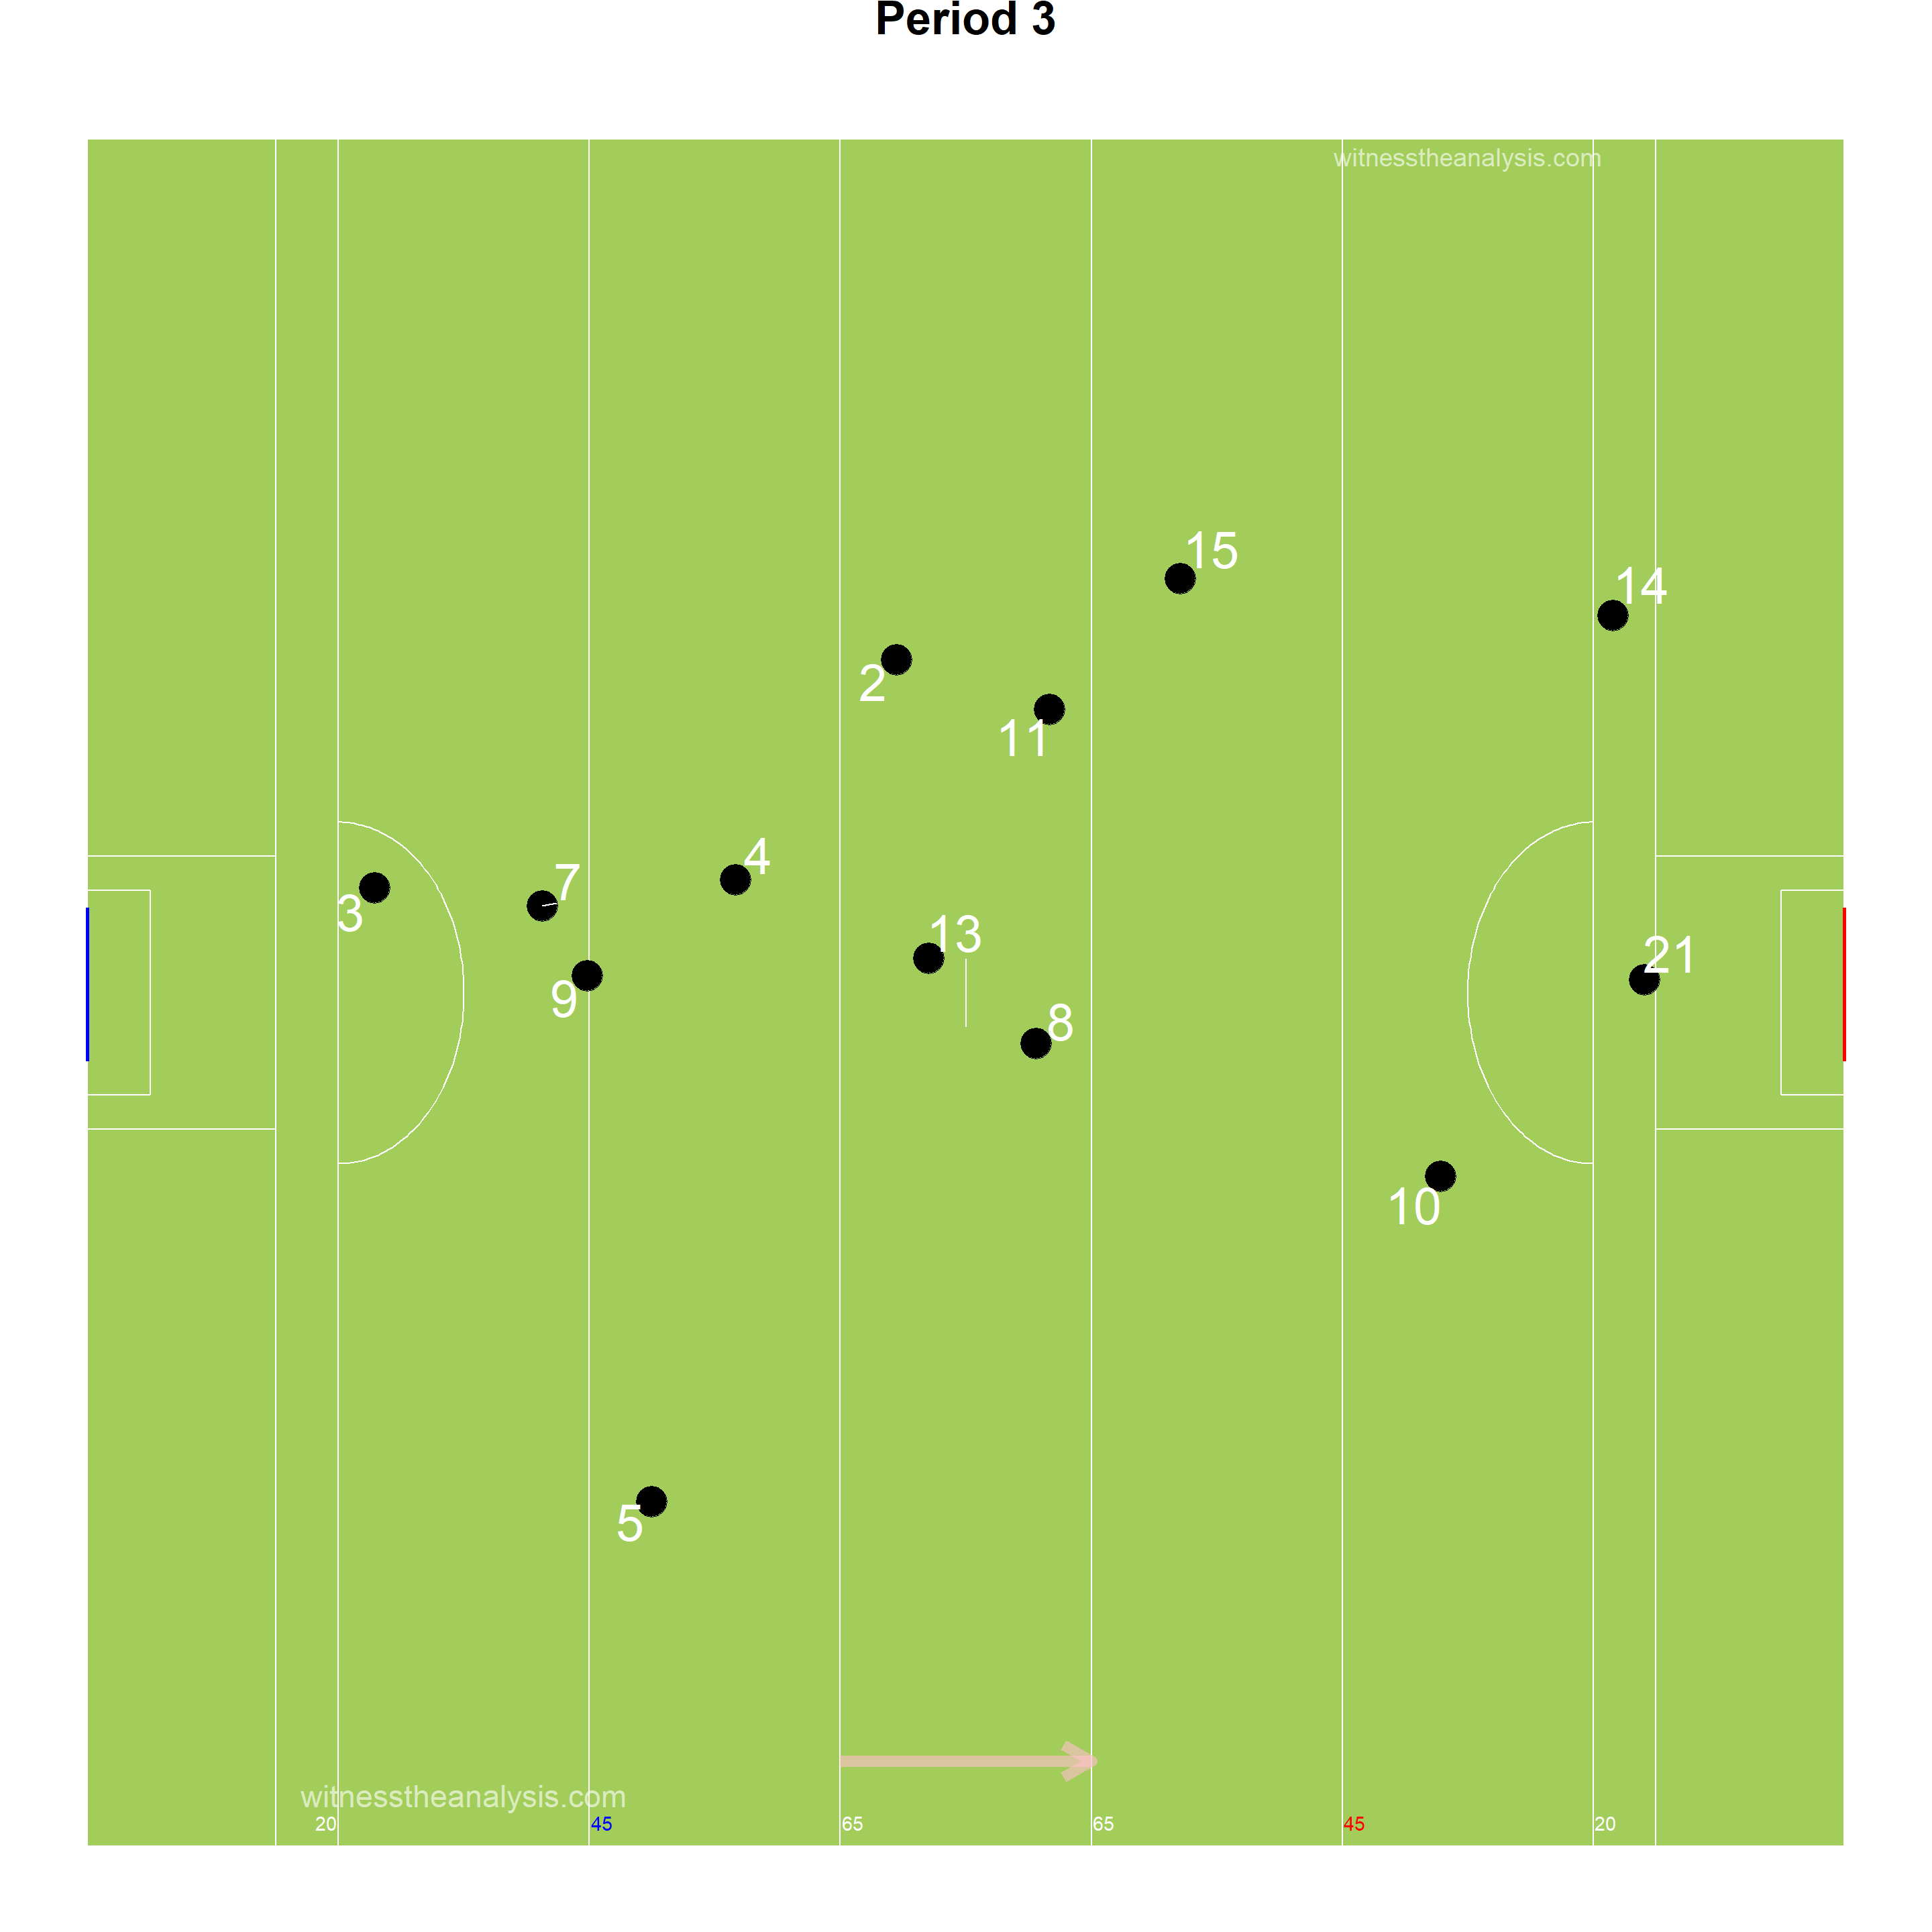
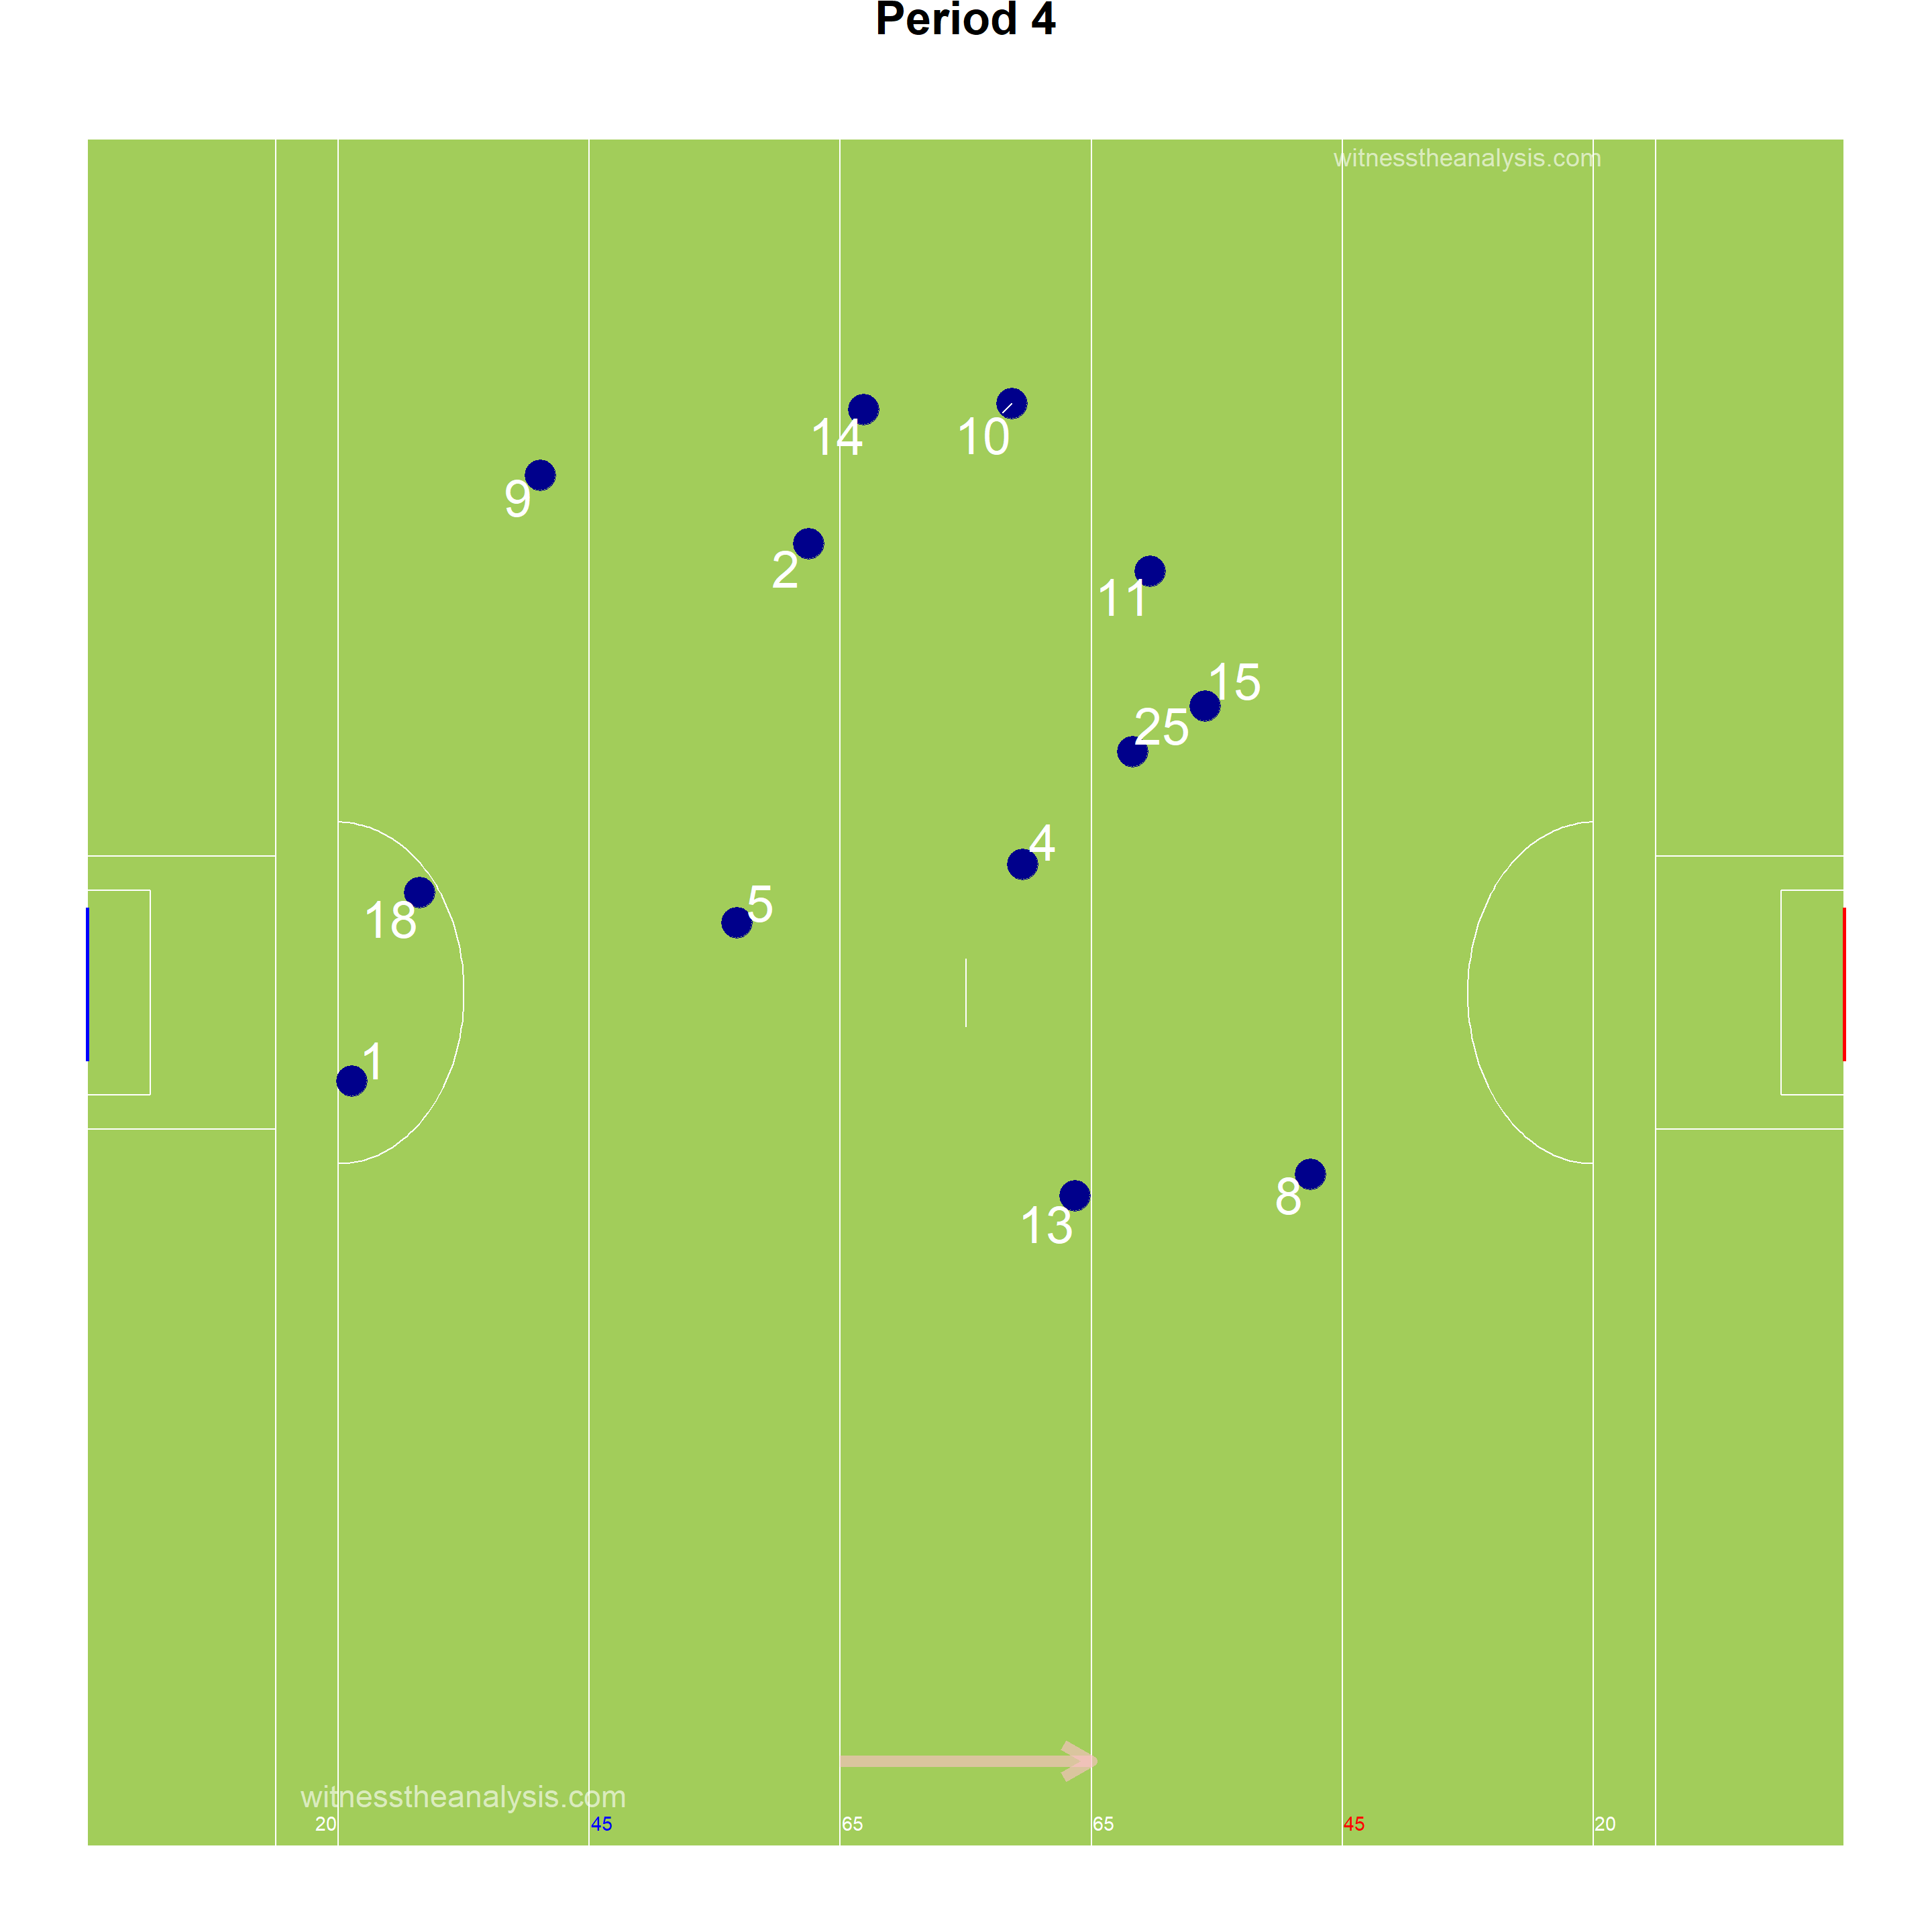
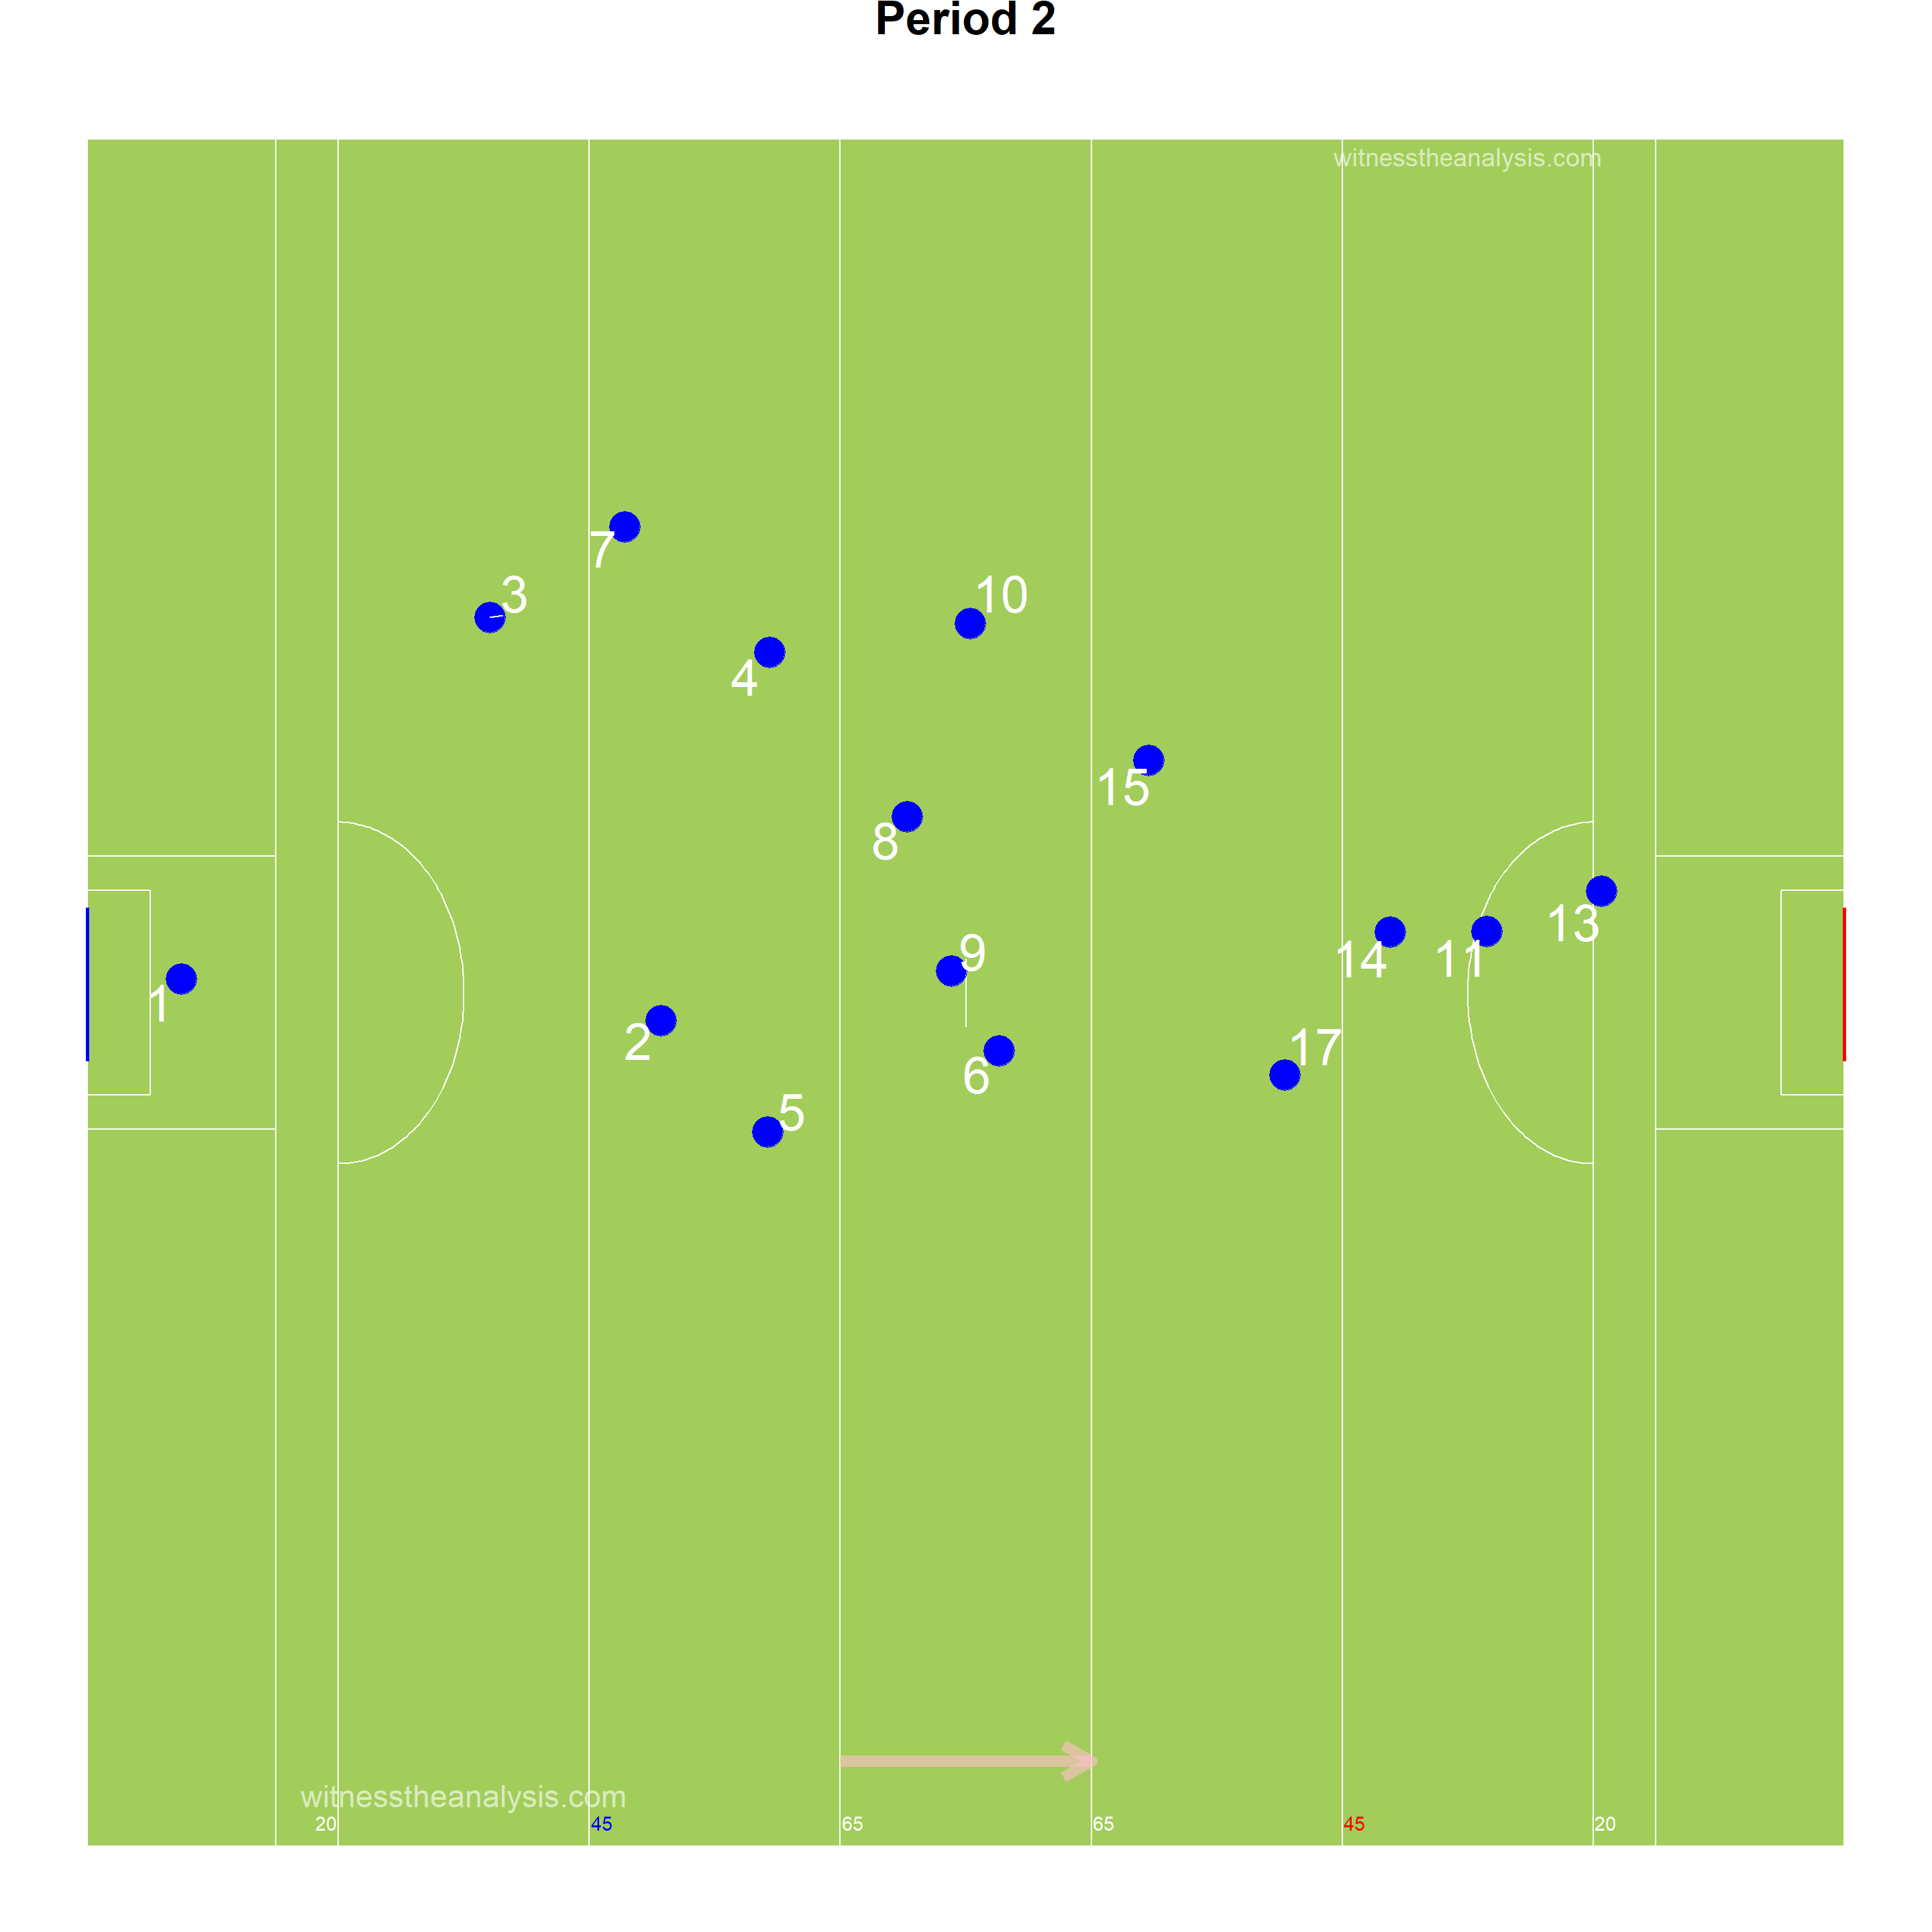
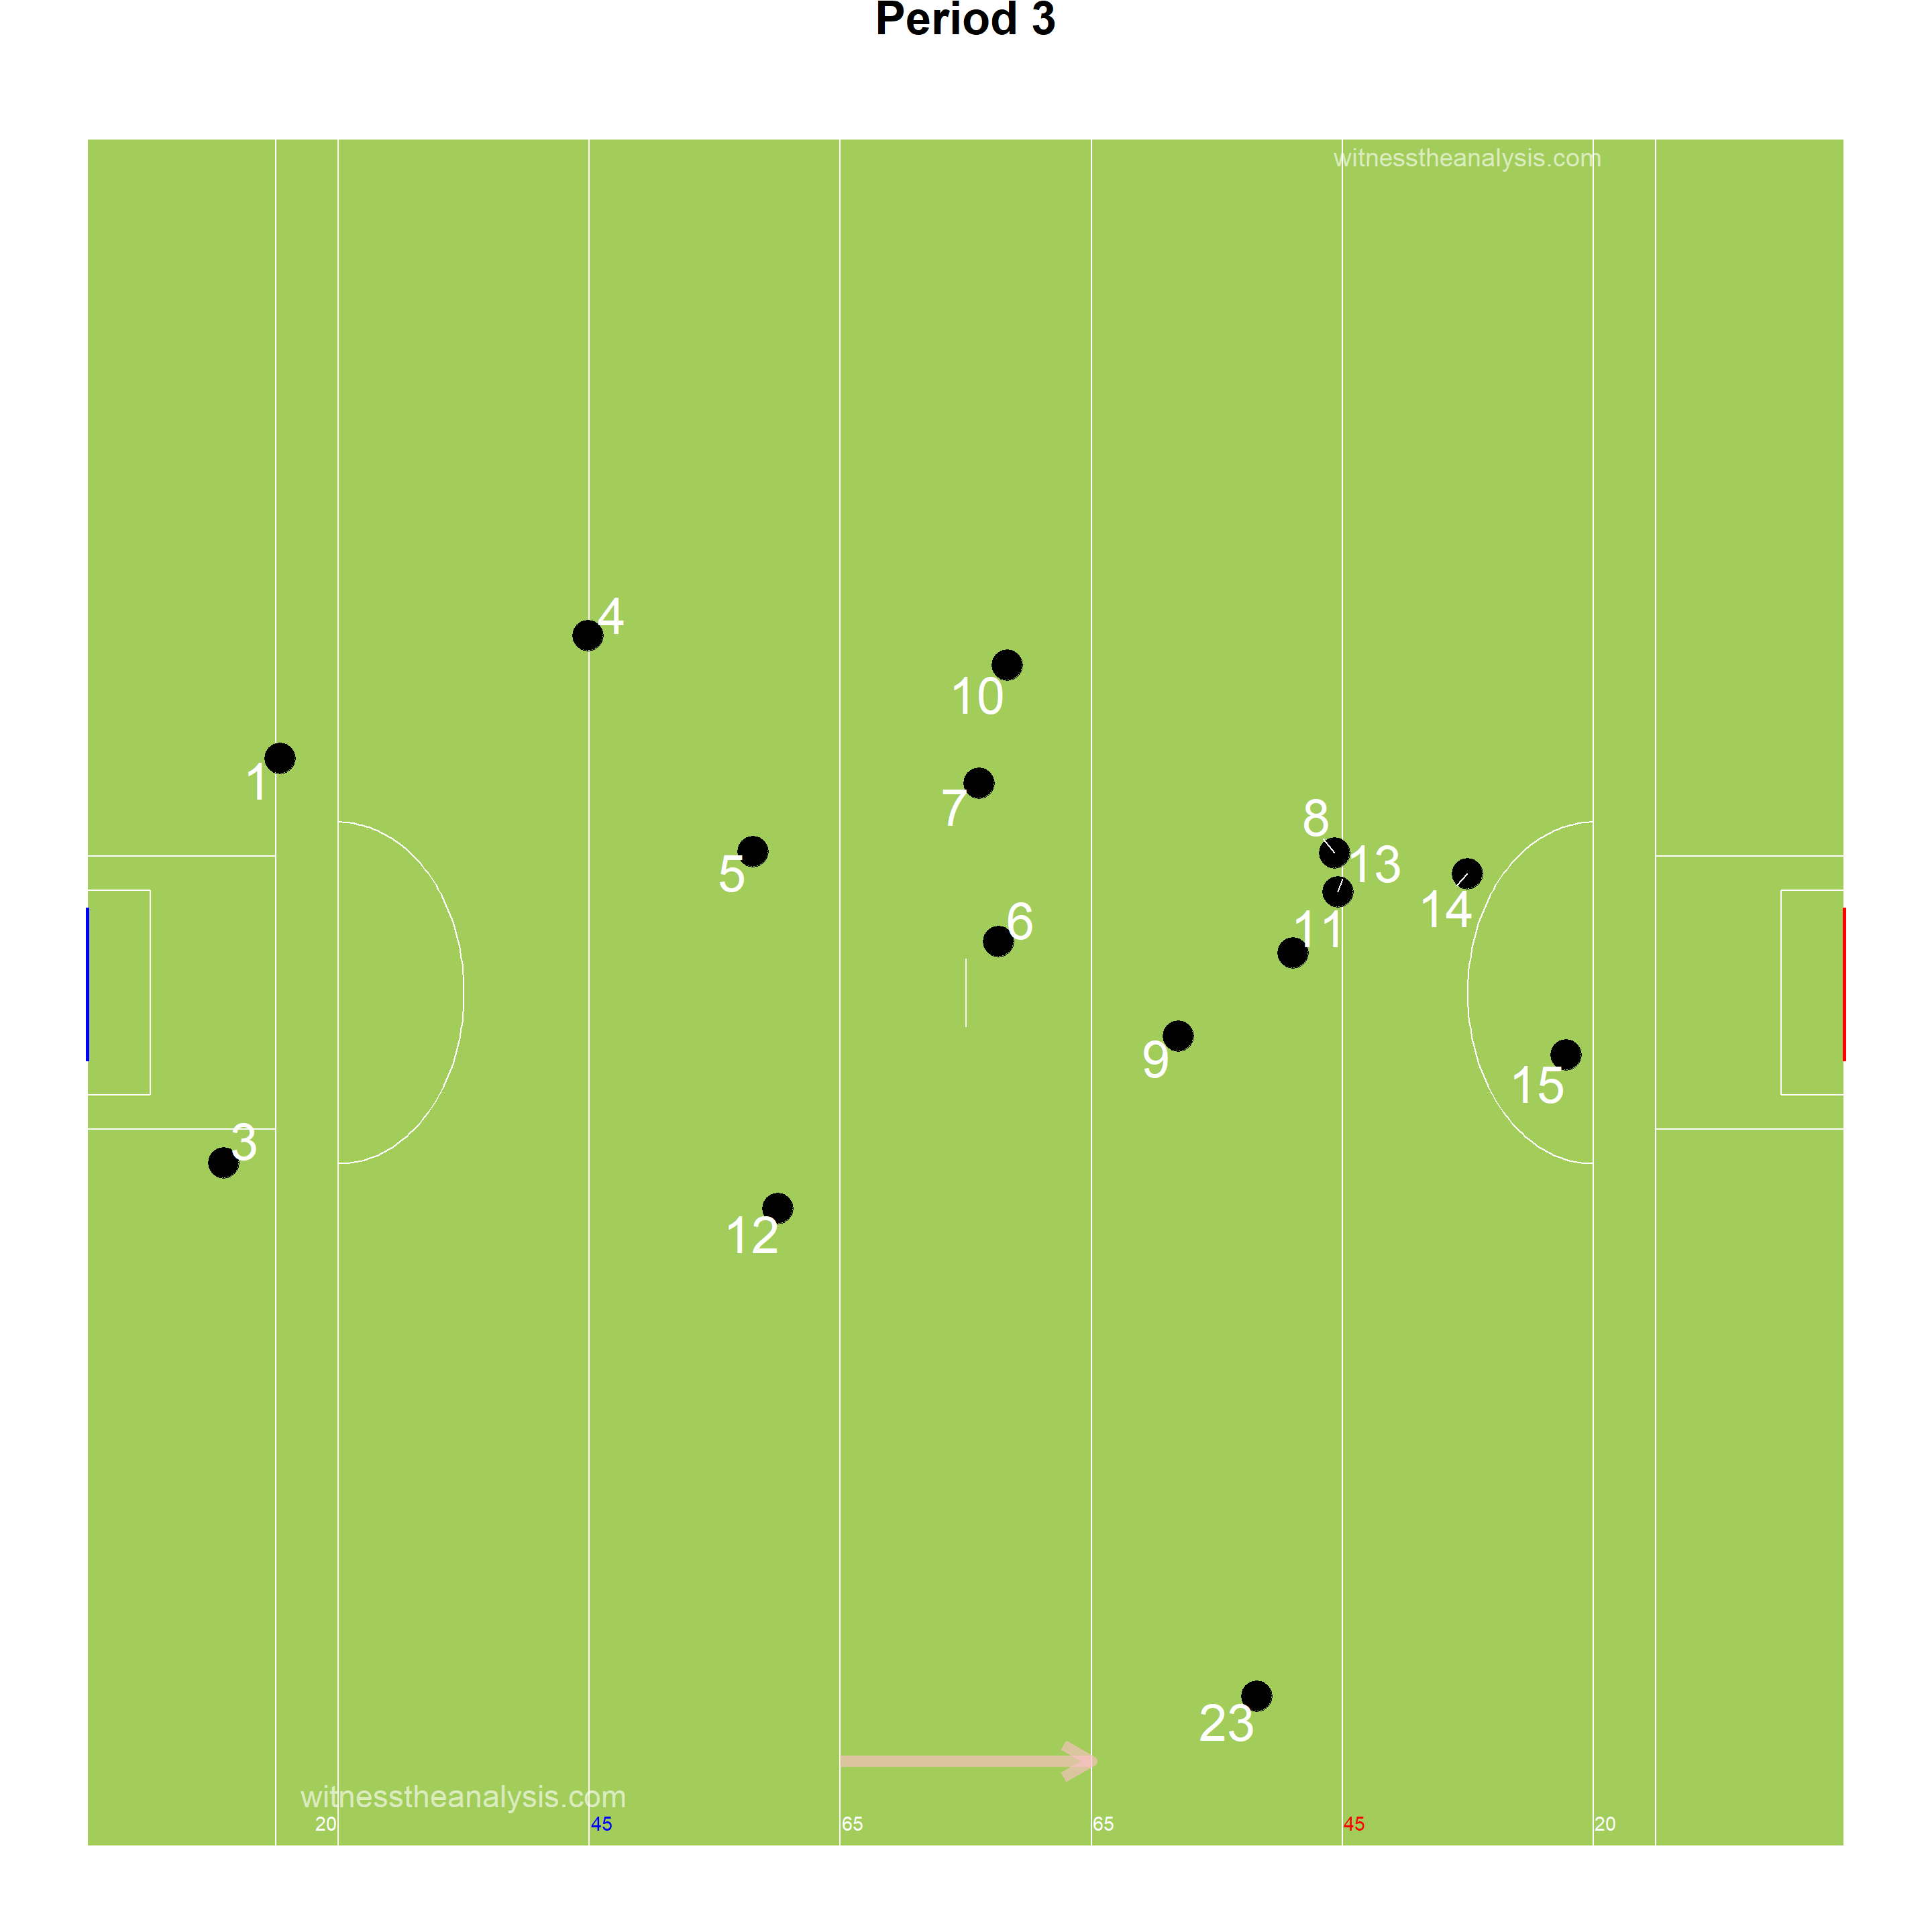
###Period 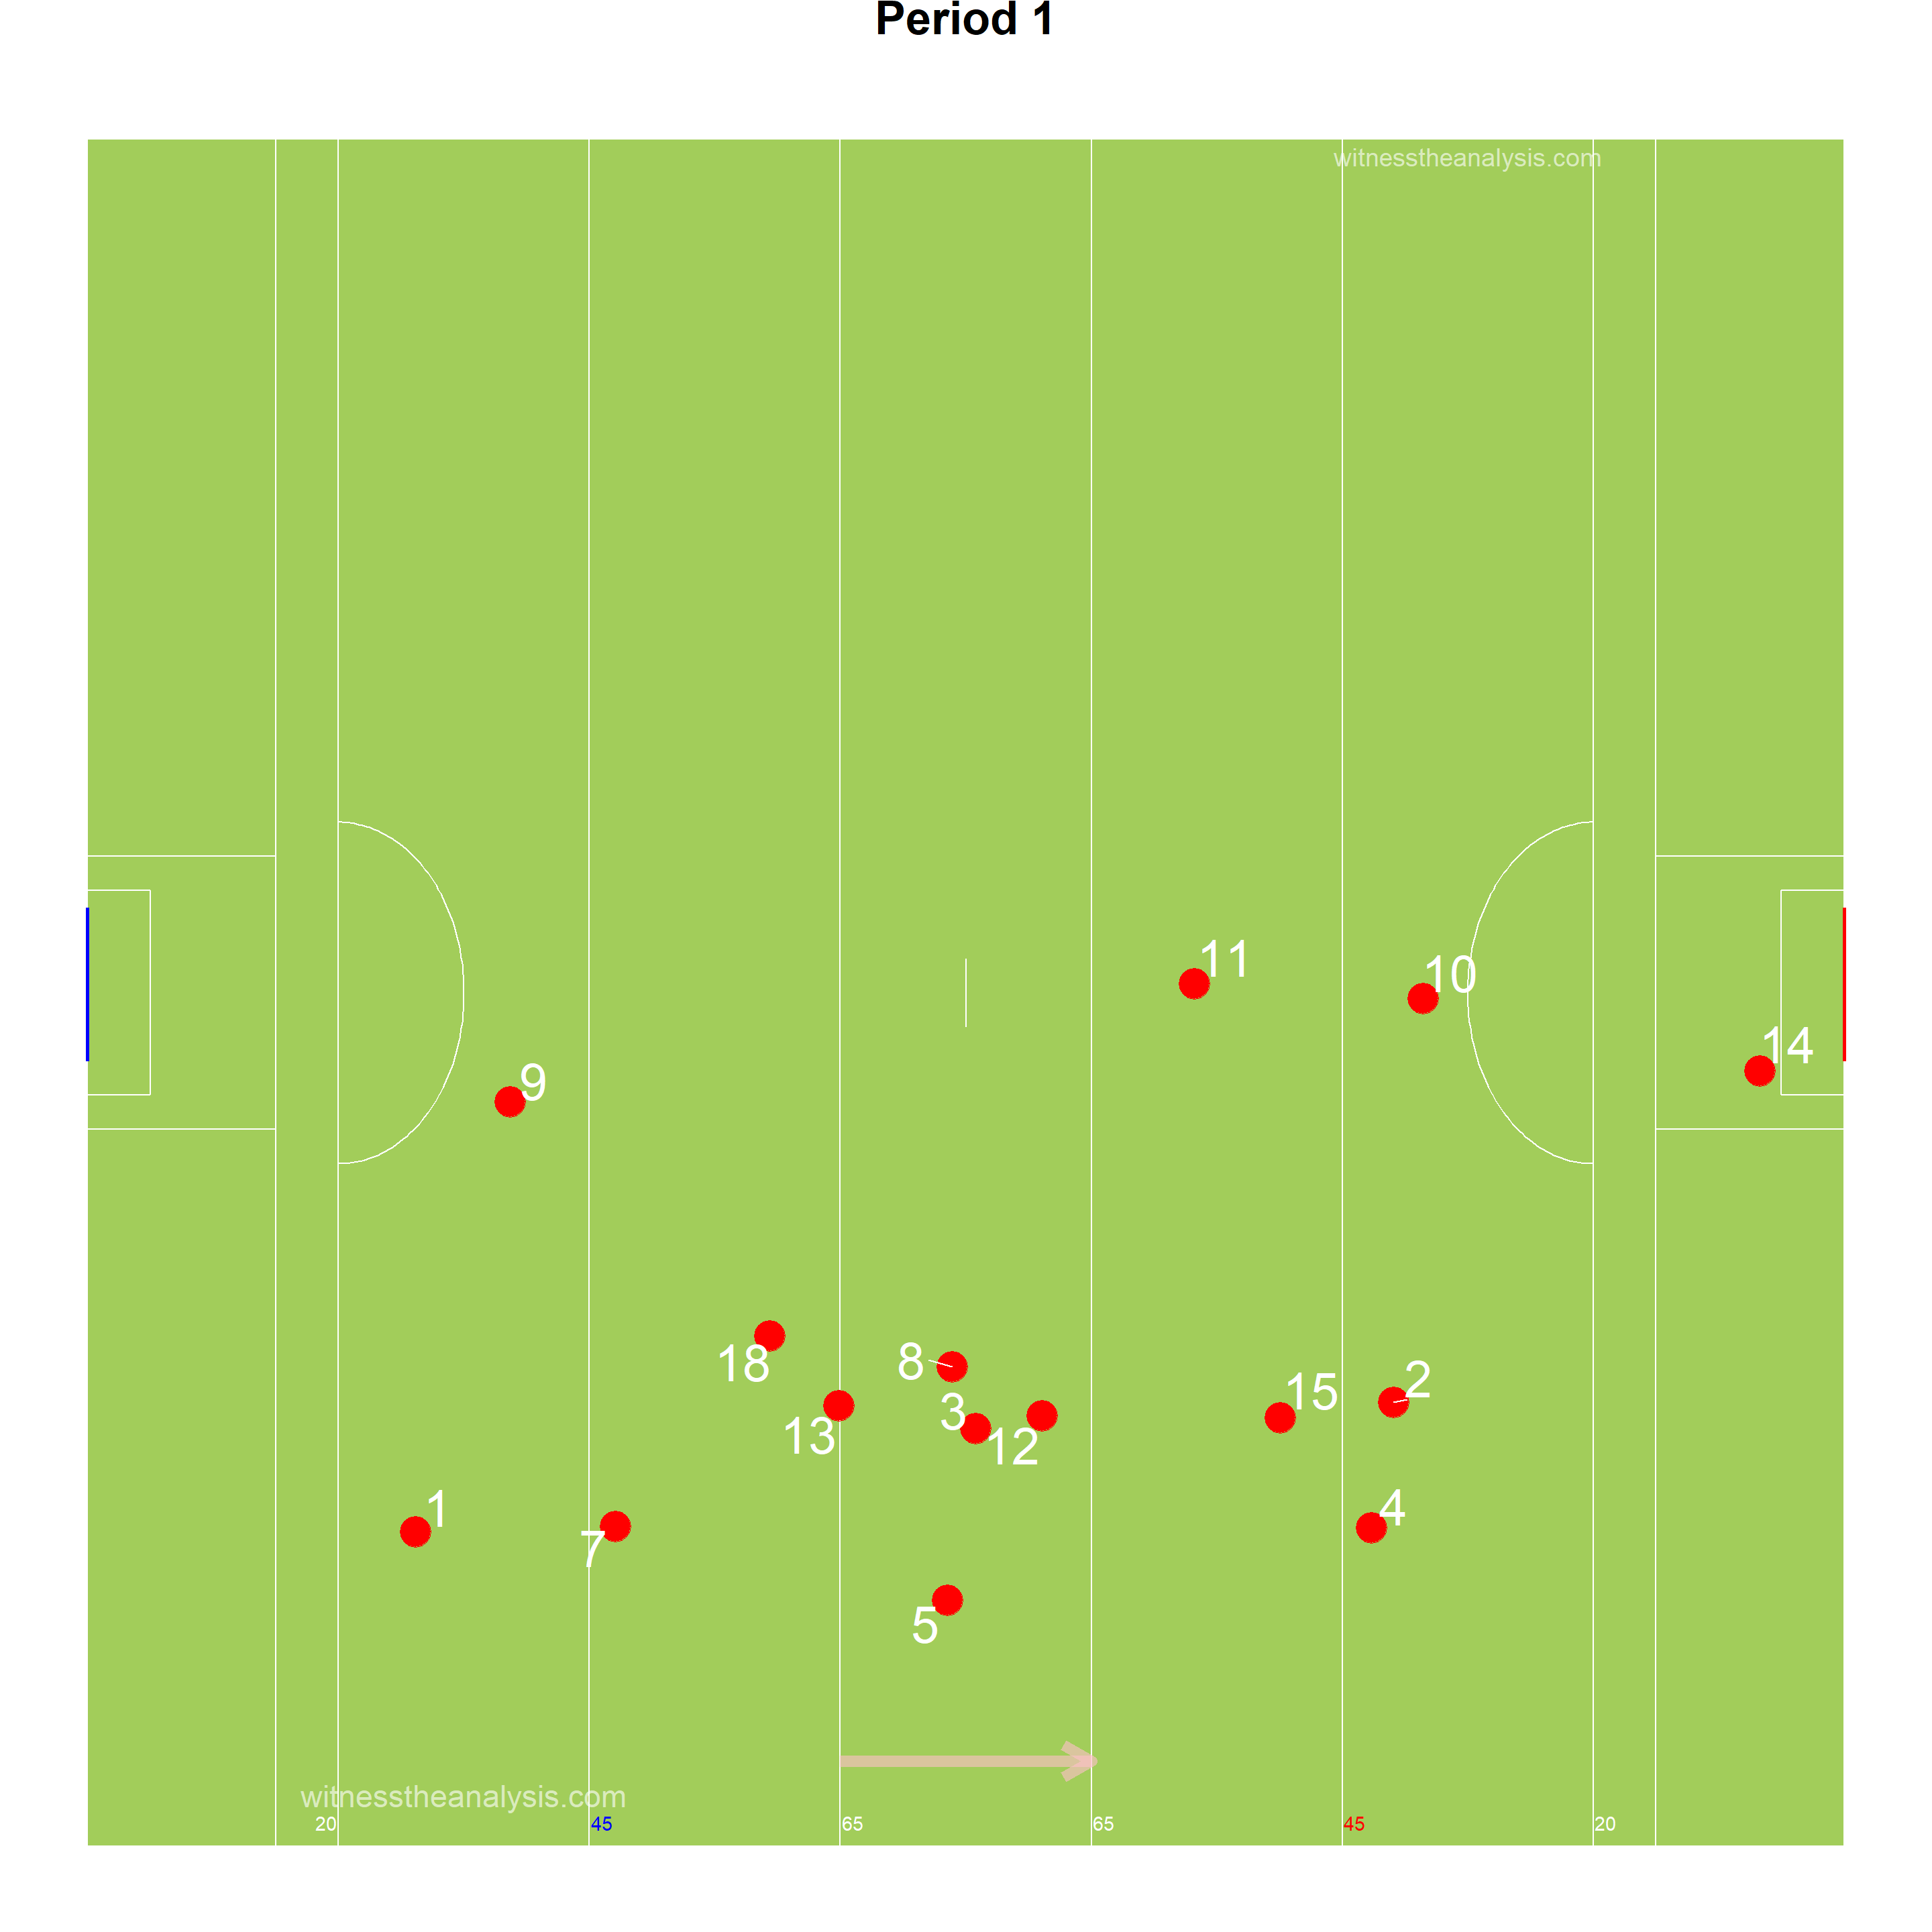
###Ballyboden ###Game 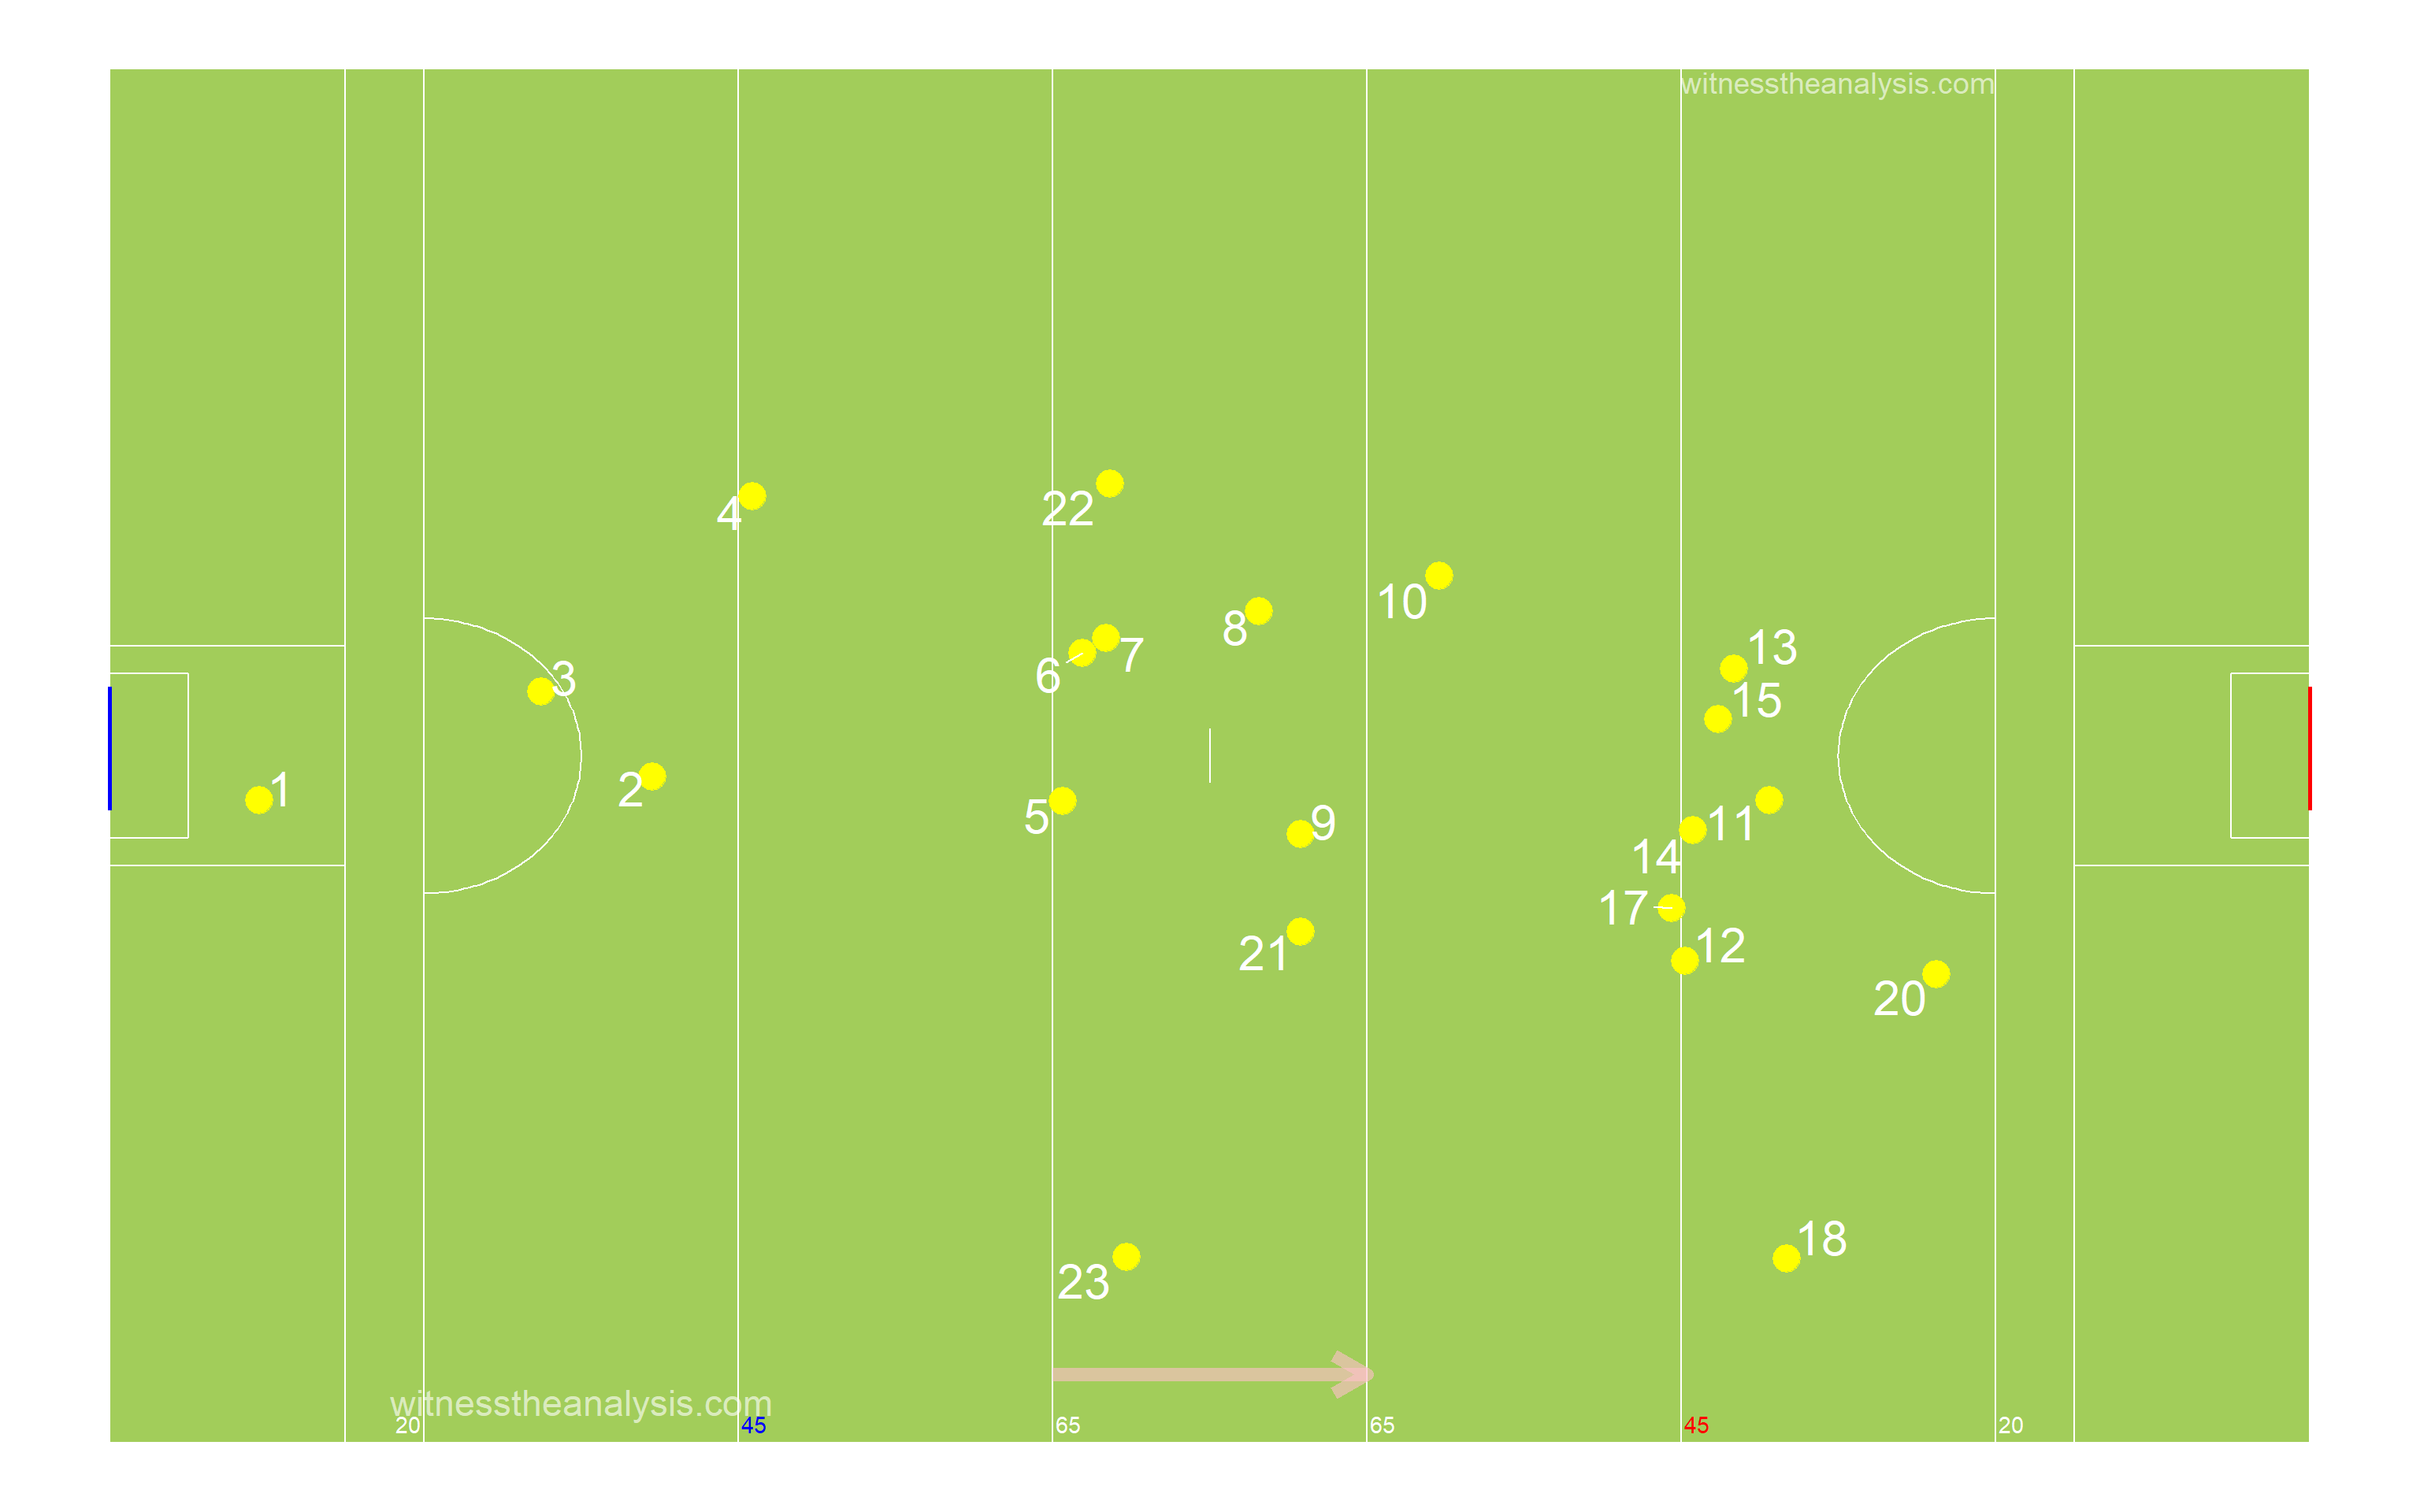
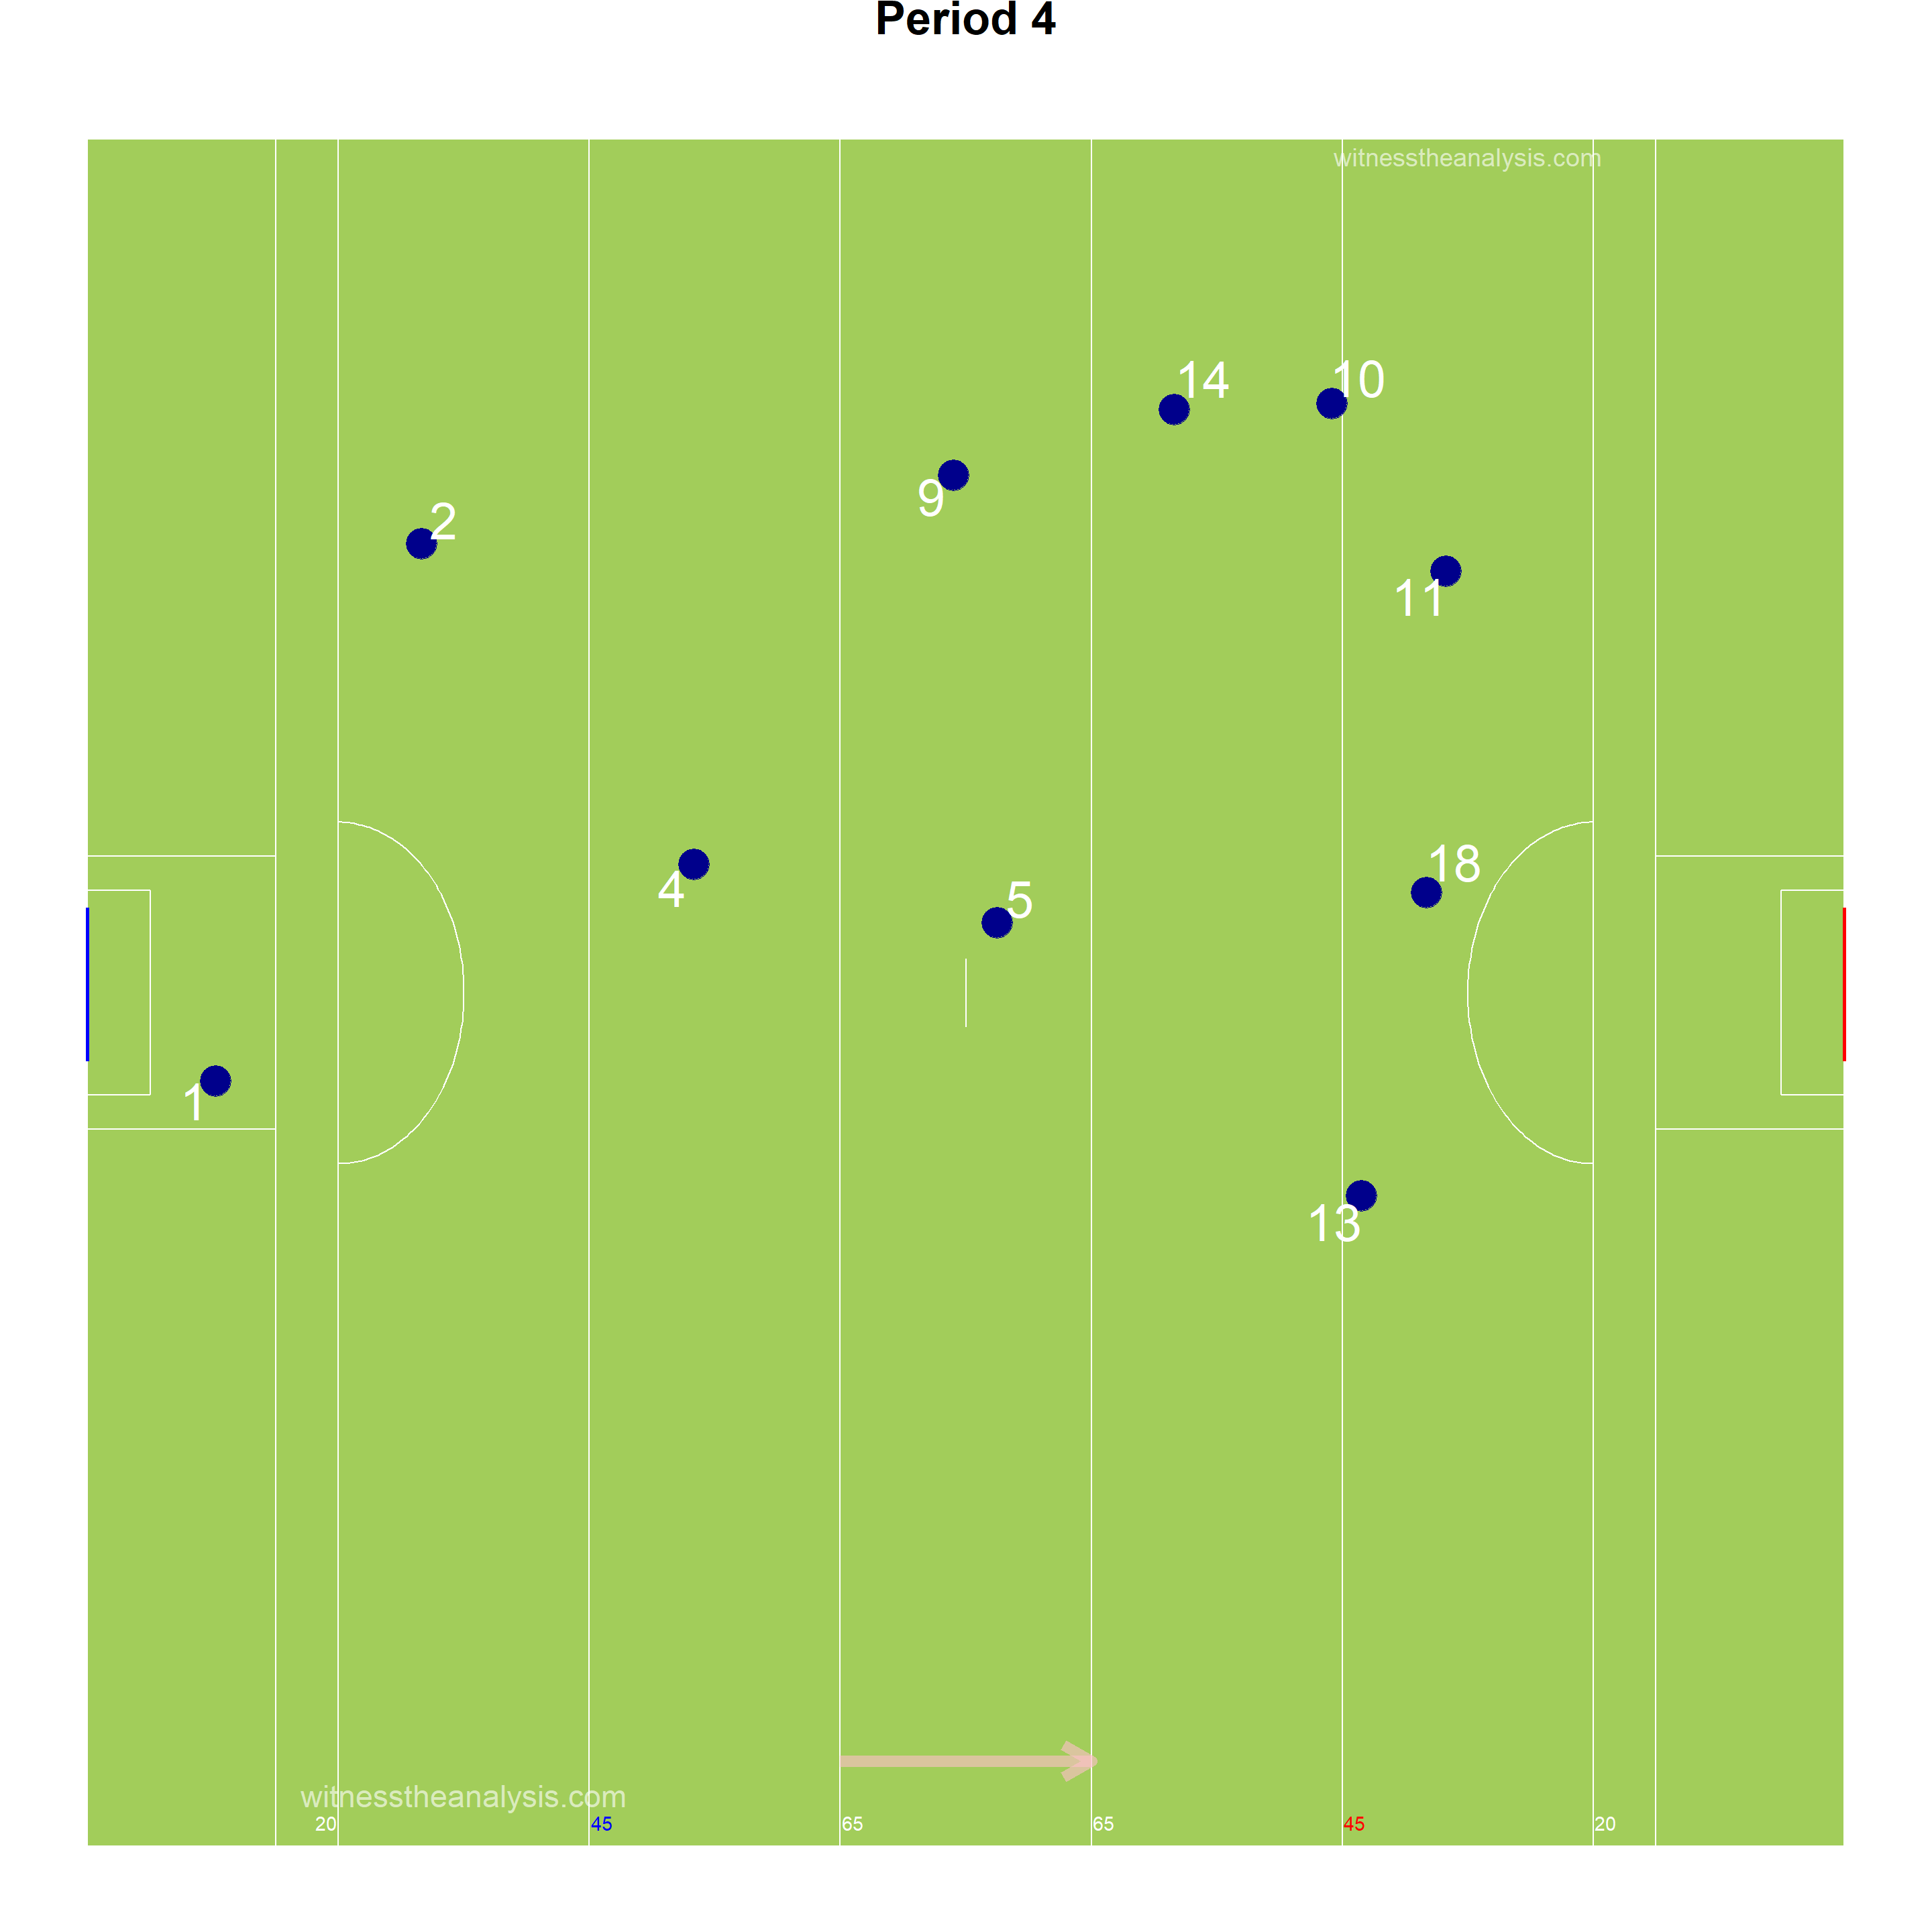
###Period 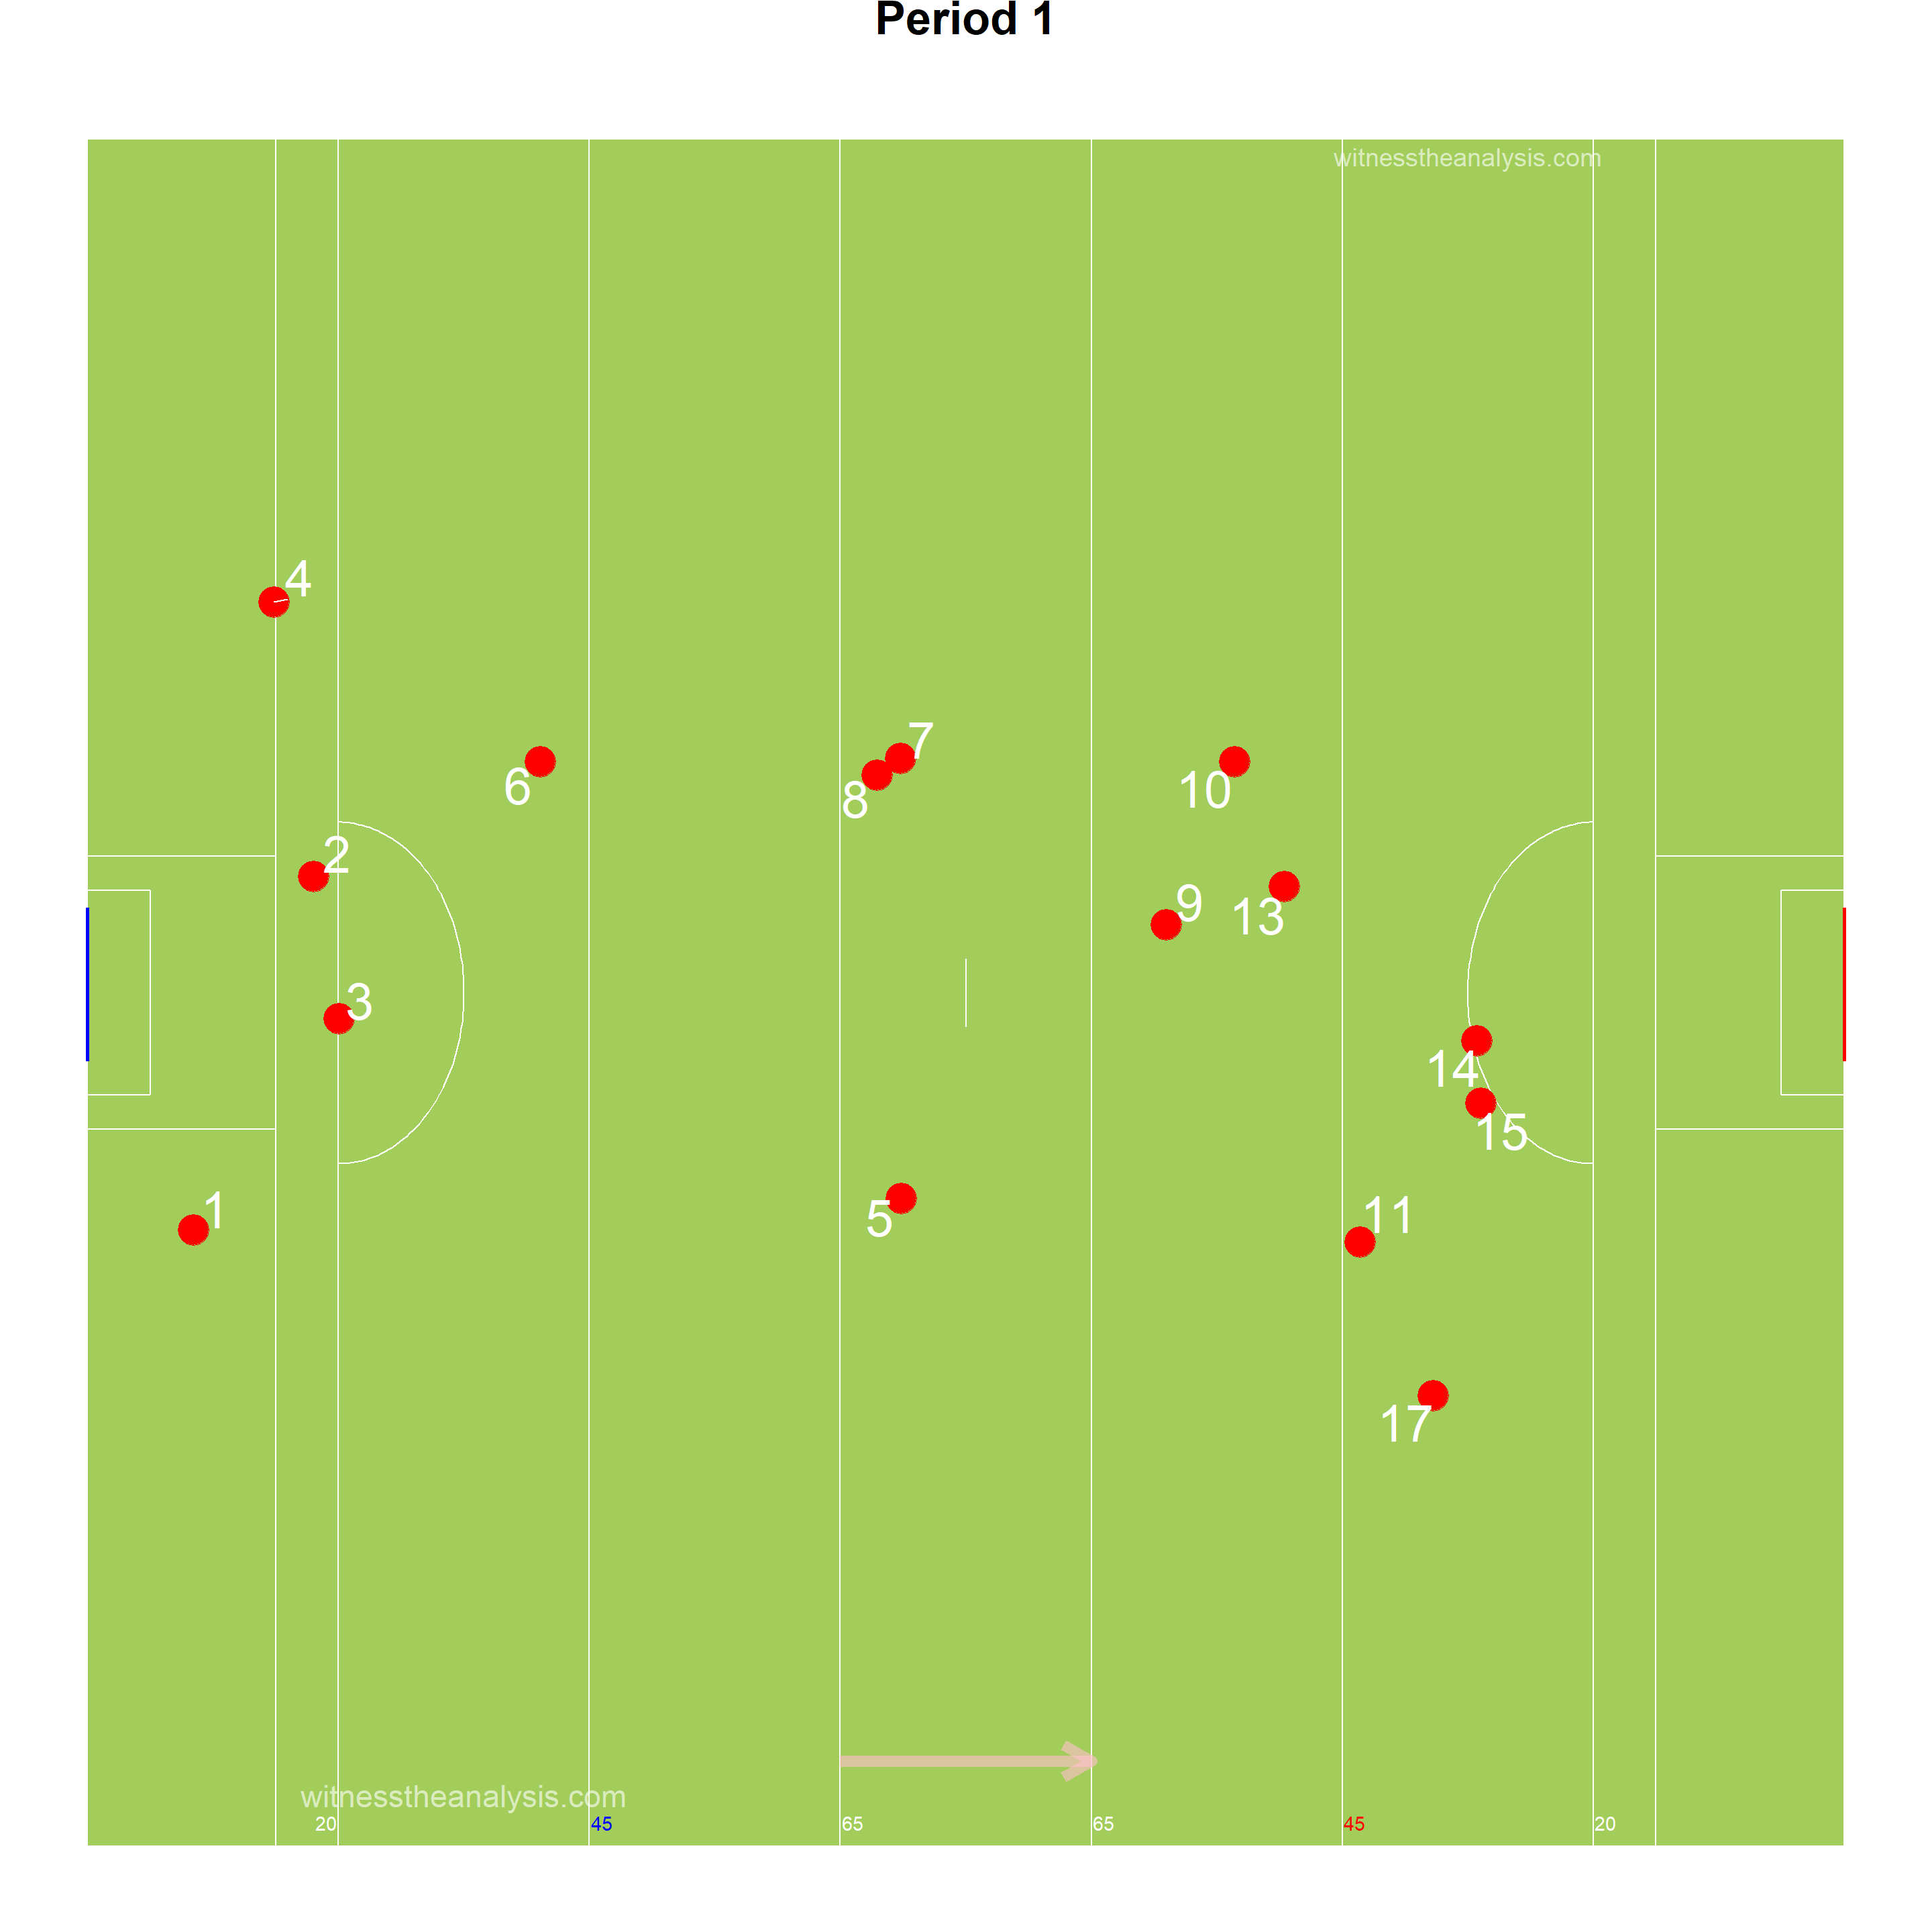
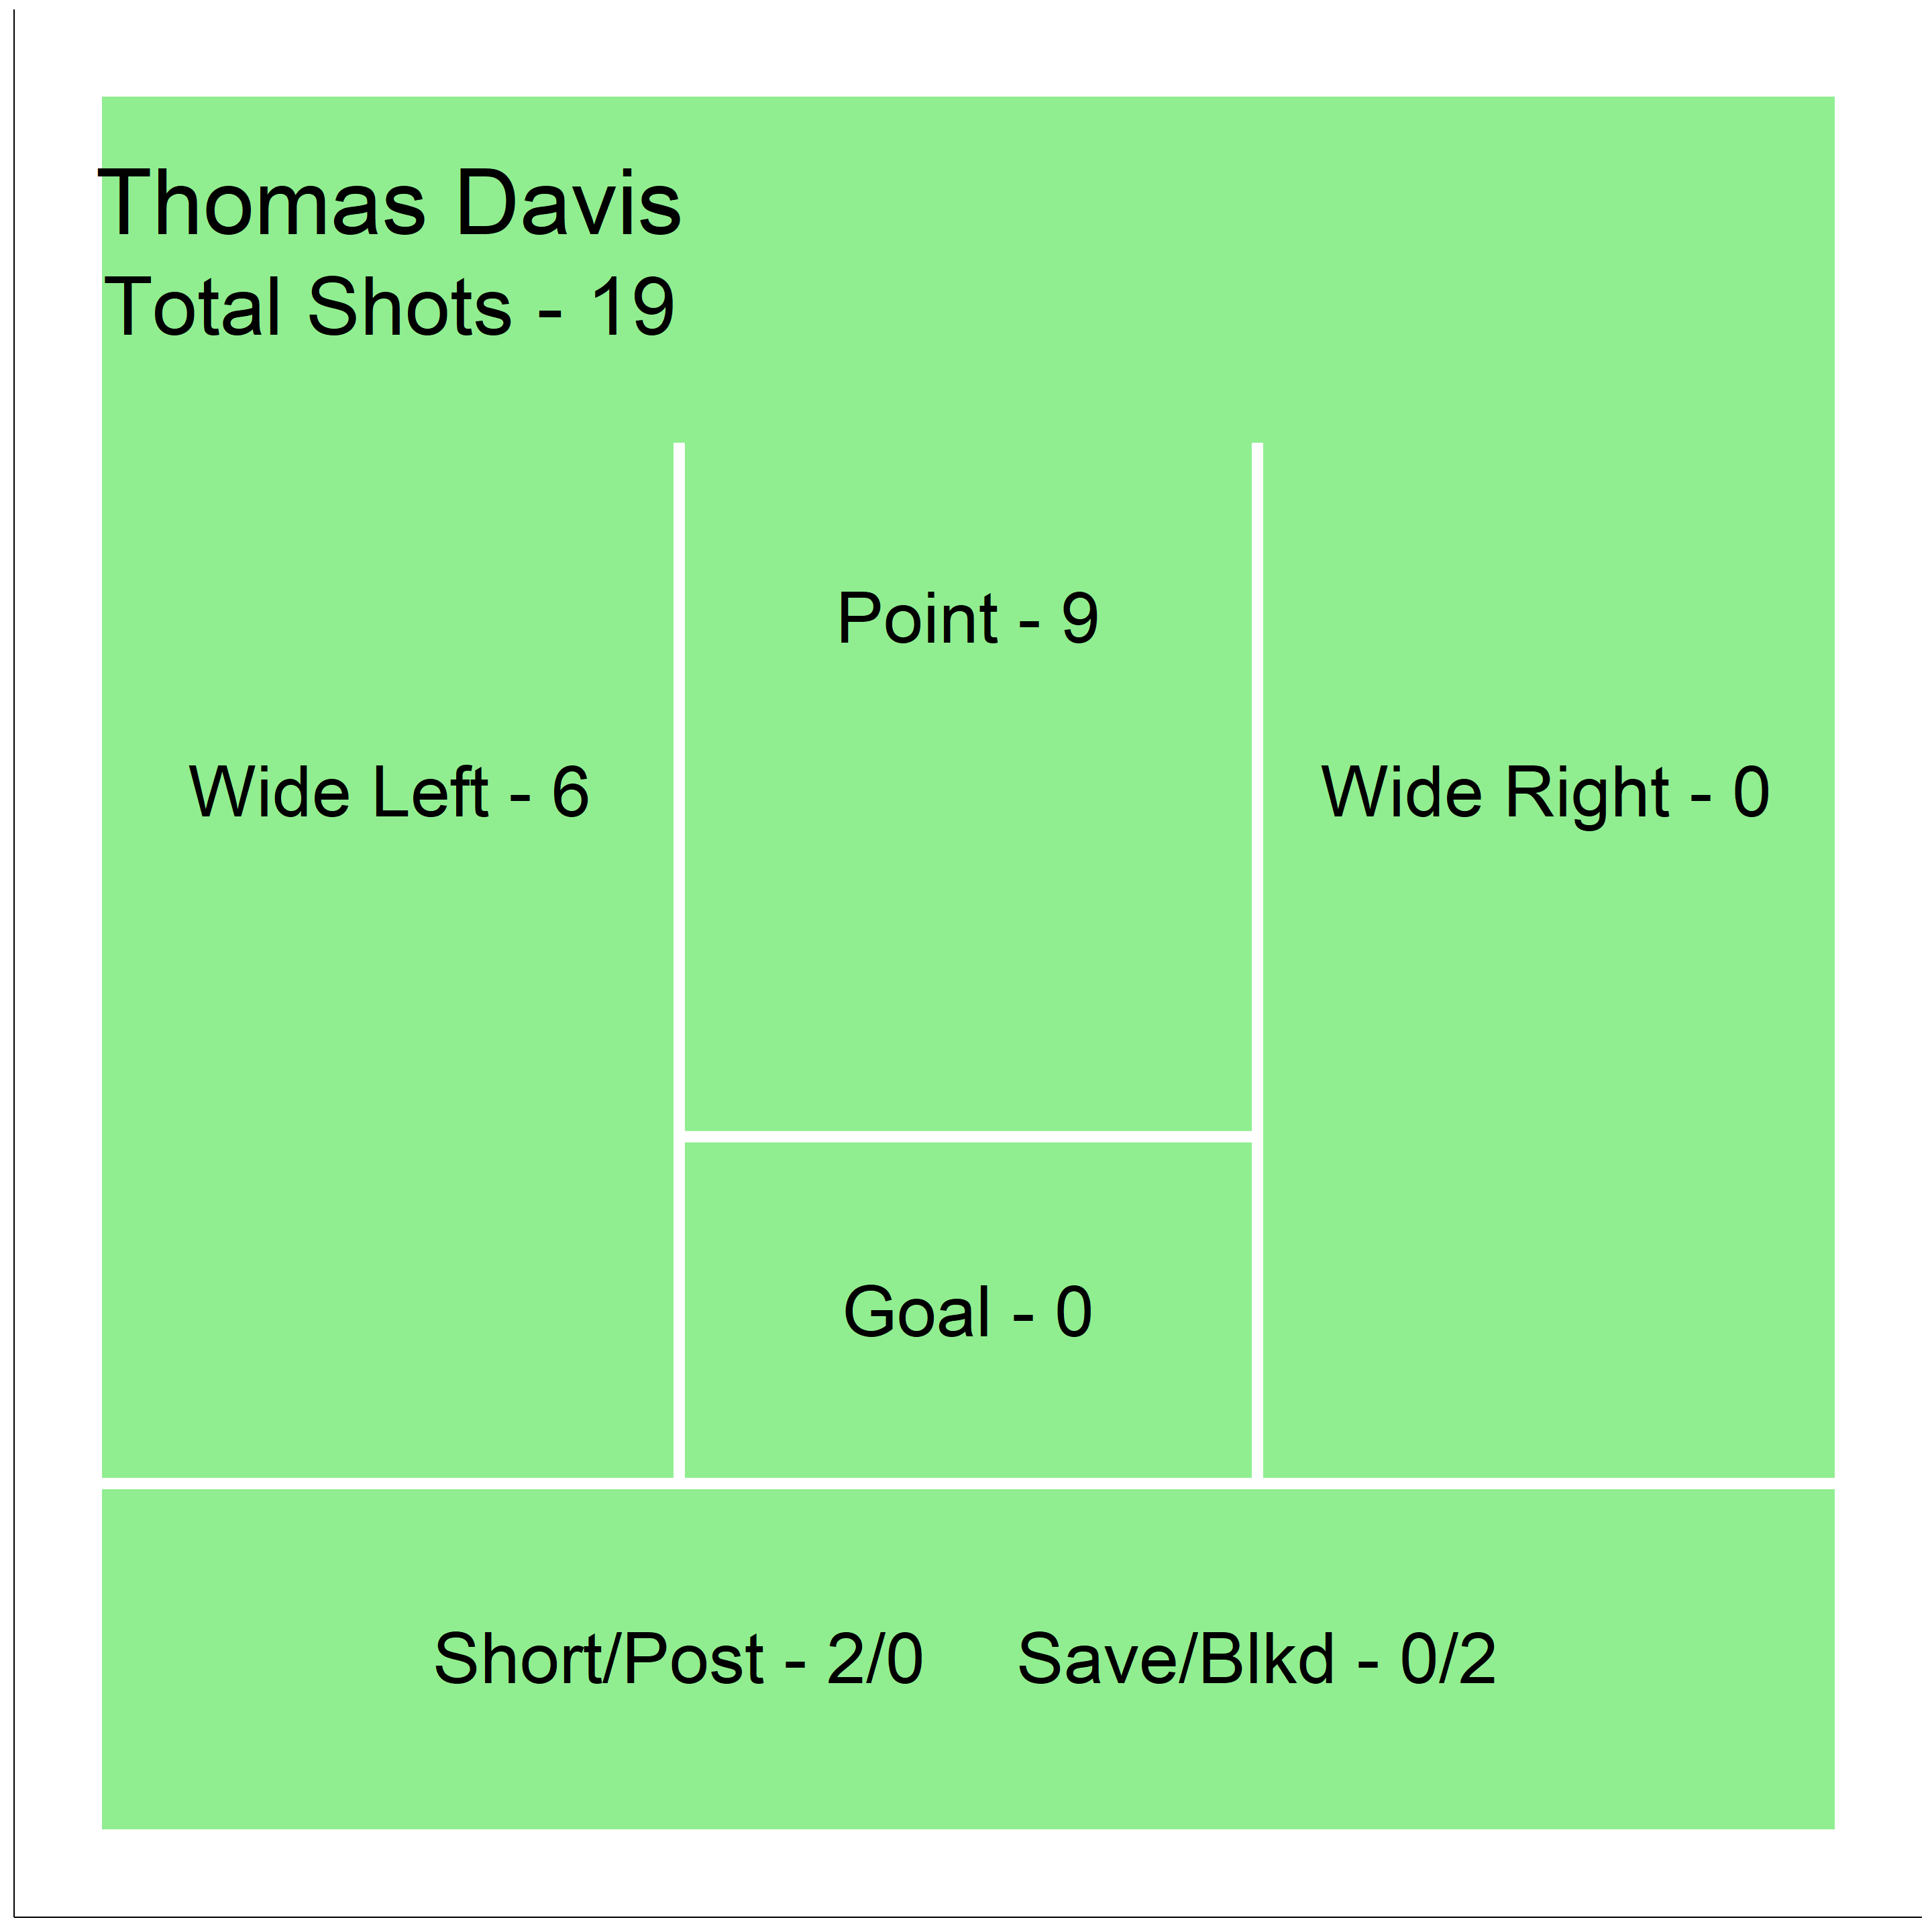
##Areas of Play by Possession ###Thomas Davis 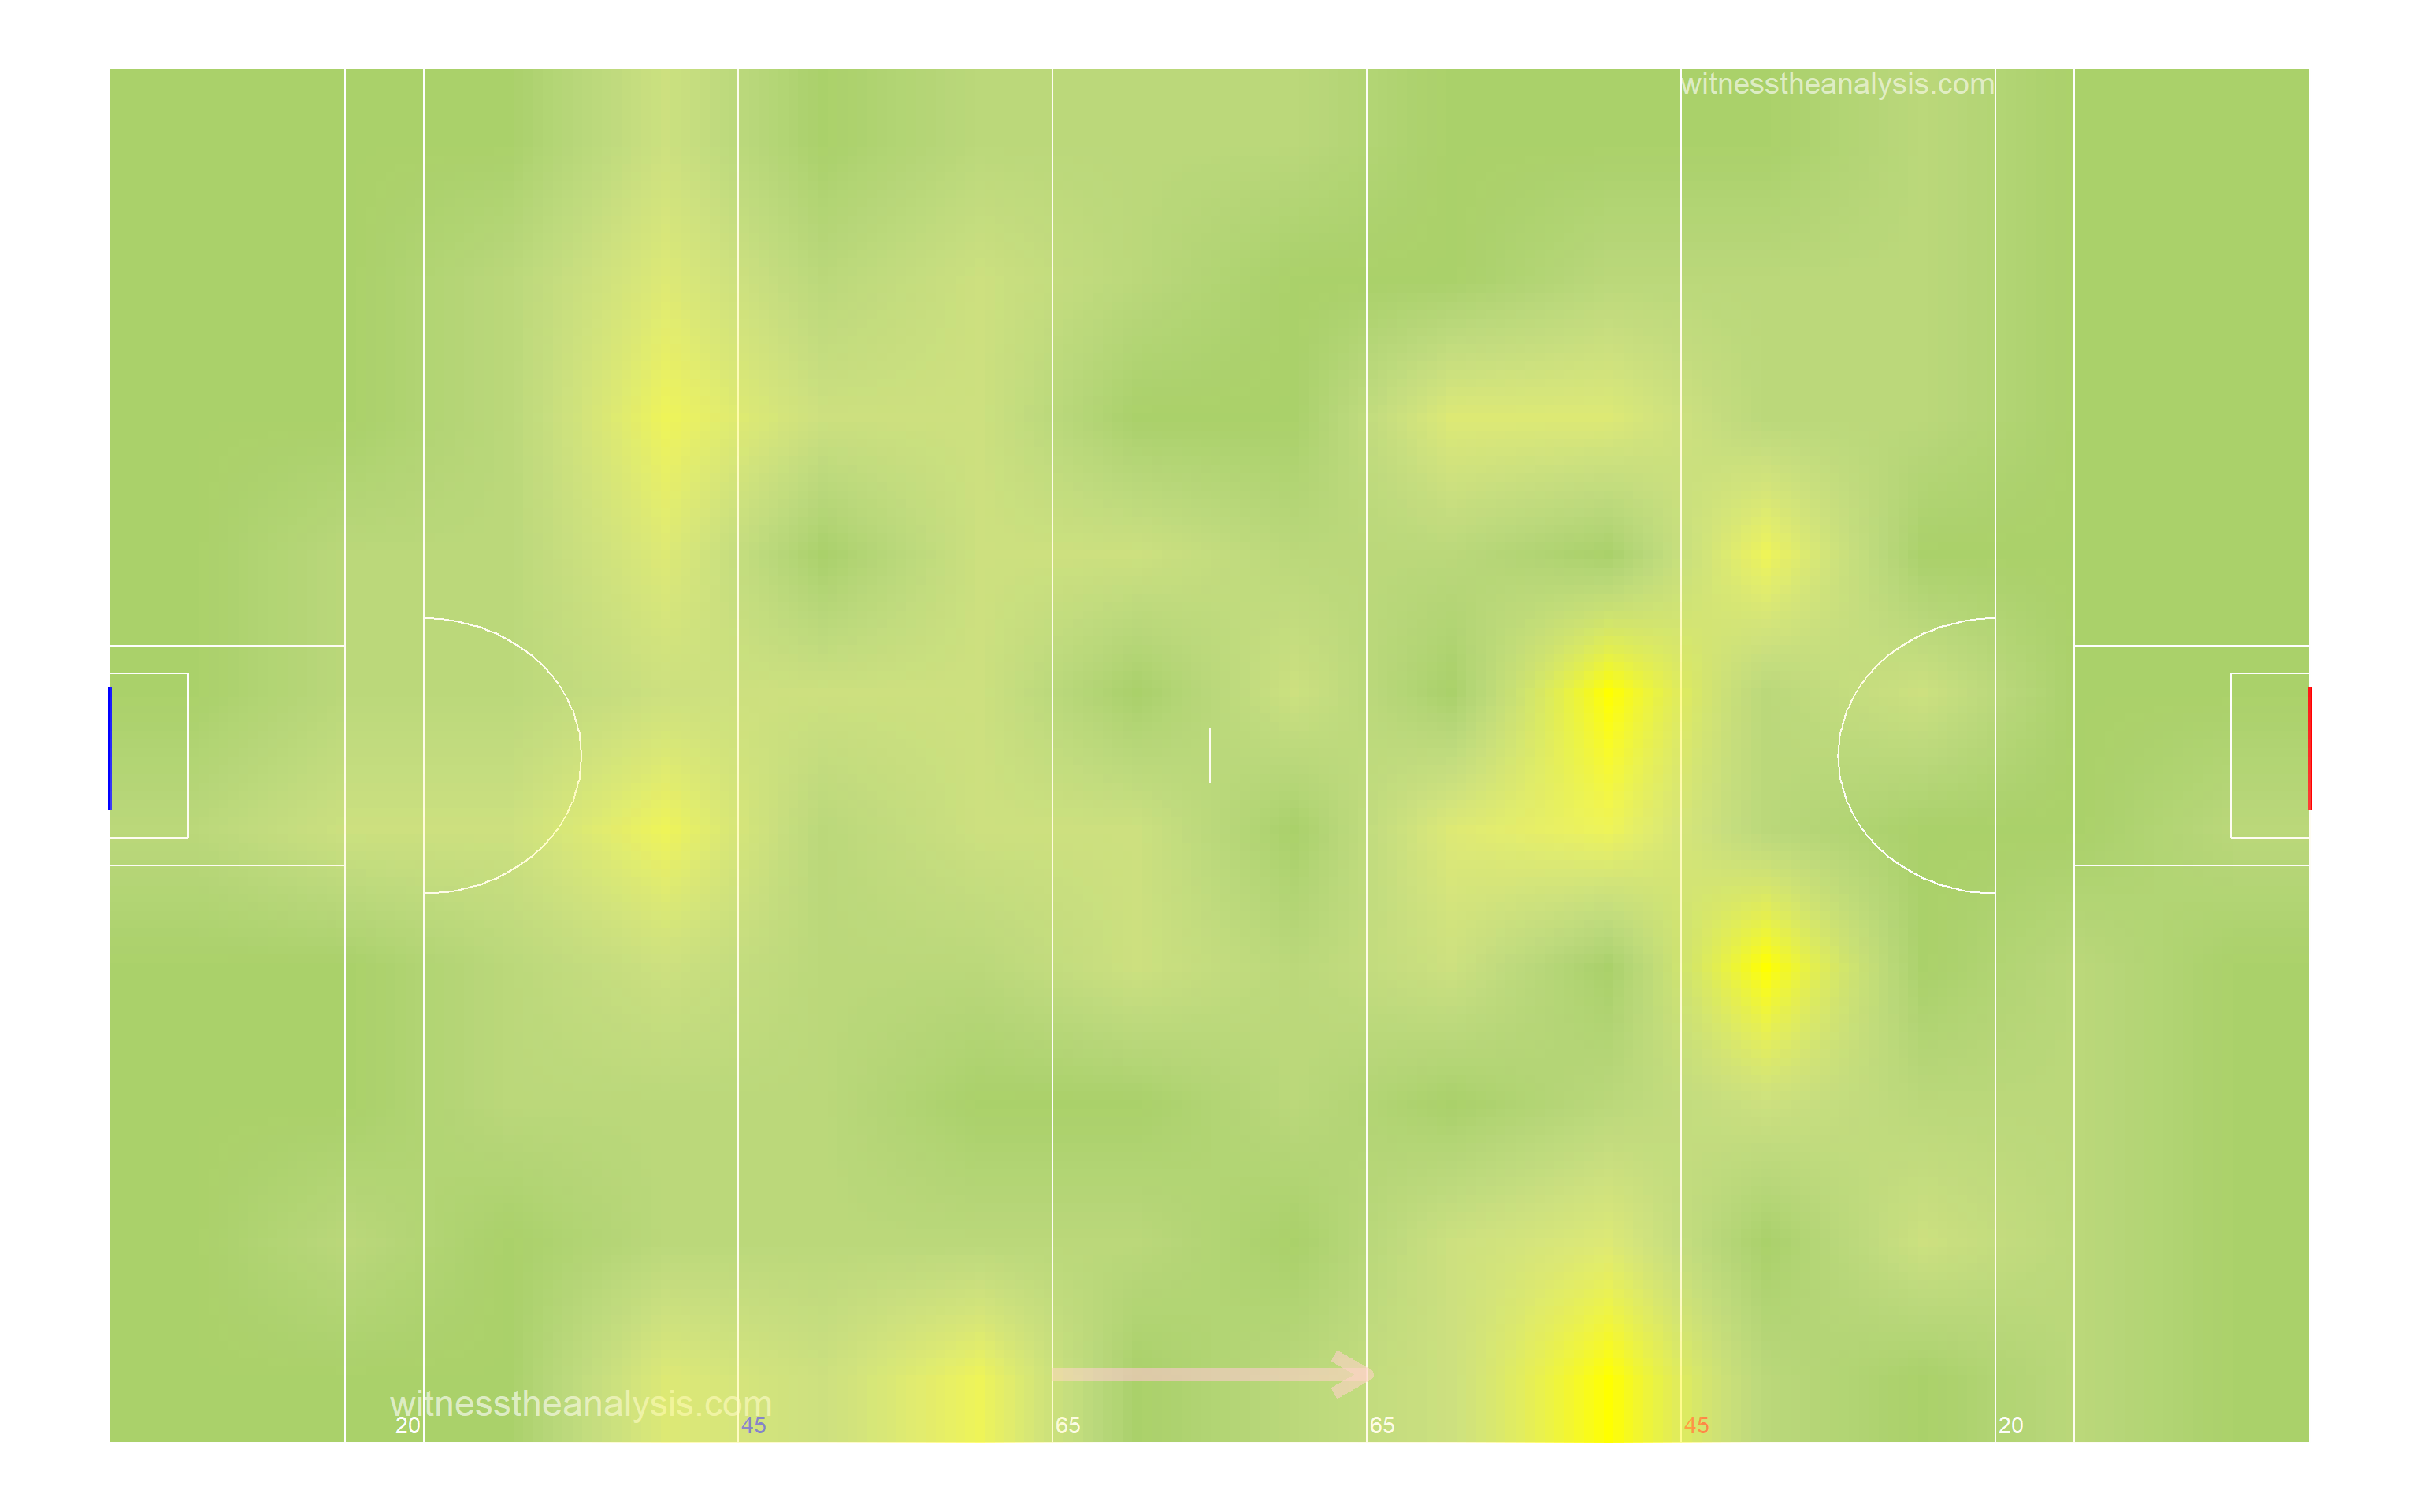
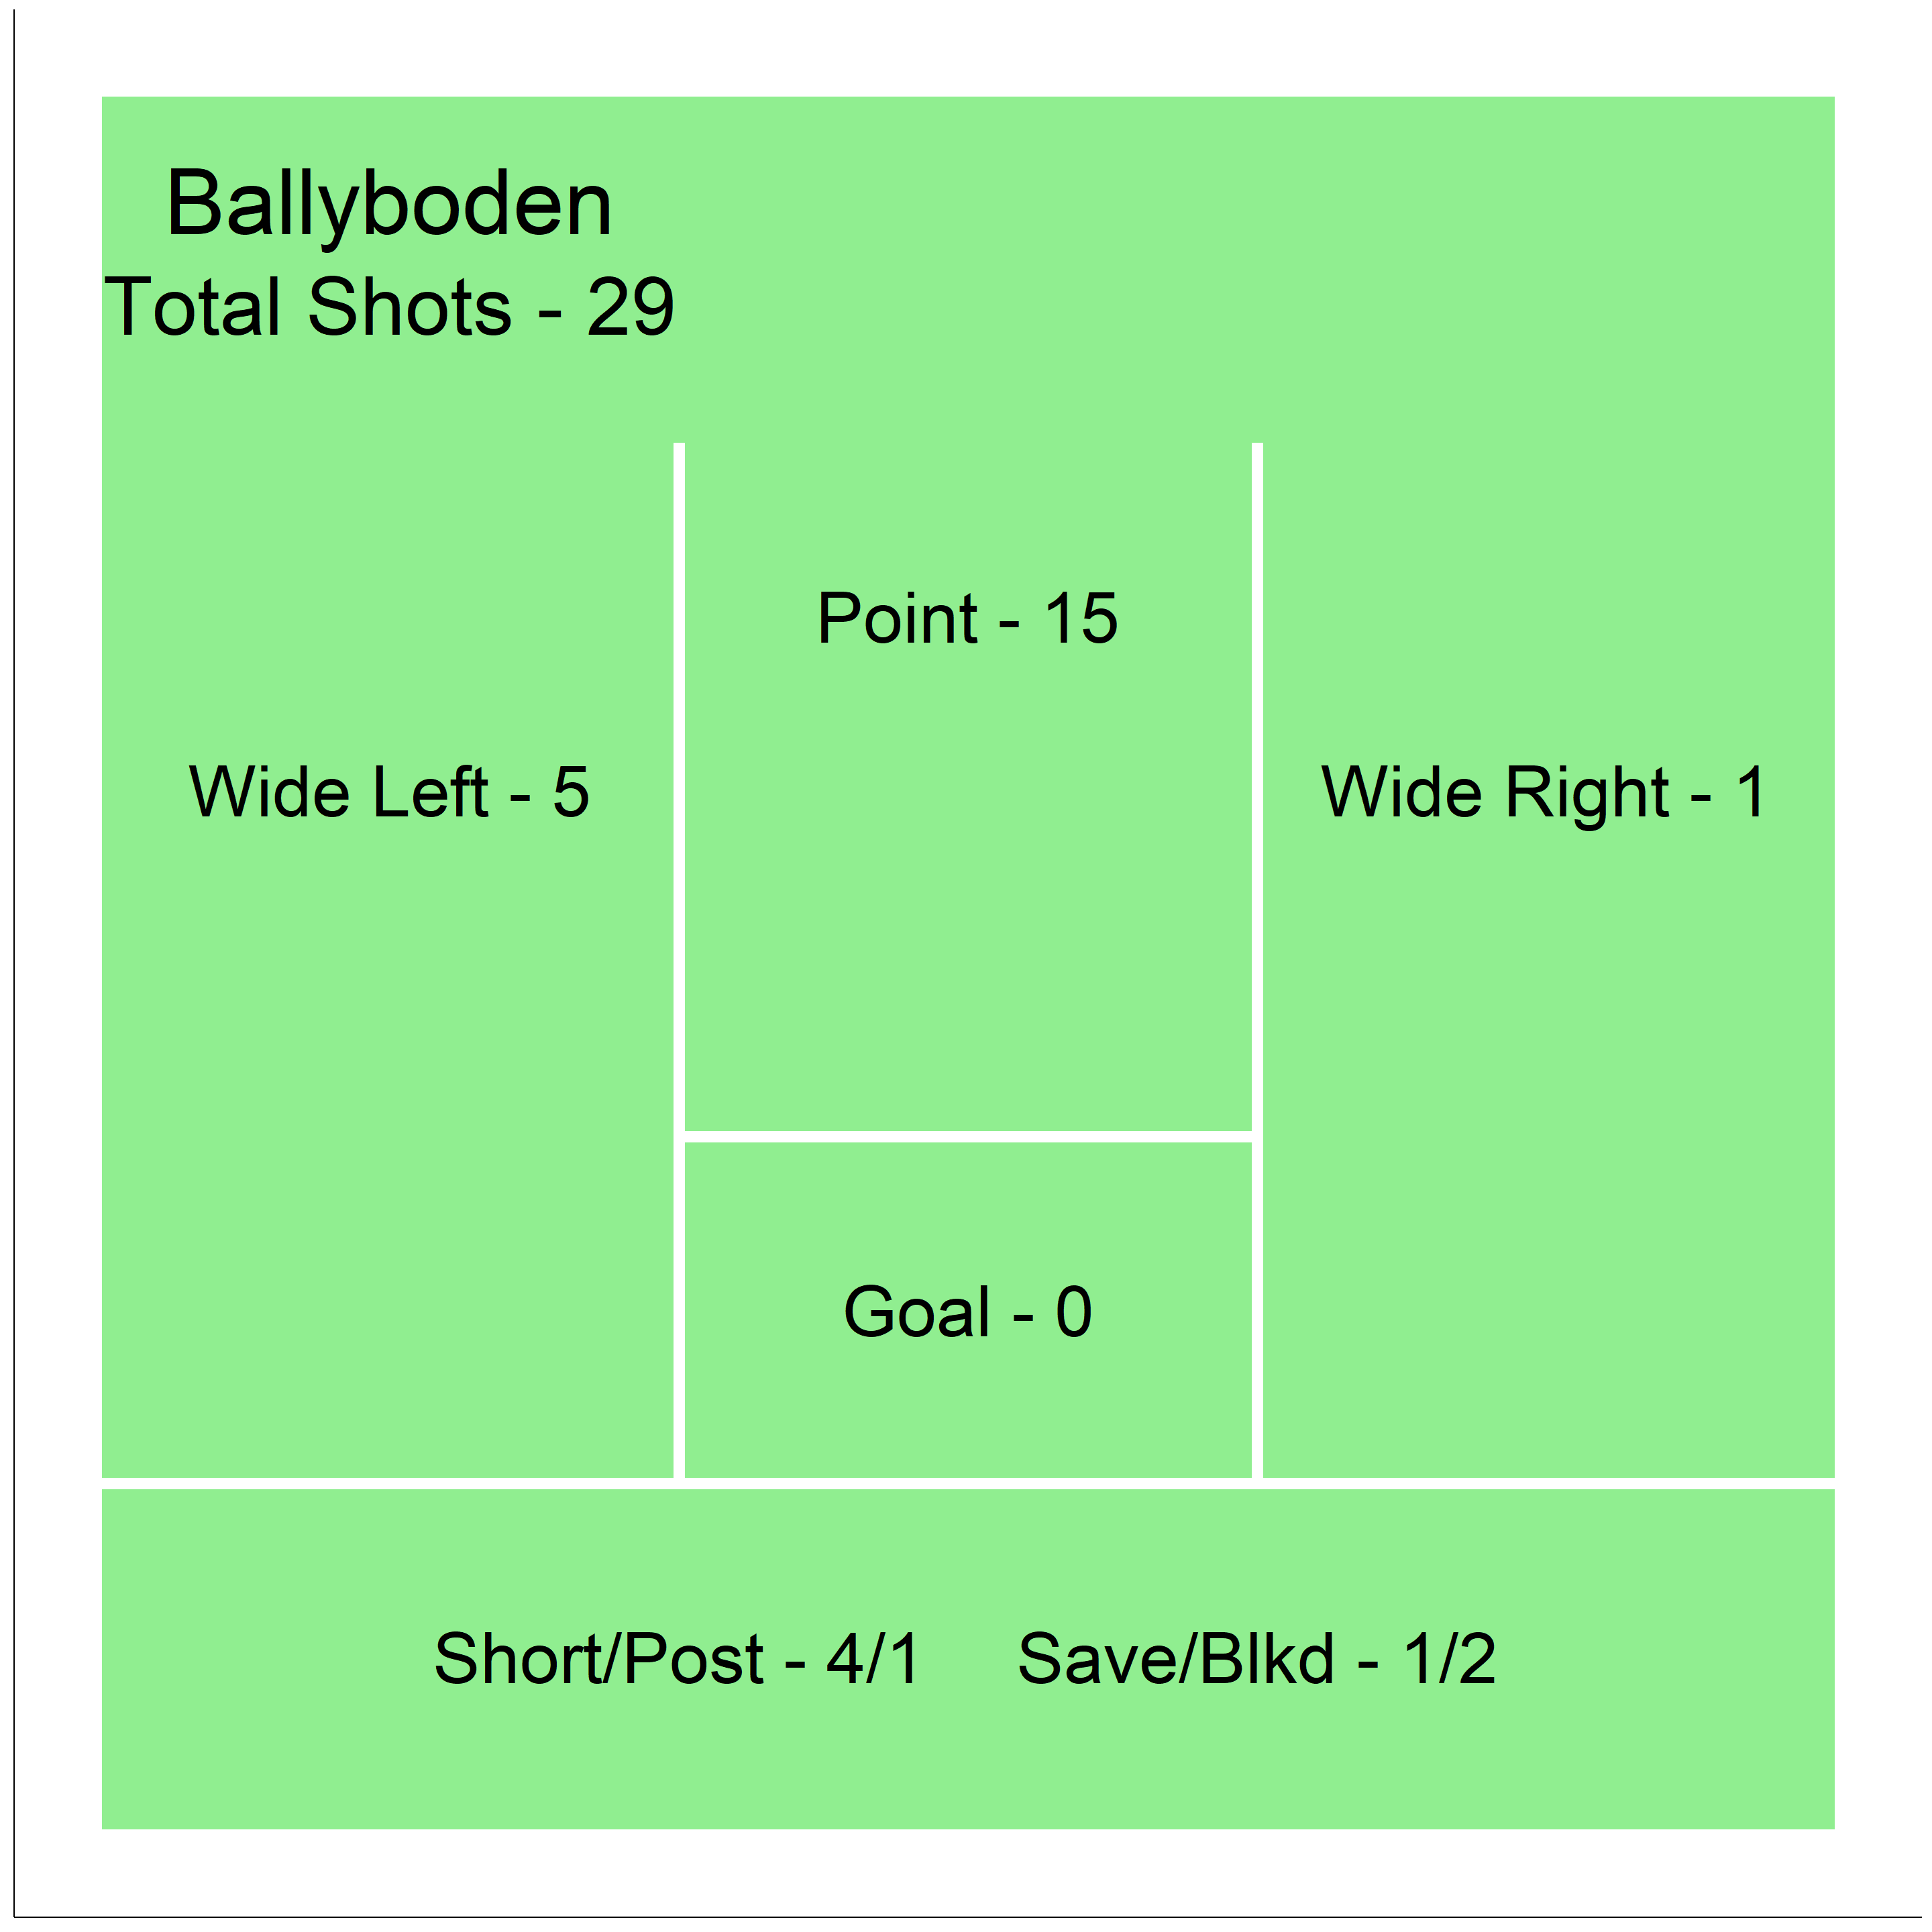
###Ballyboden 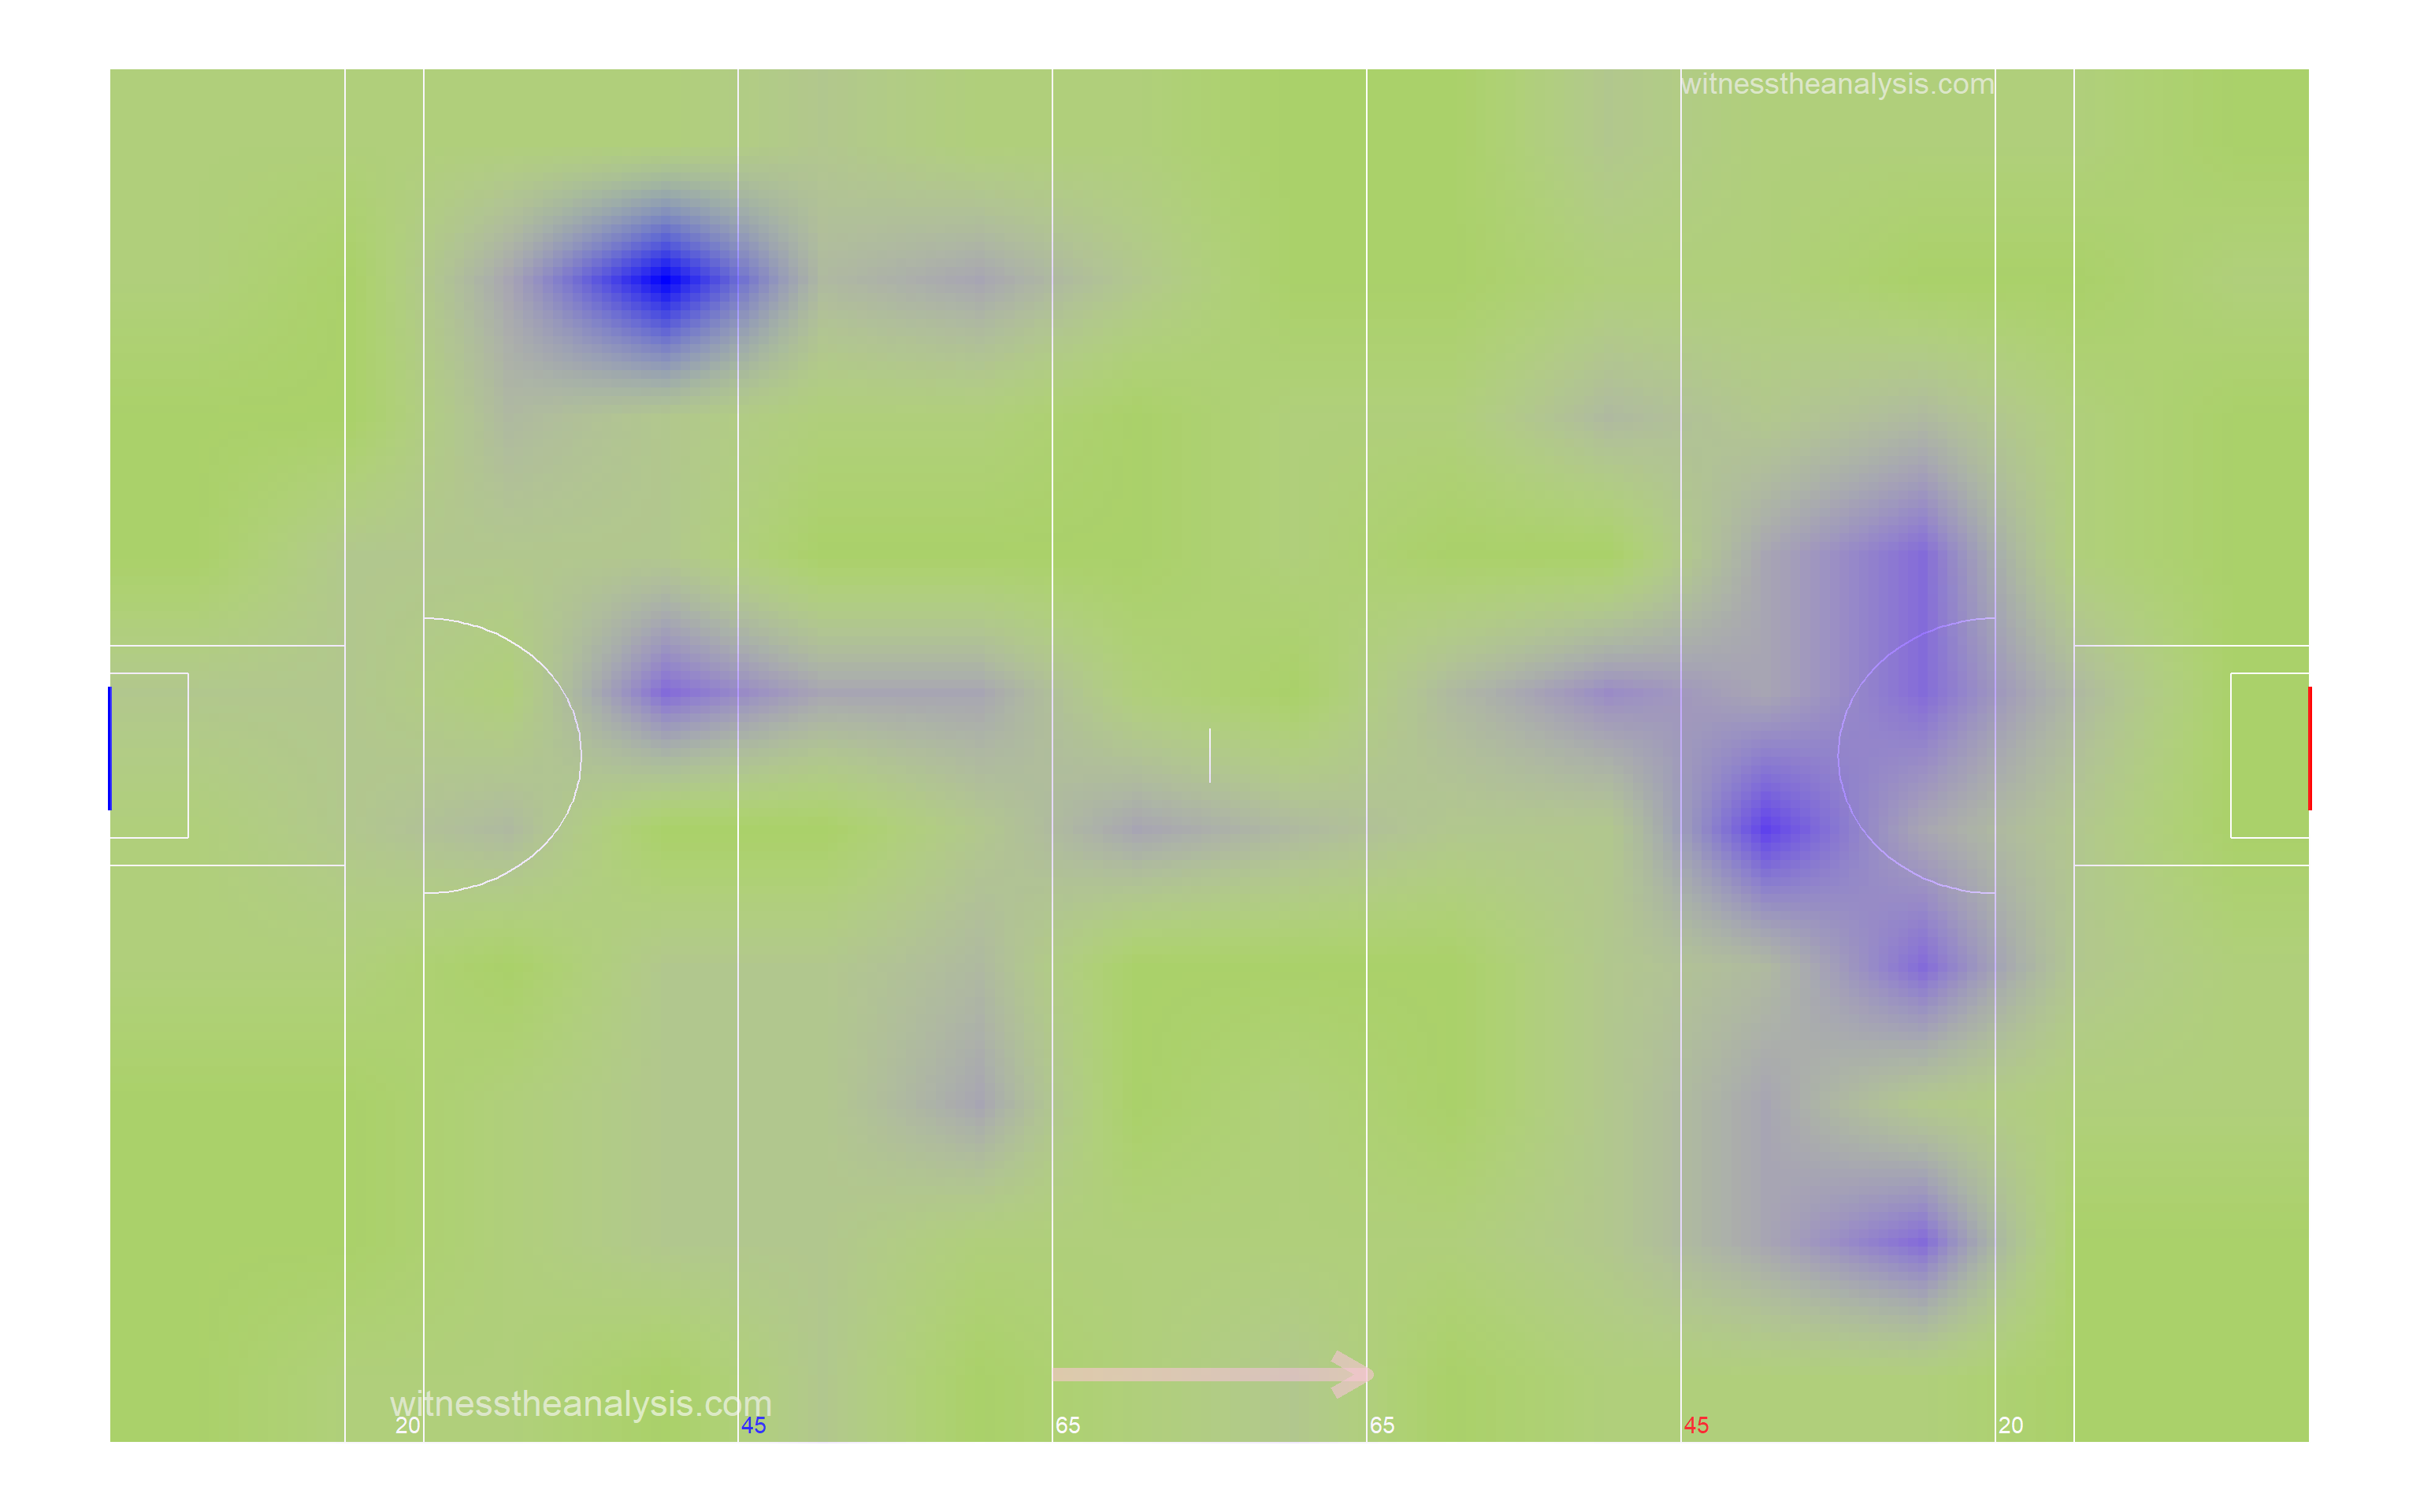
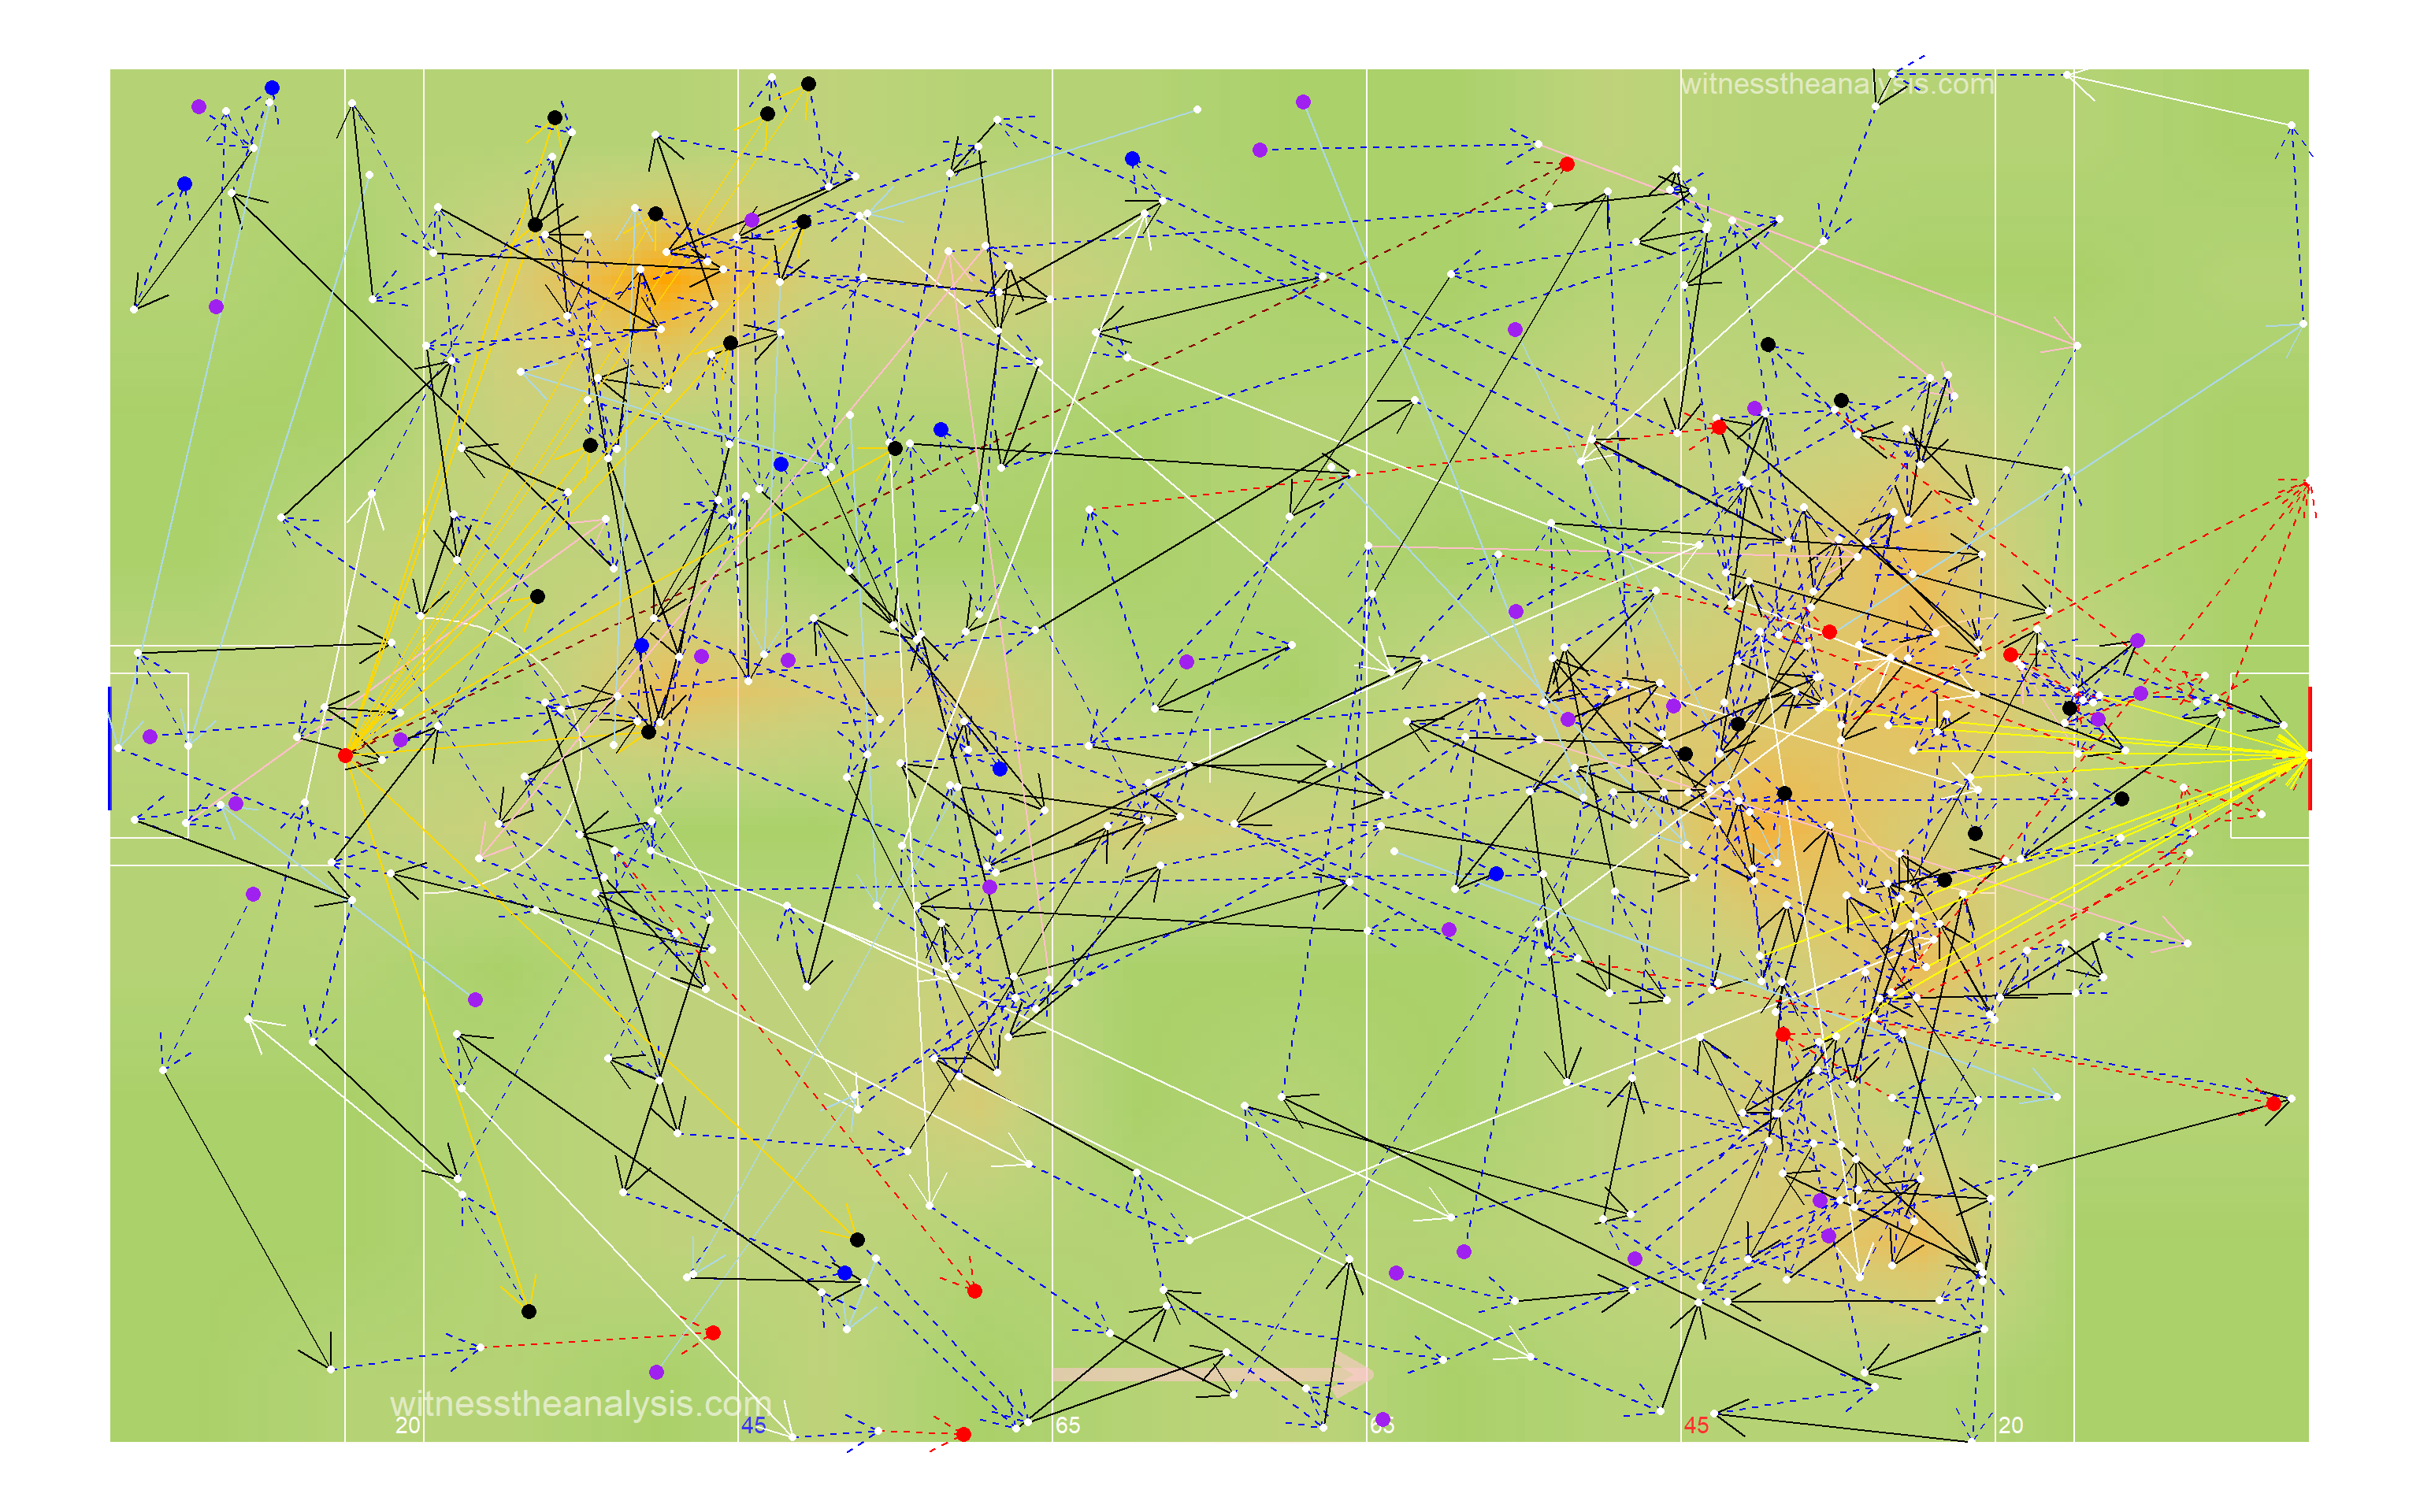
##Denisty Map (All Actions) ###Thomas Davis 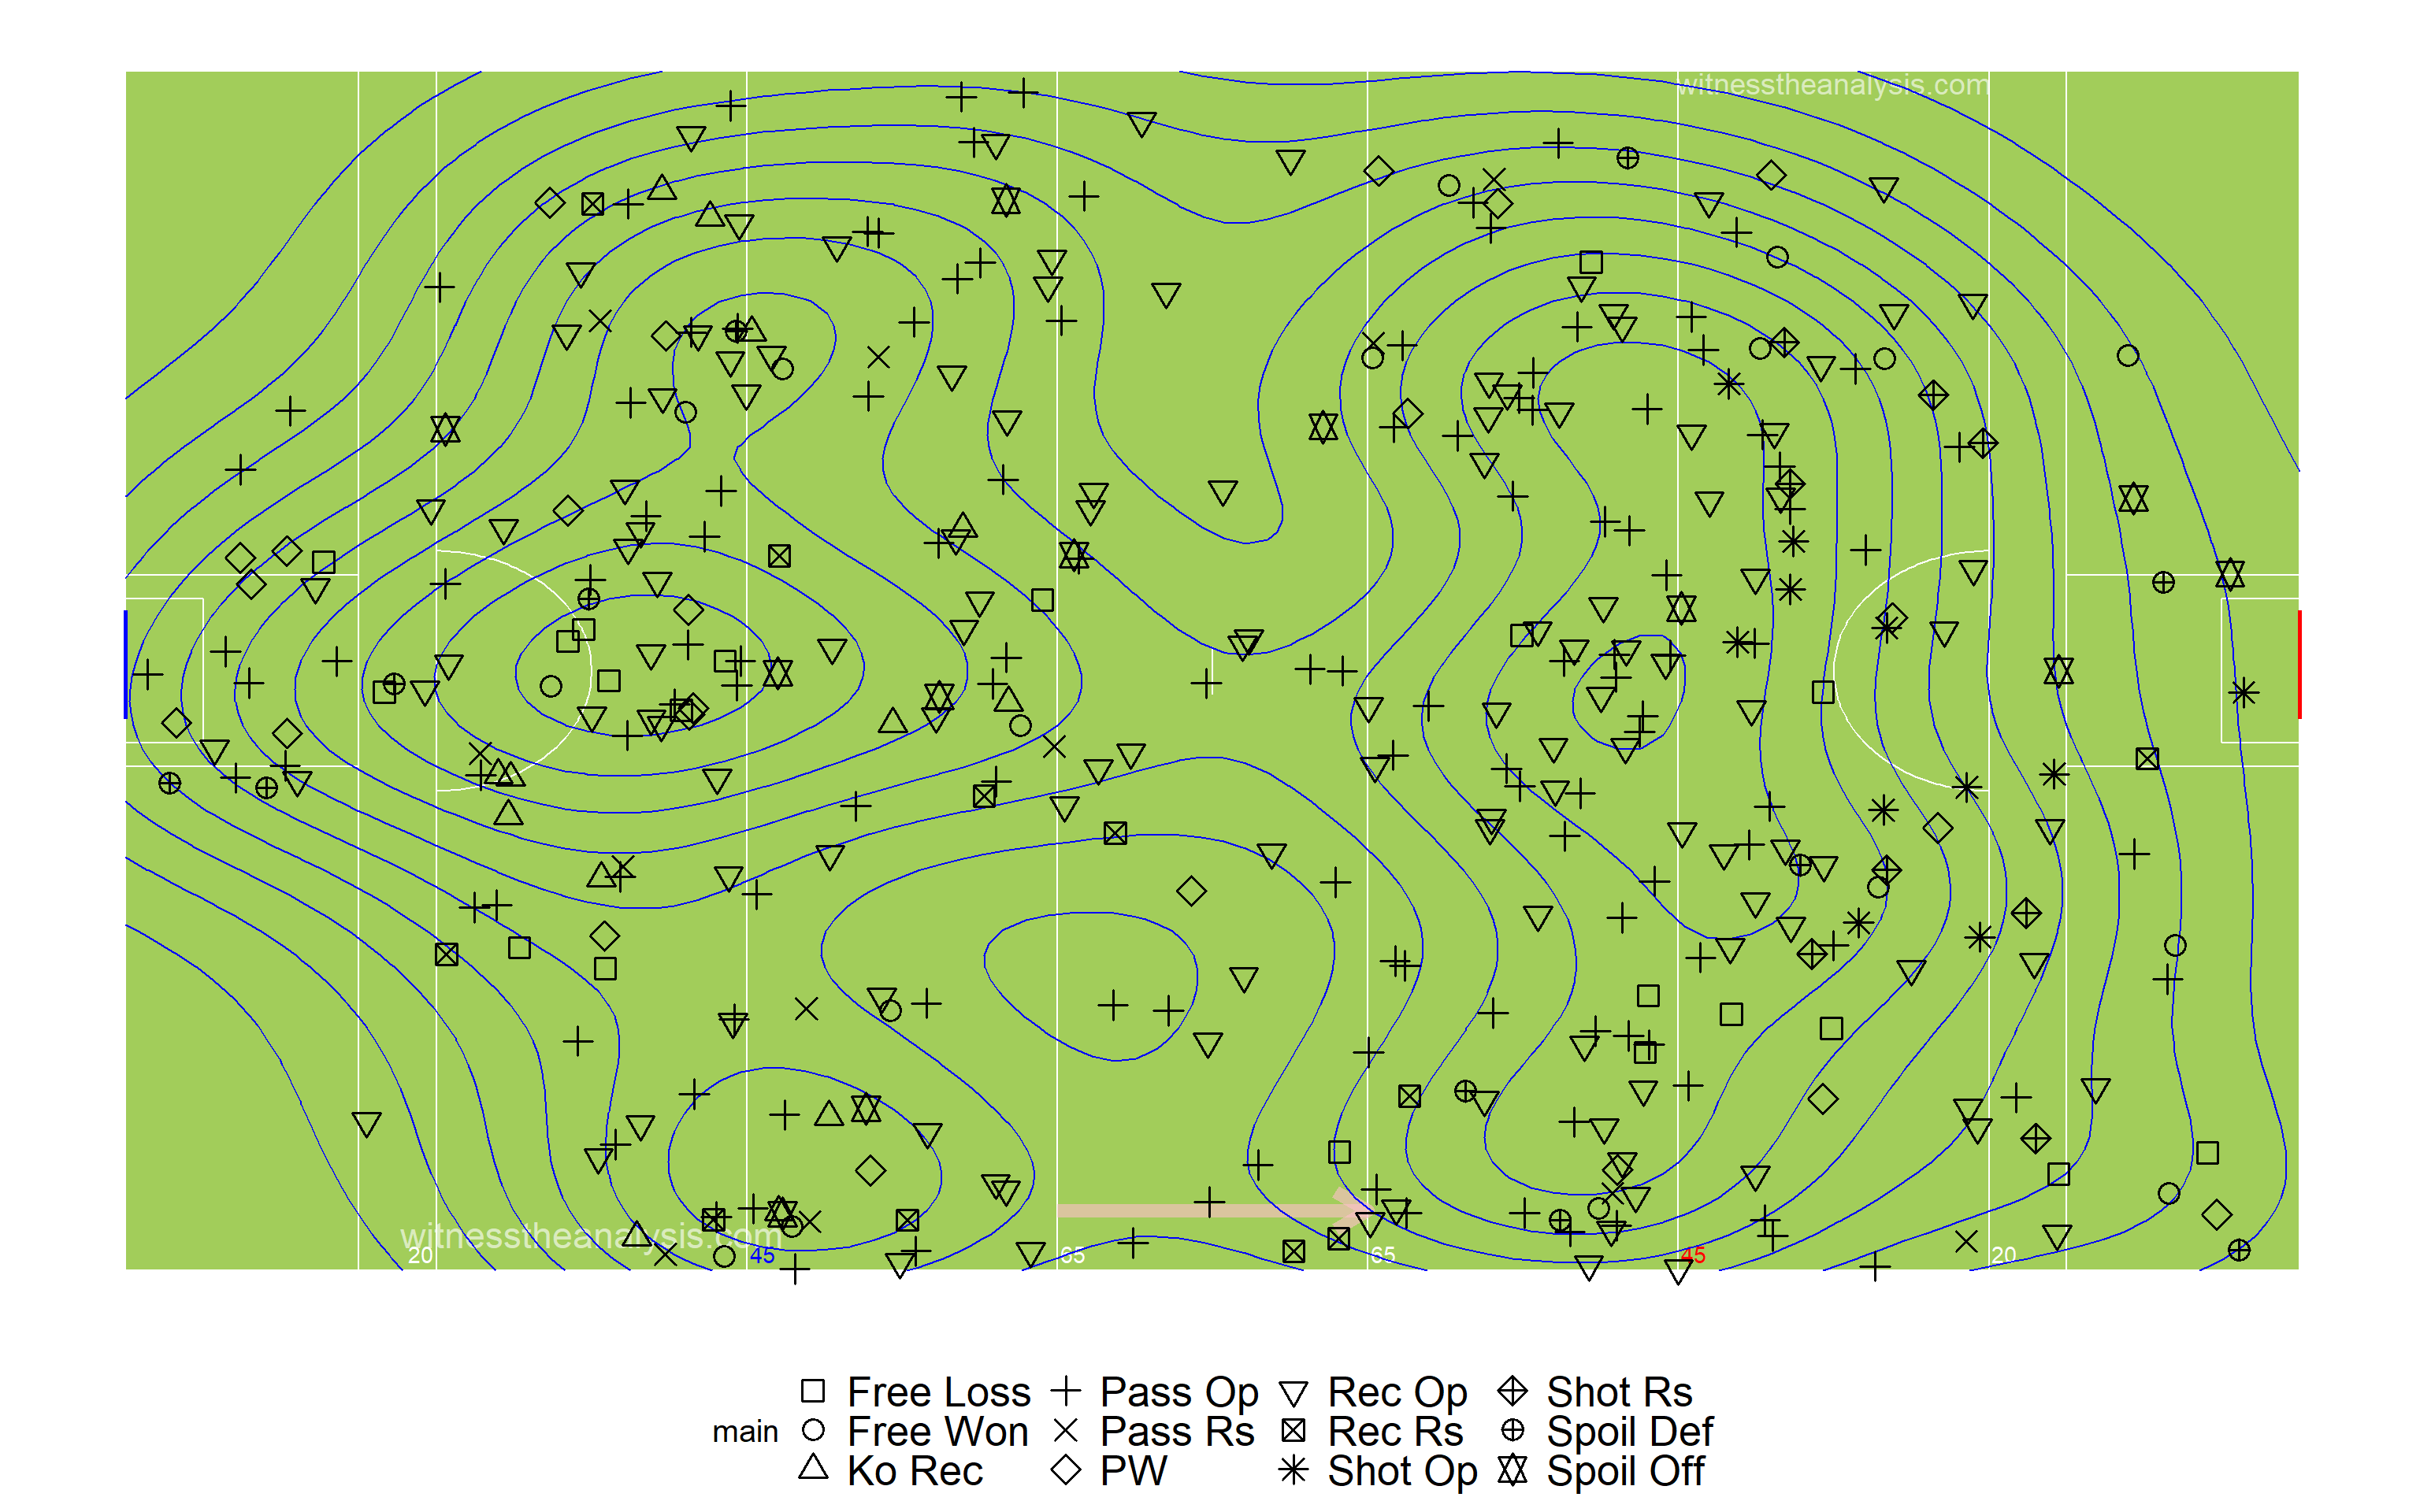
###Ballyboden 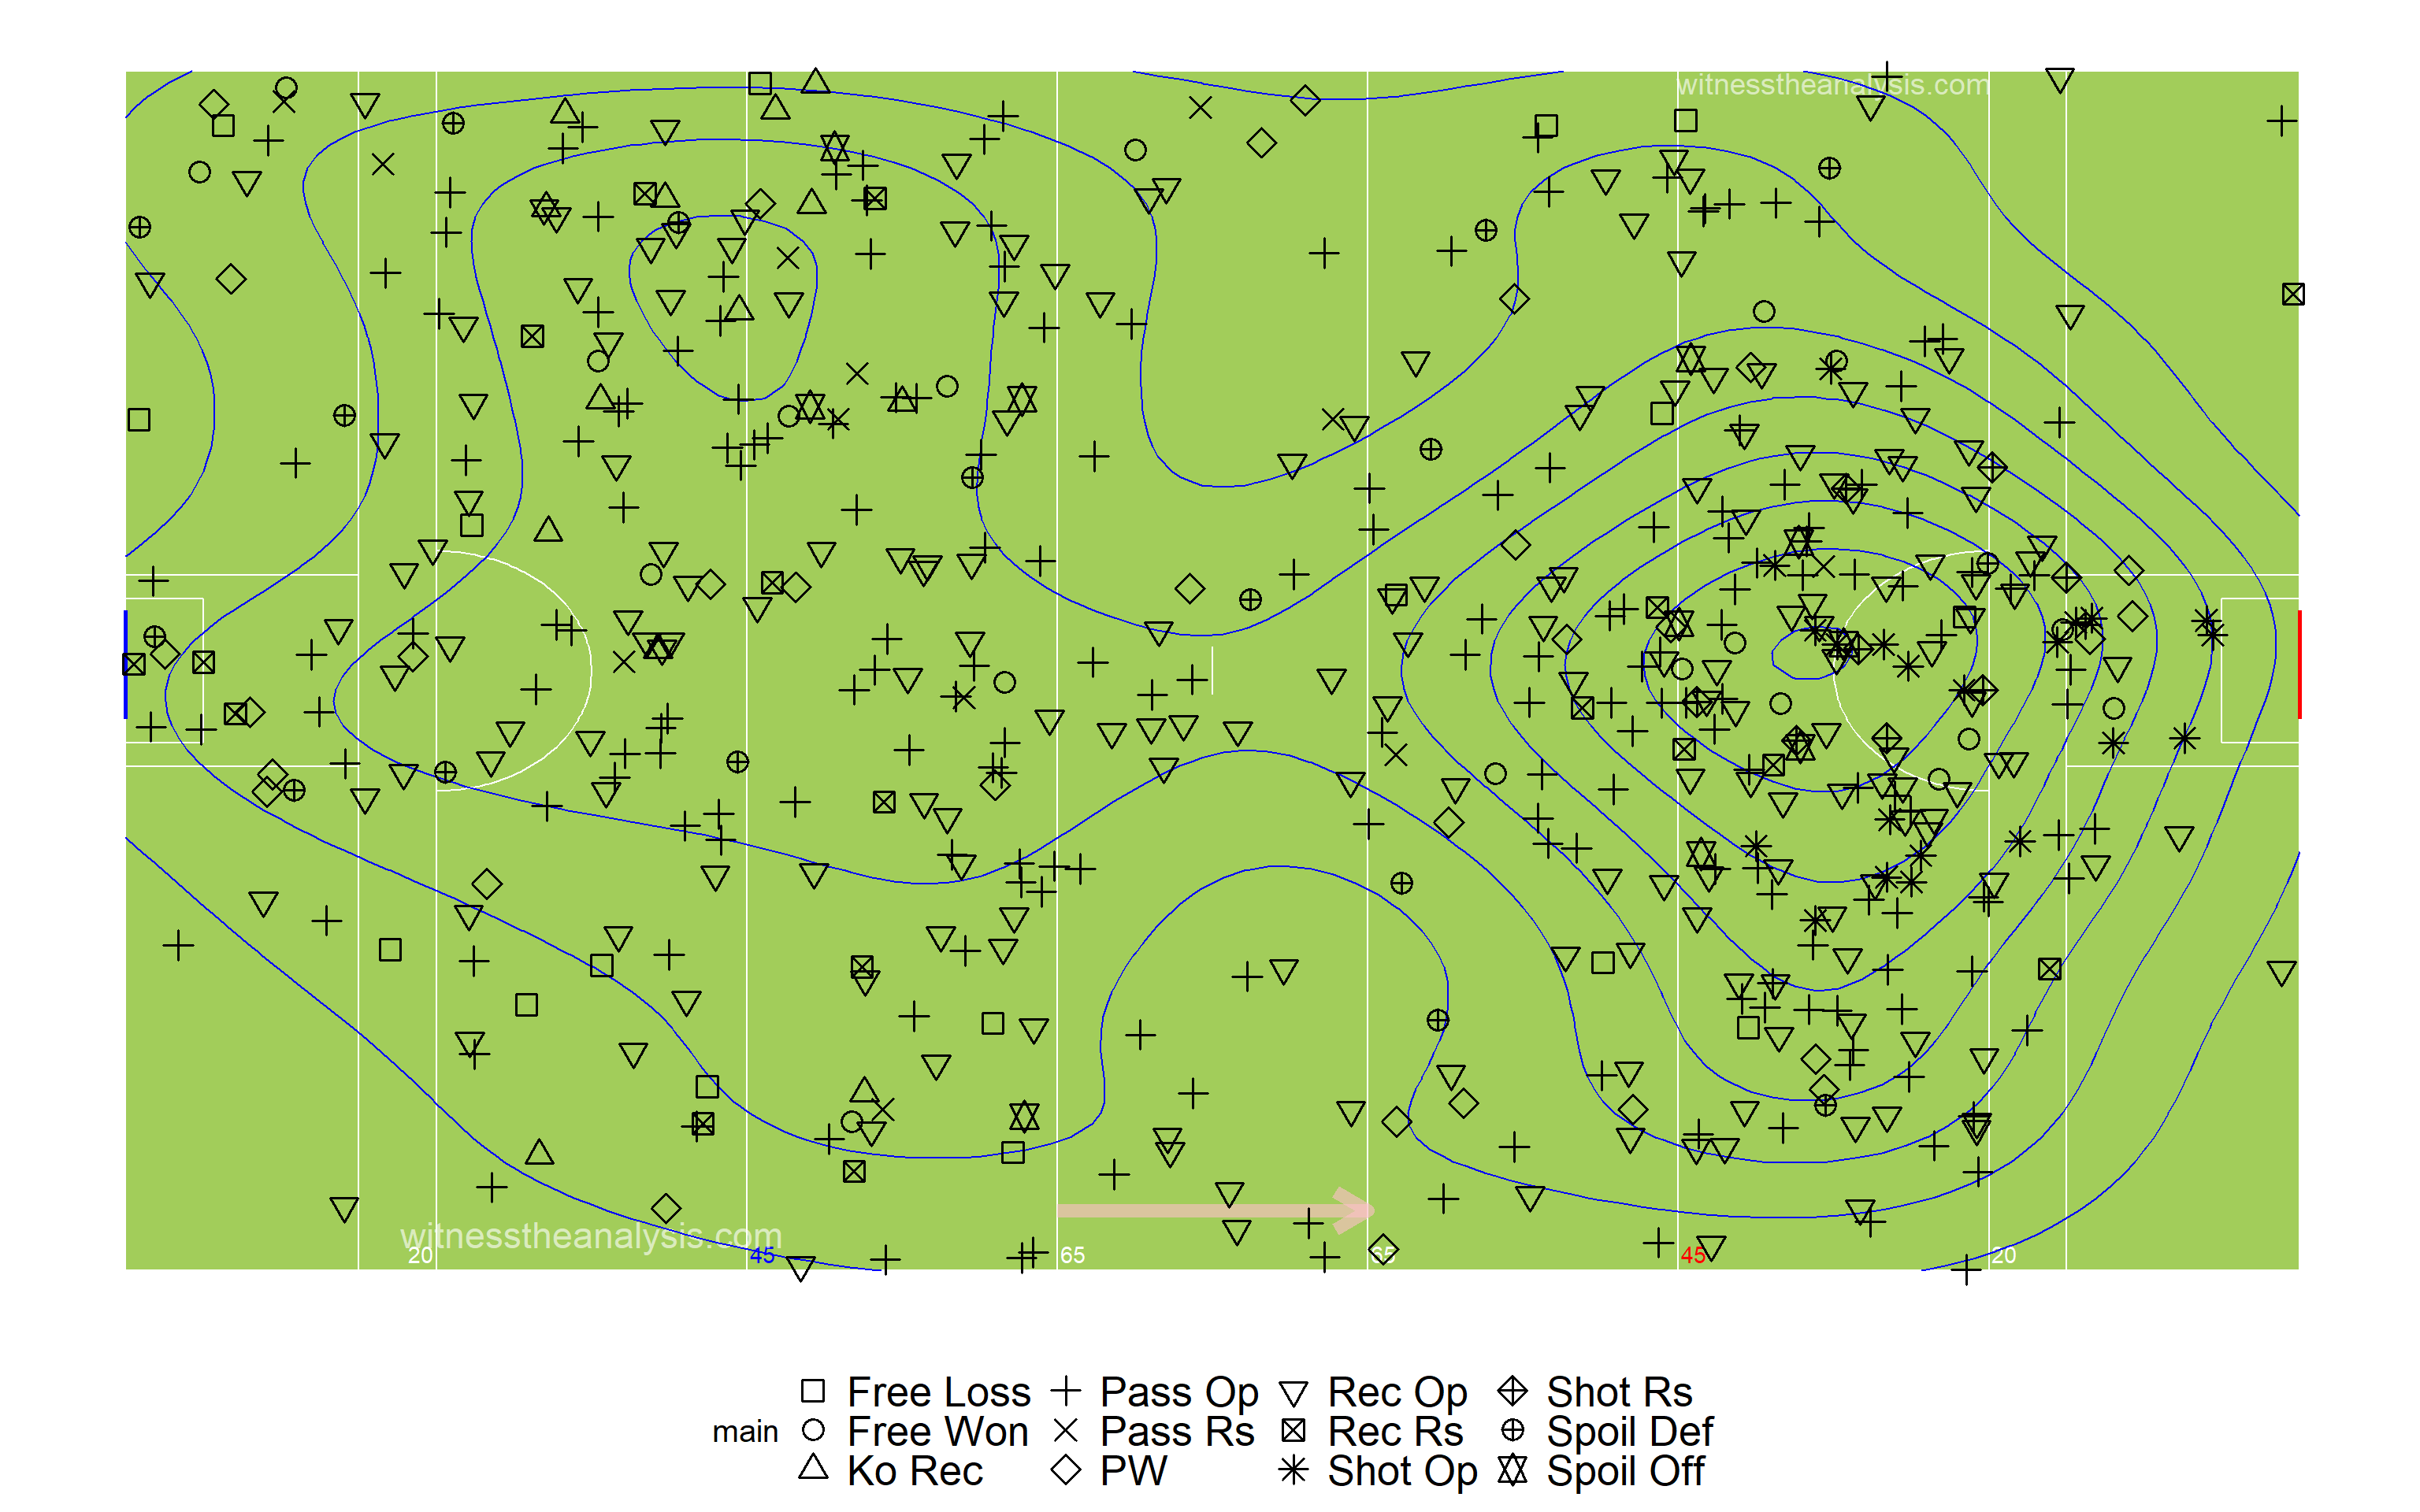
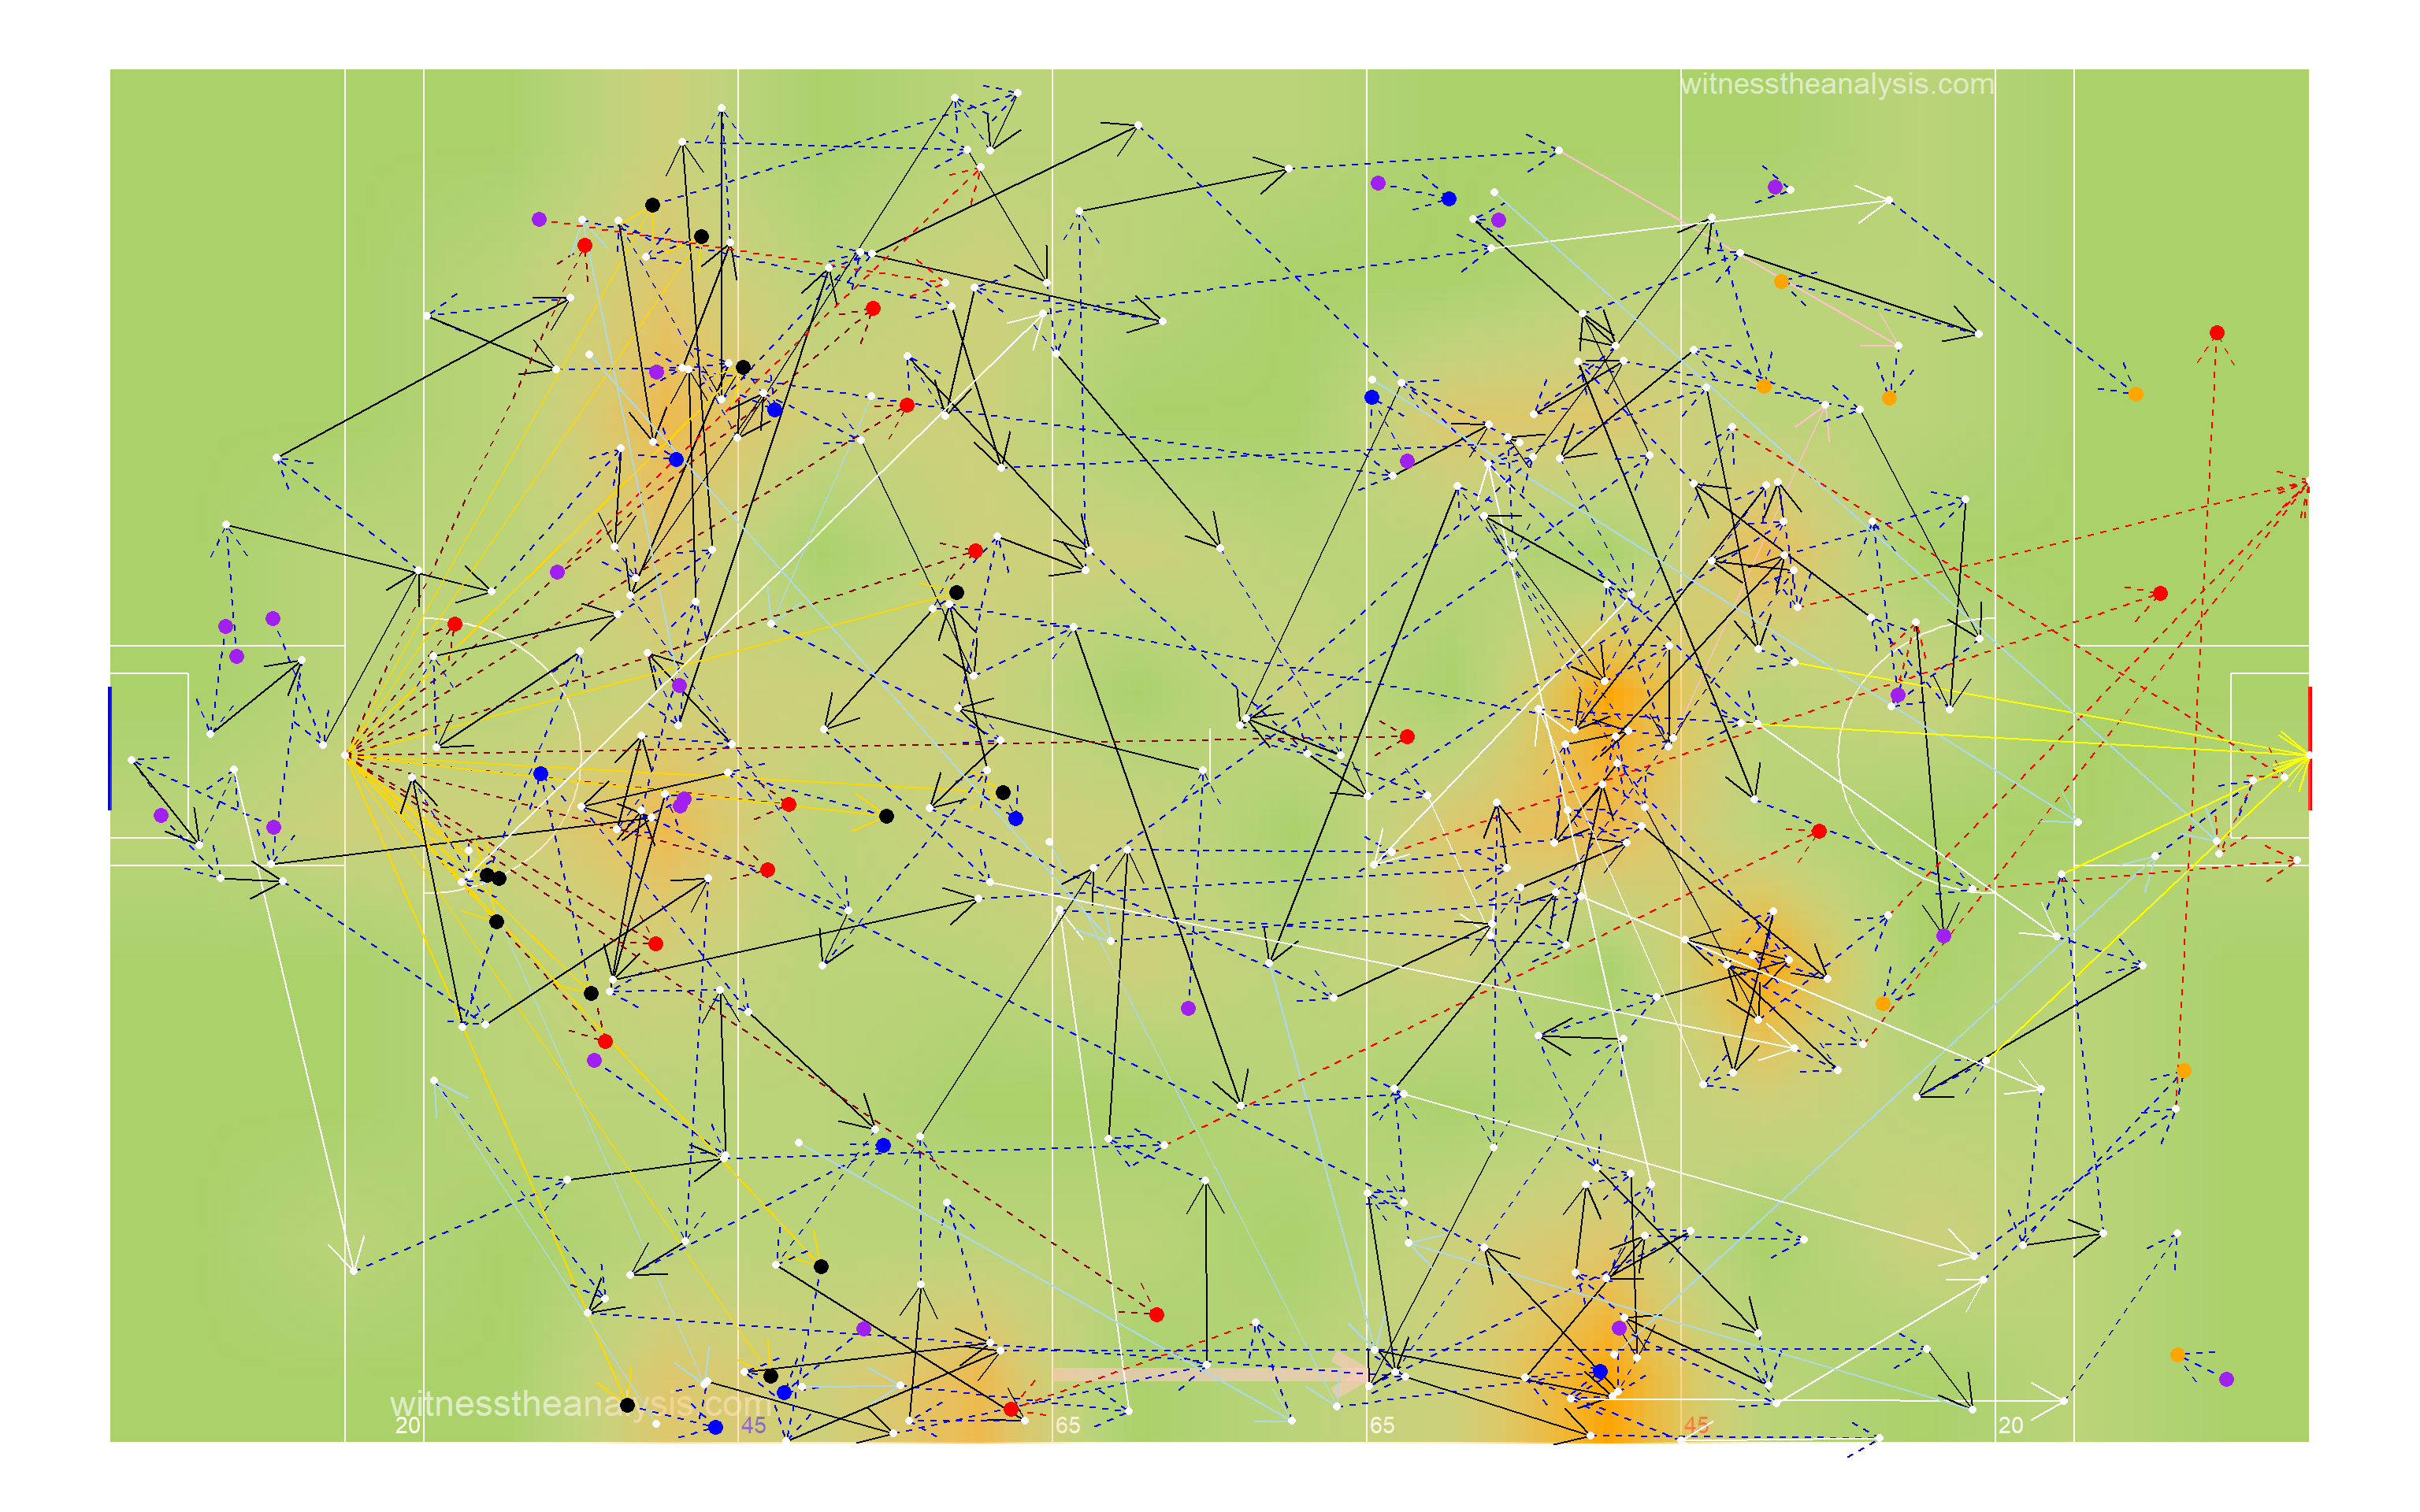
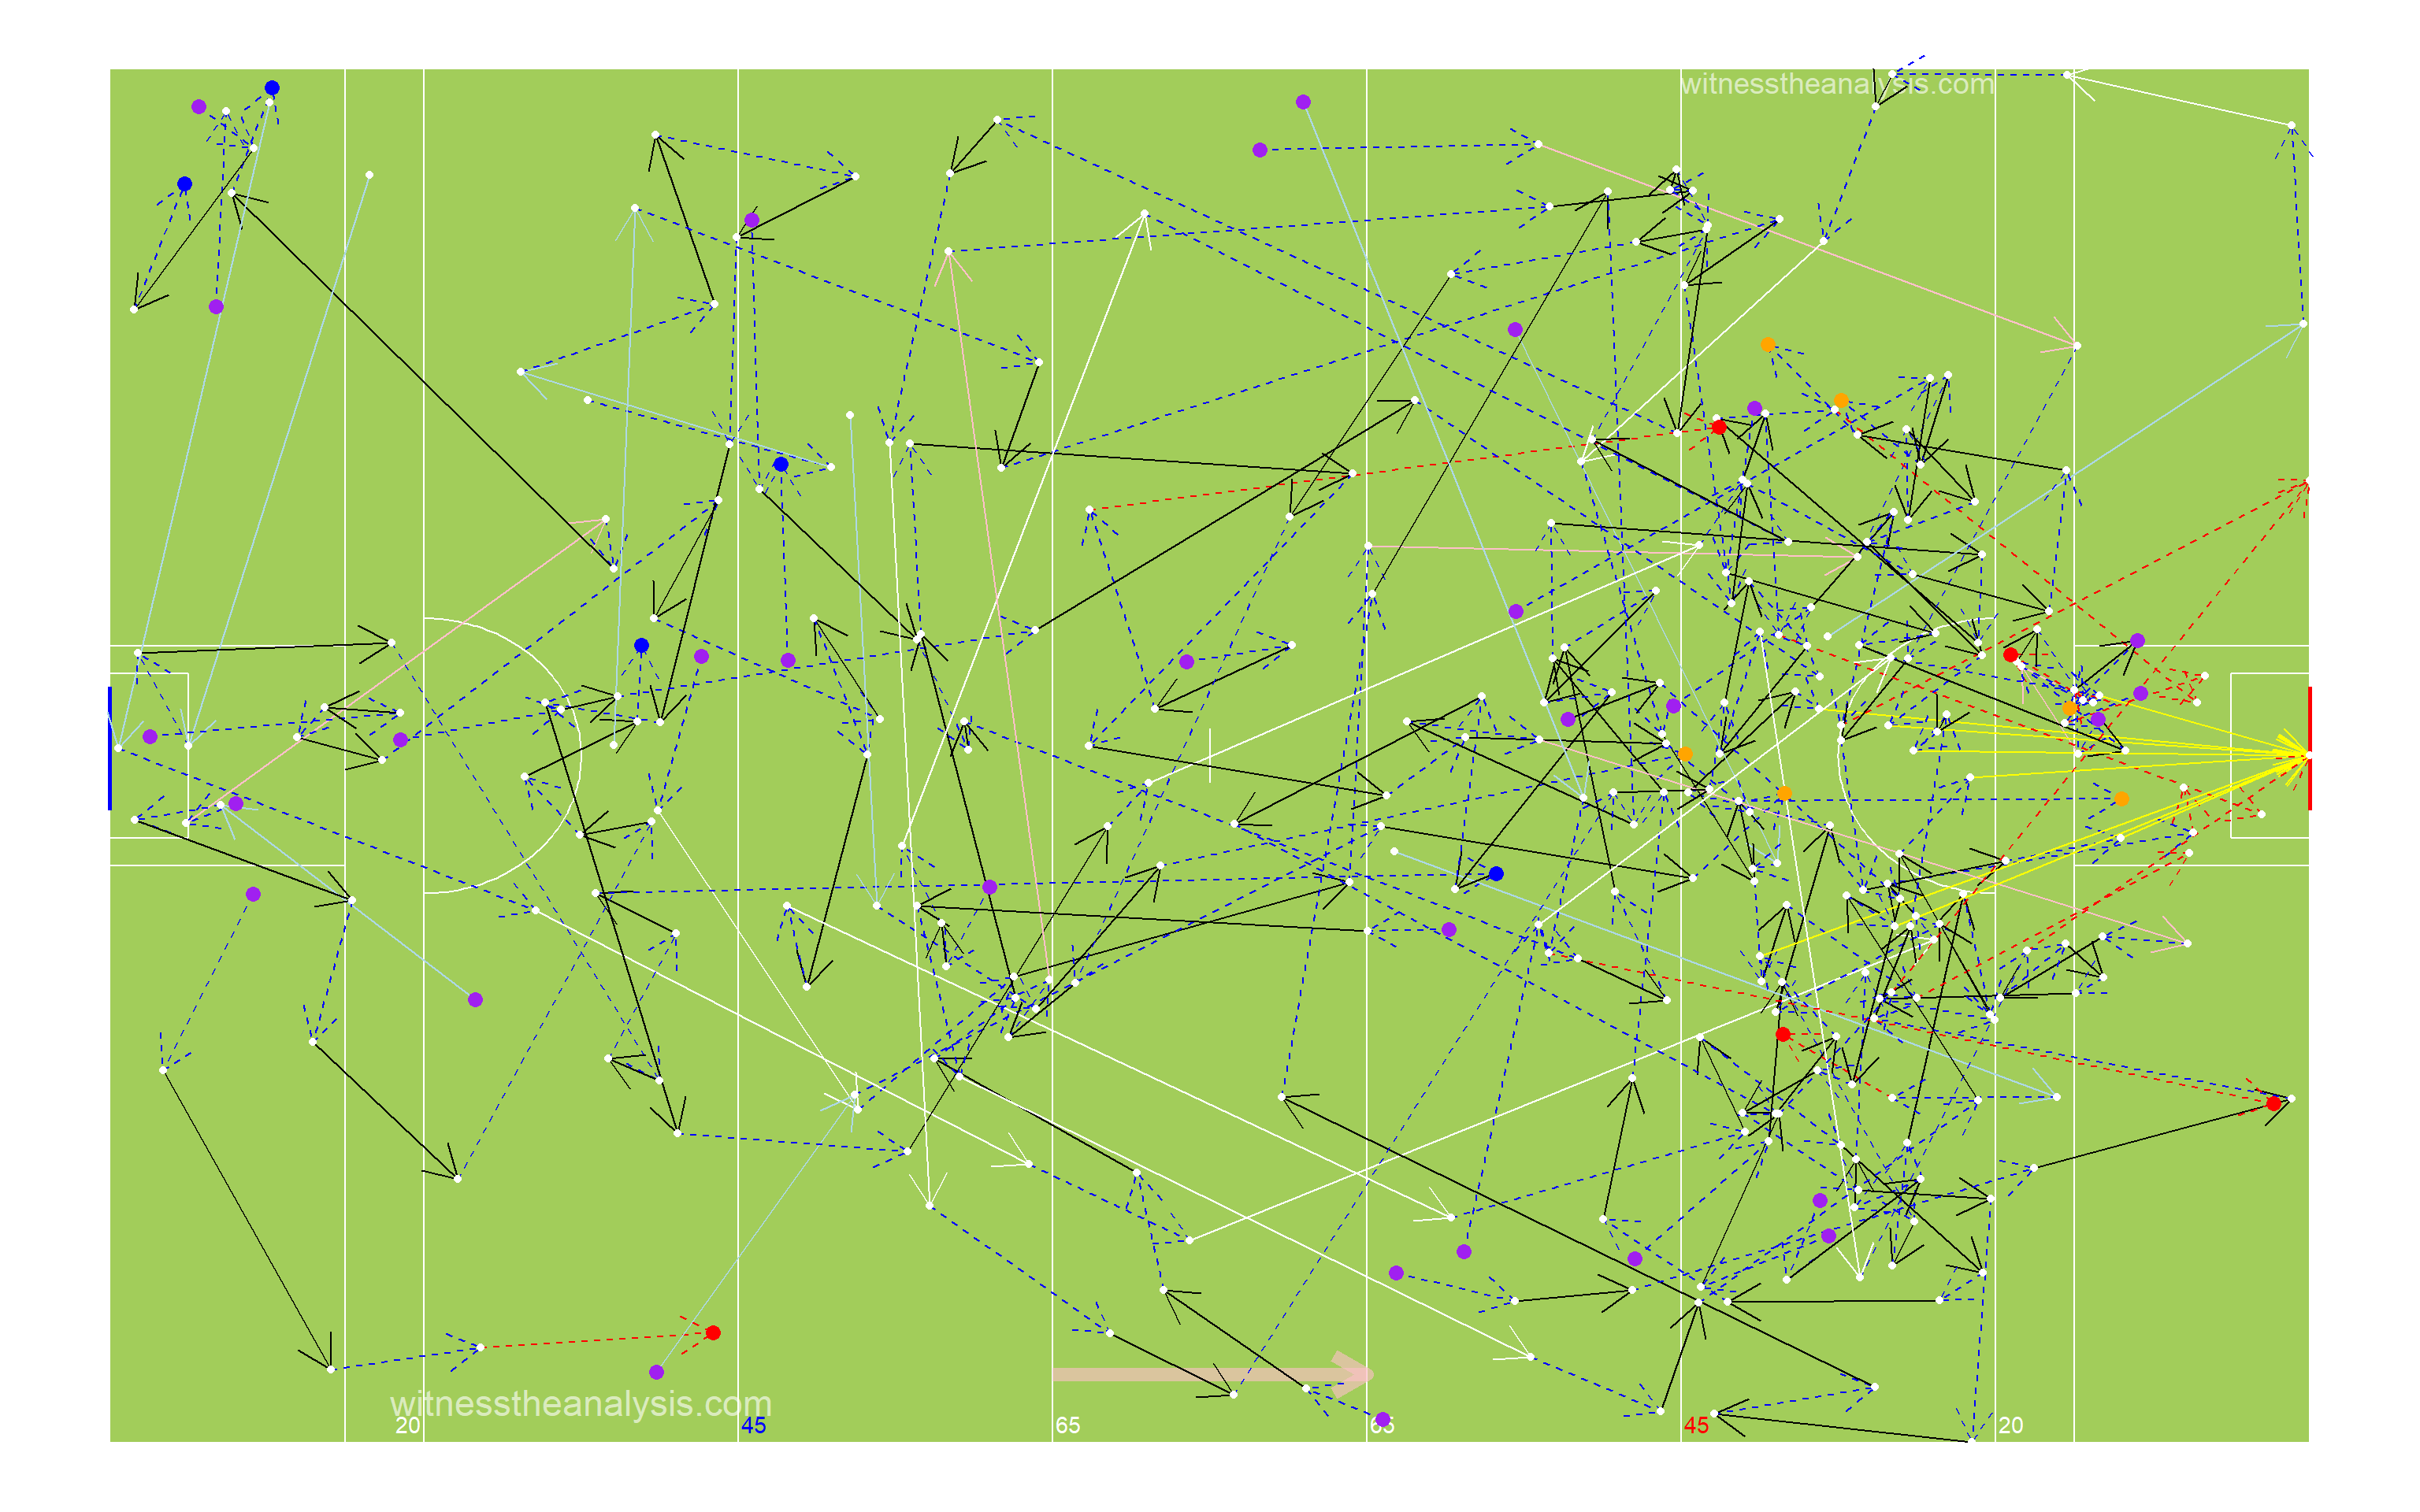
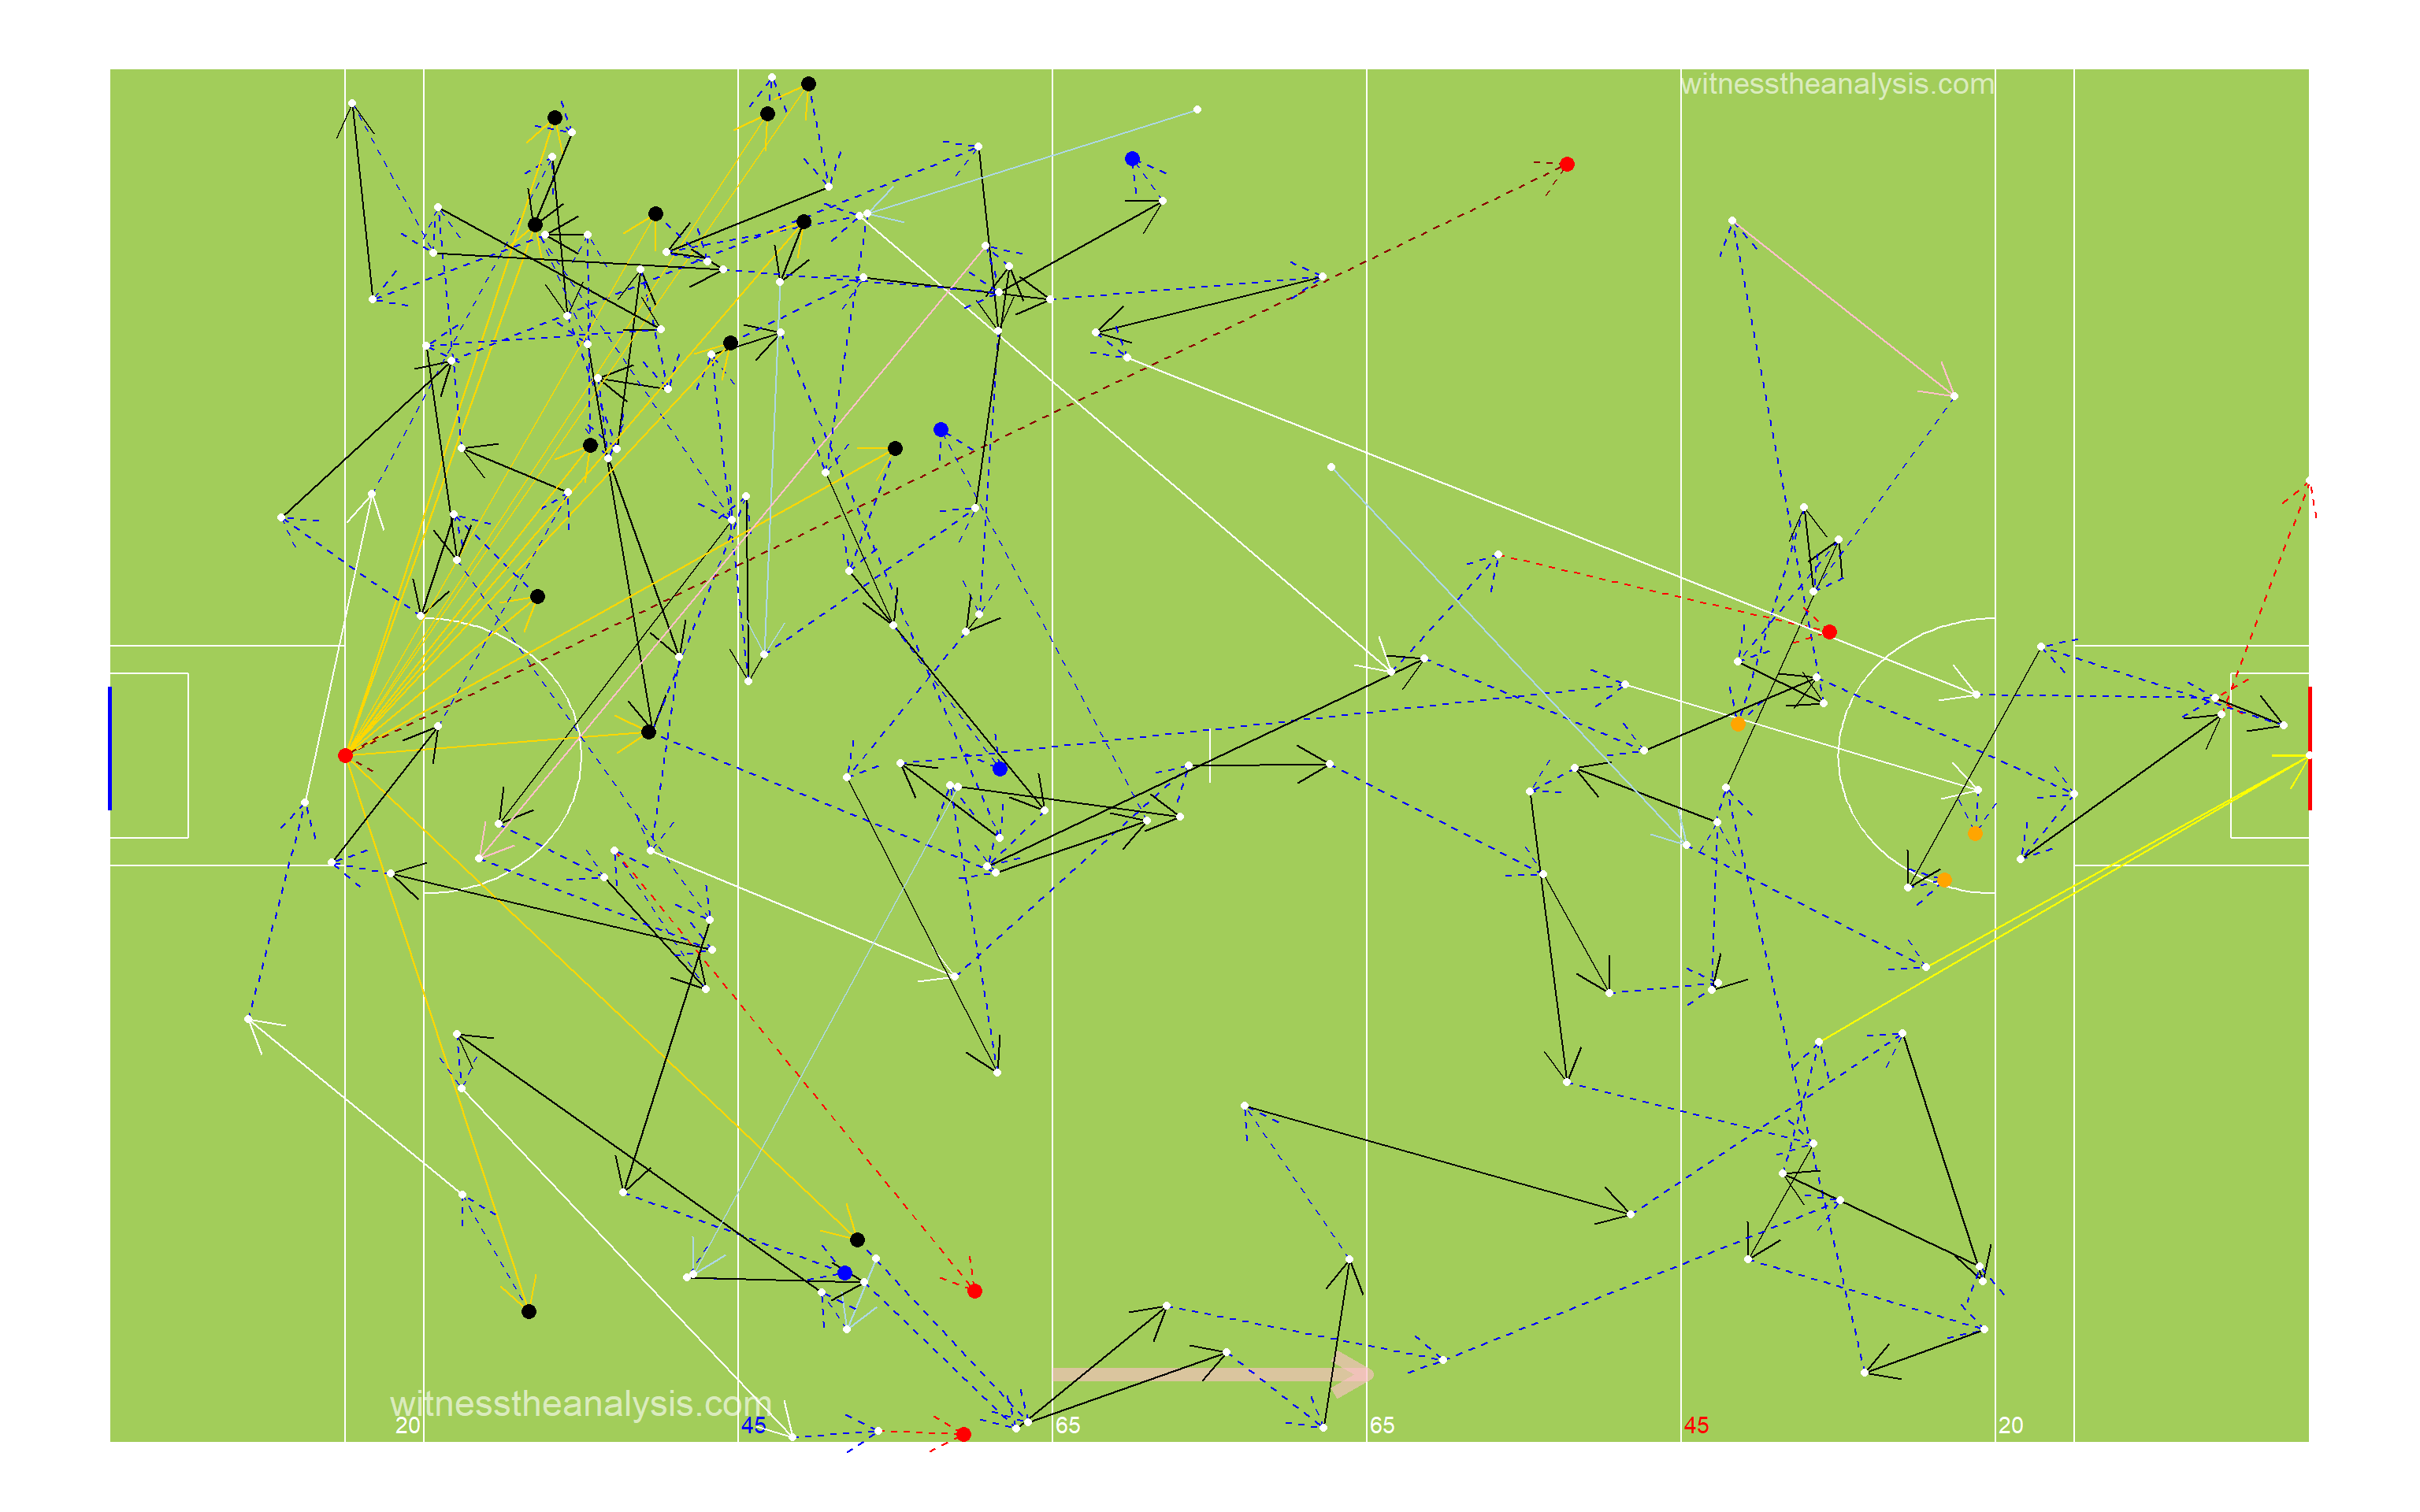
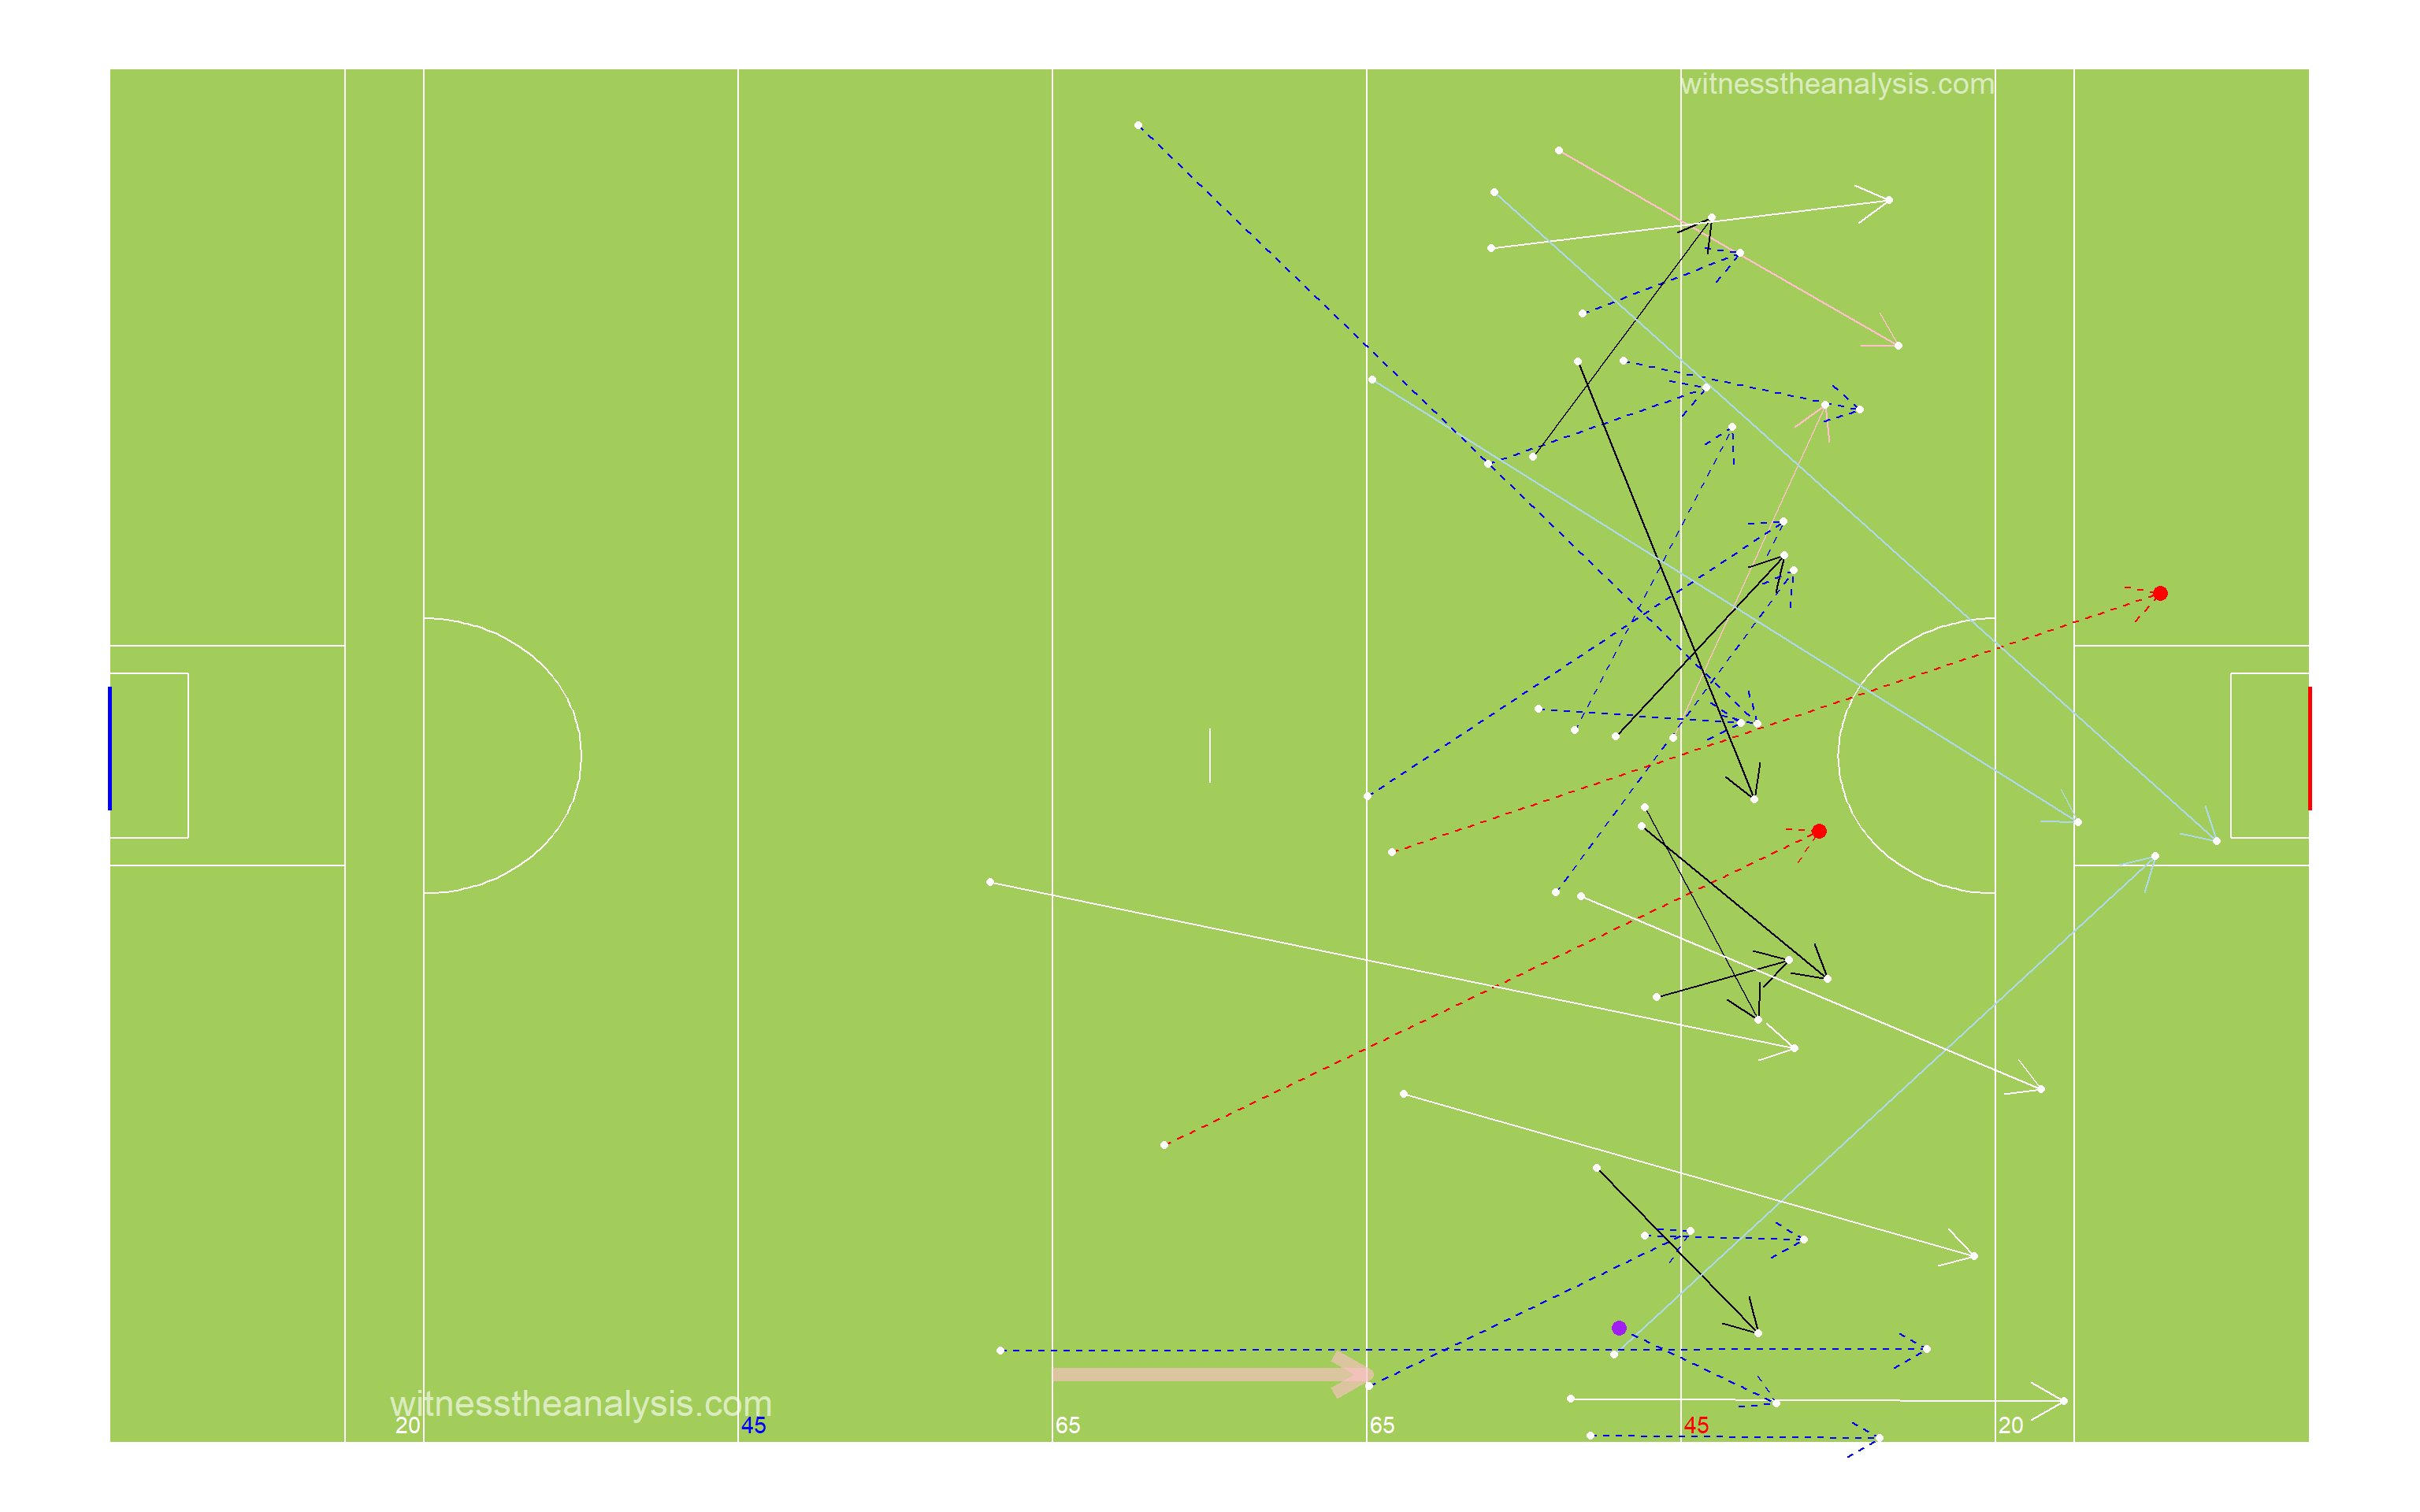
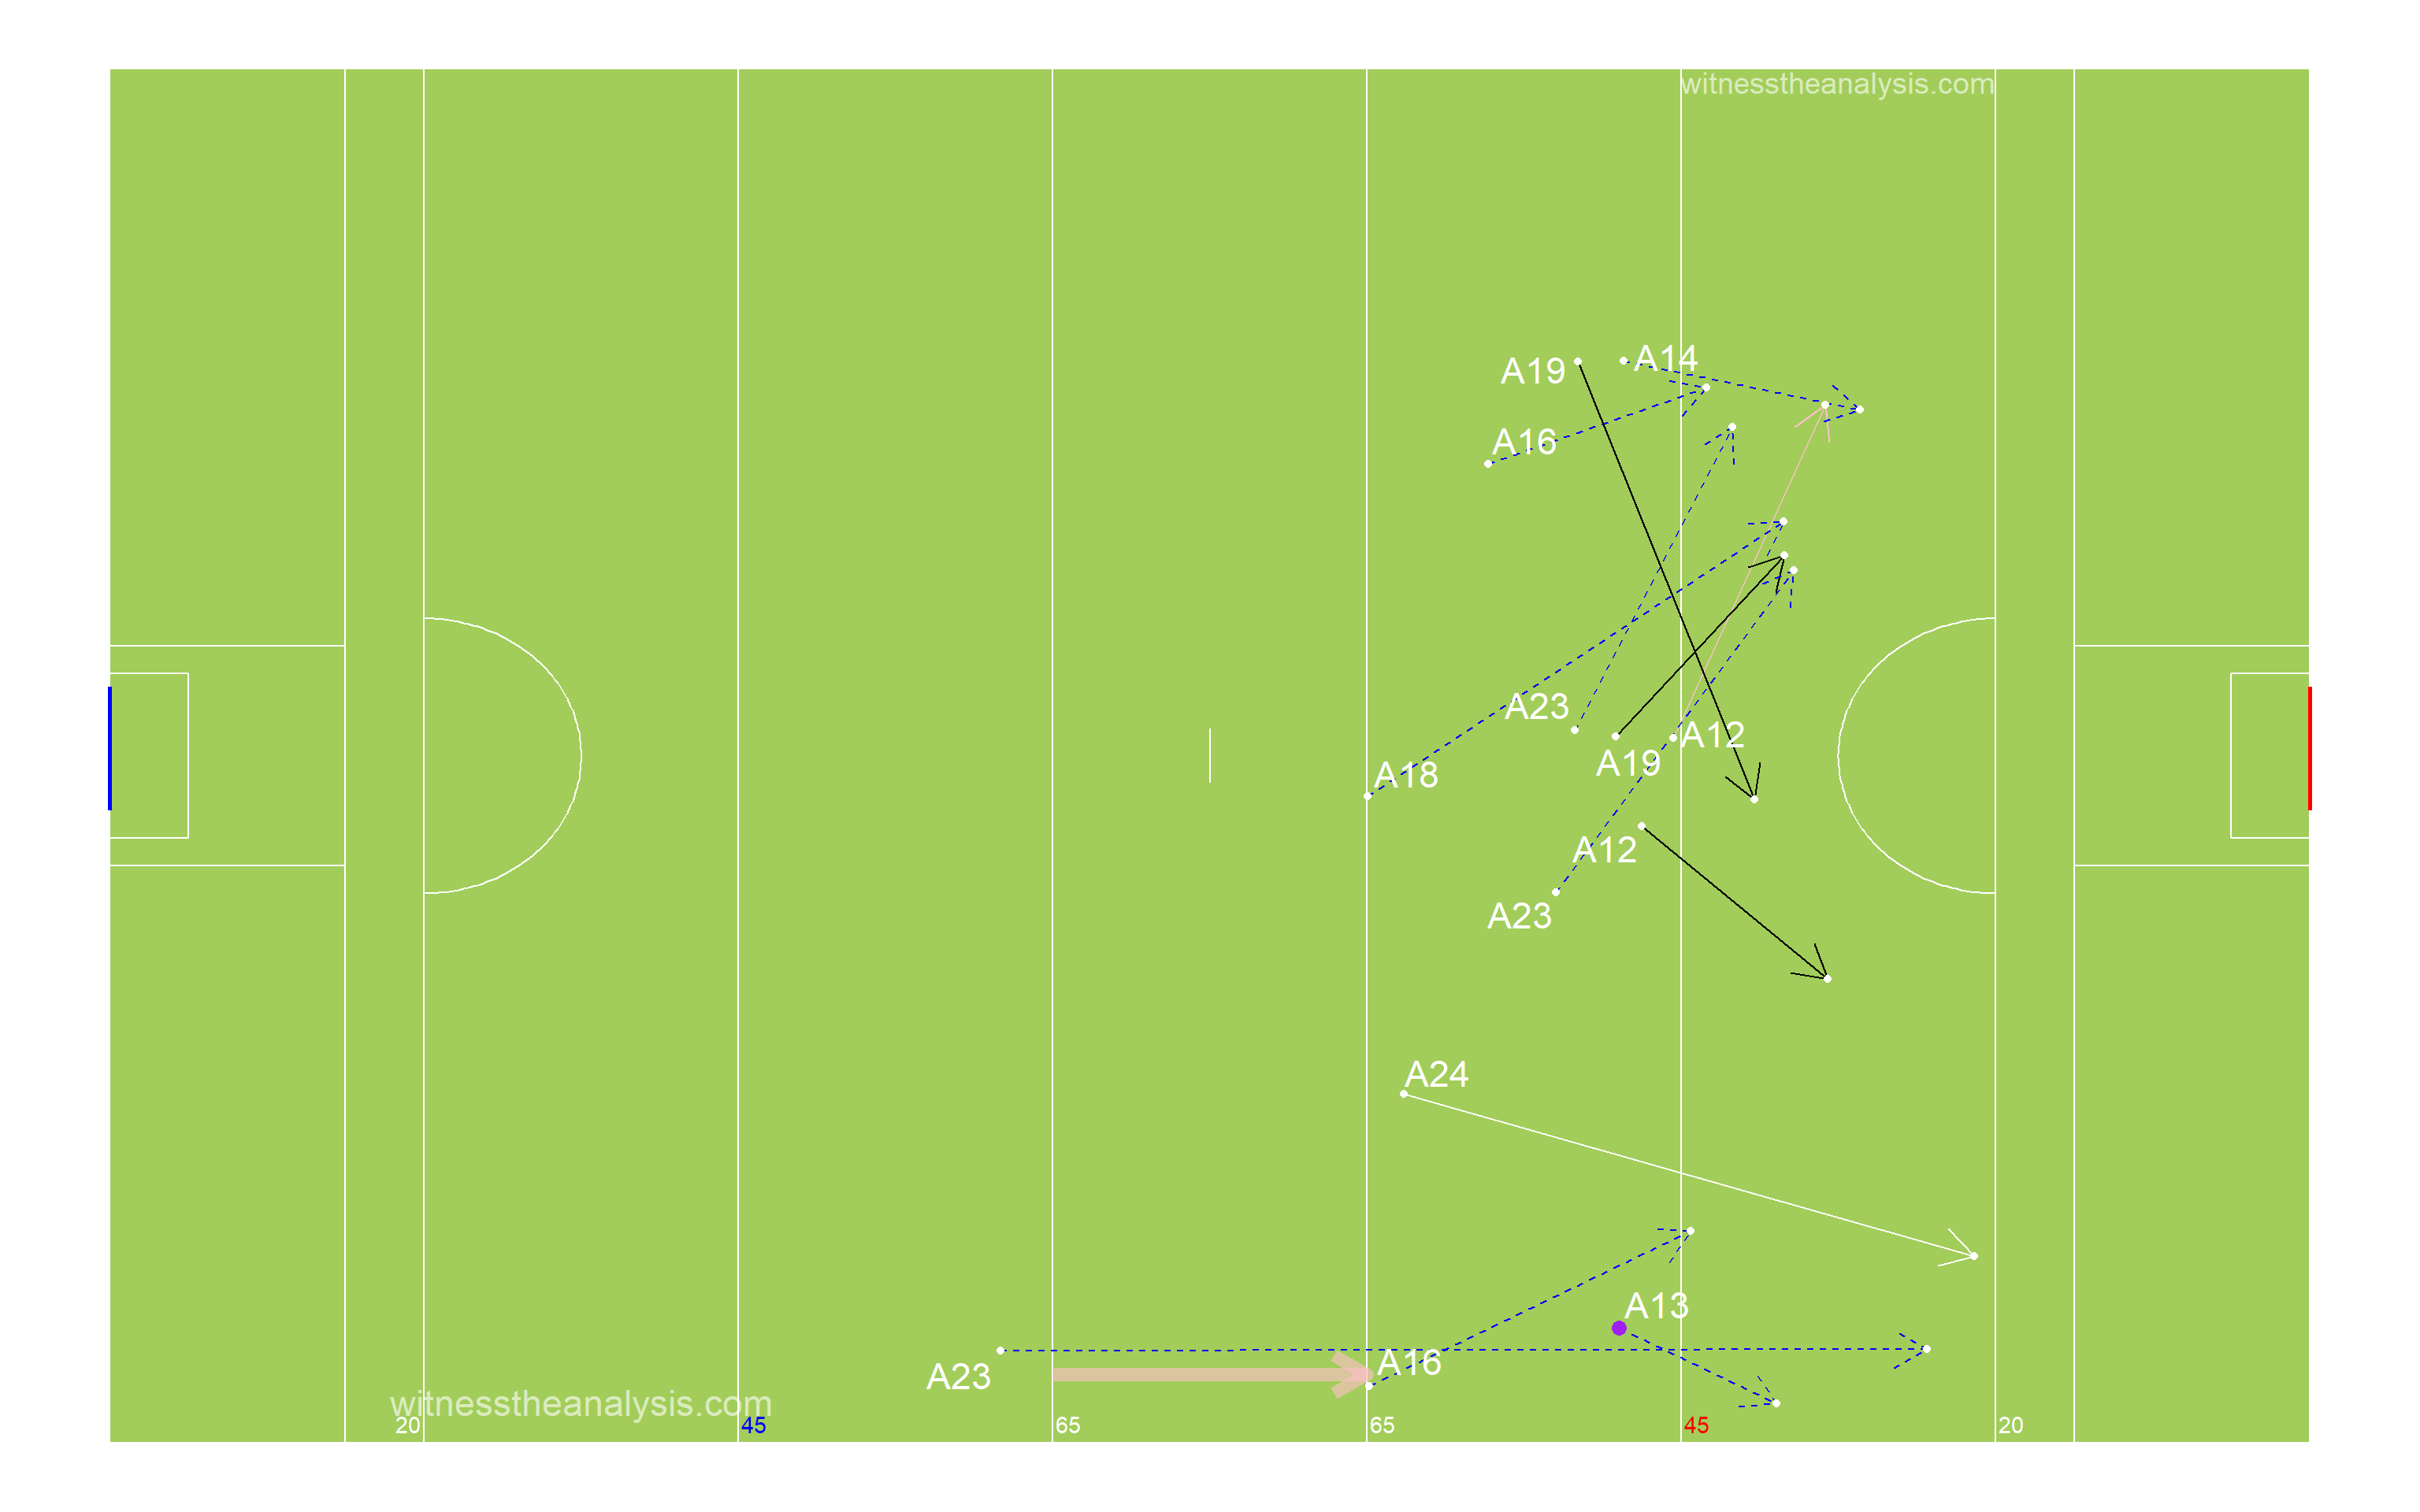
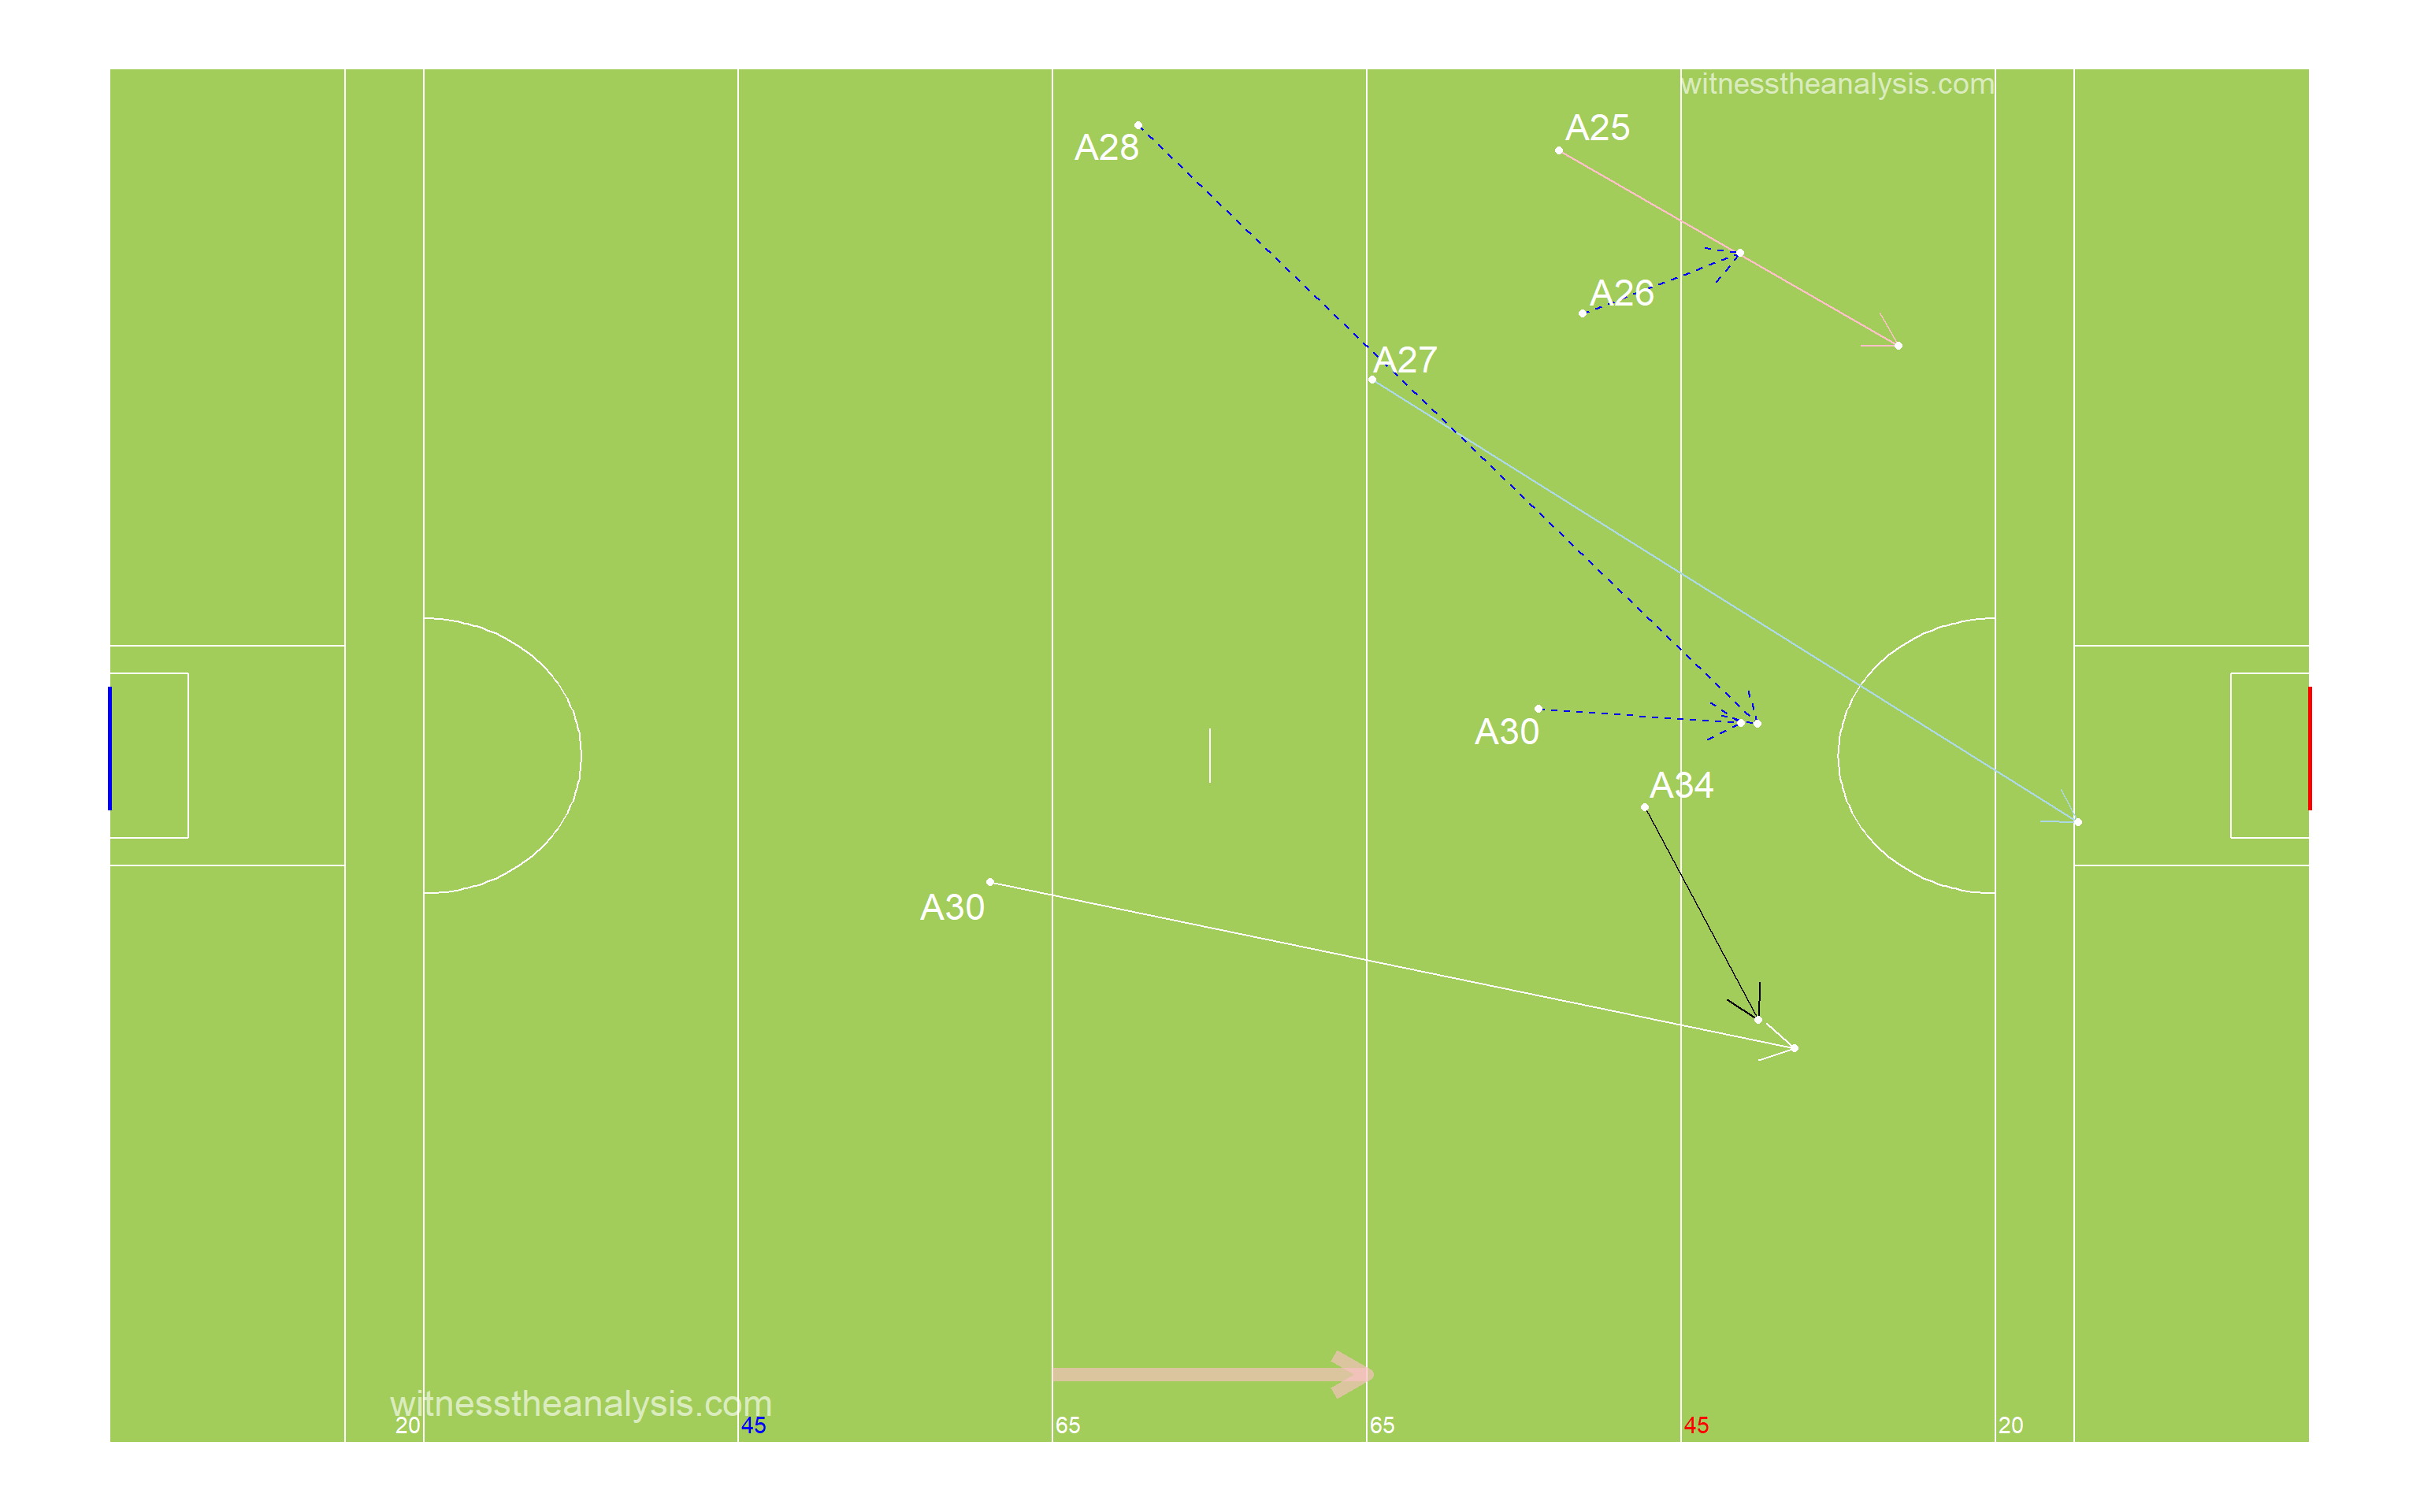
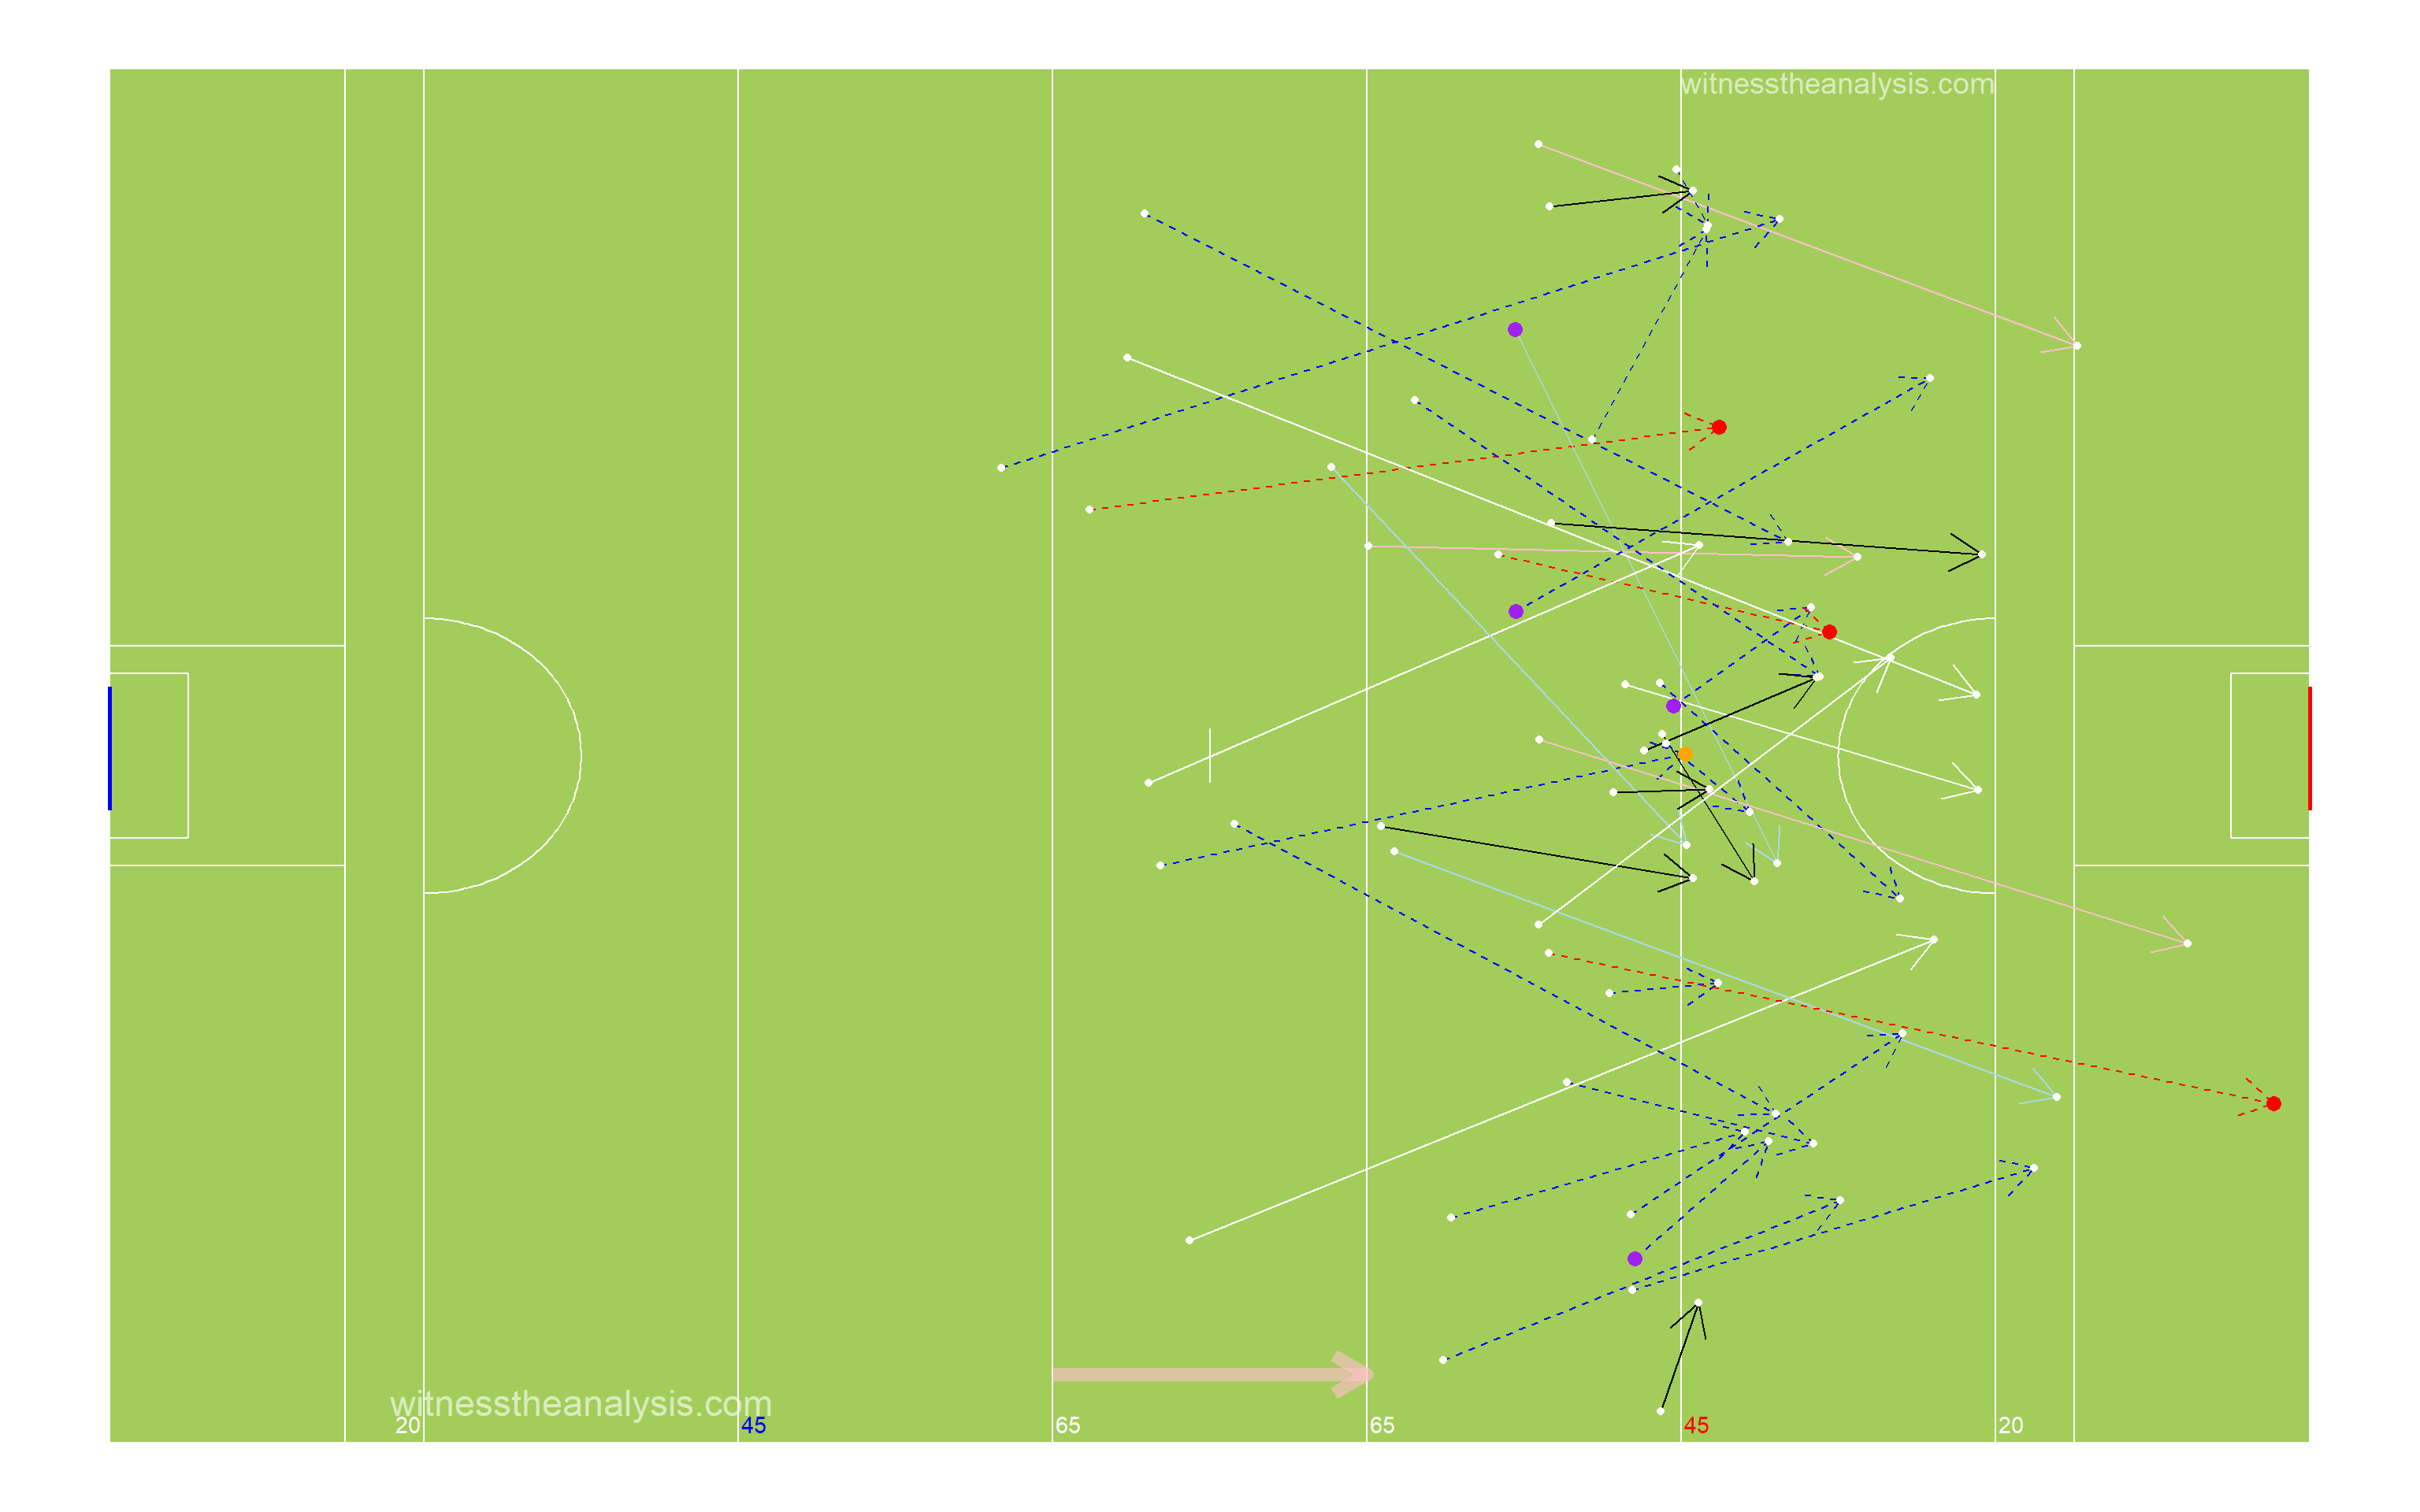
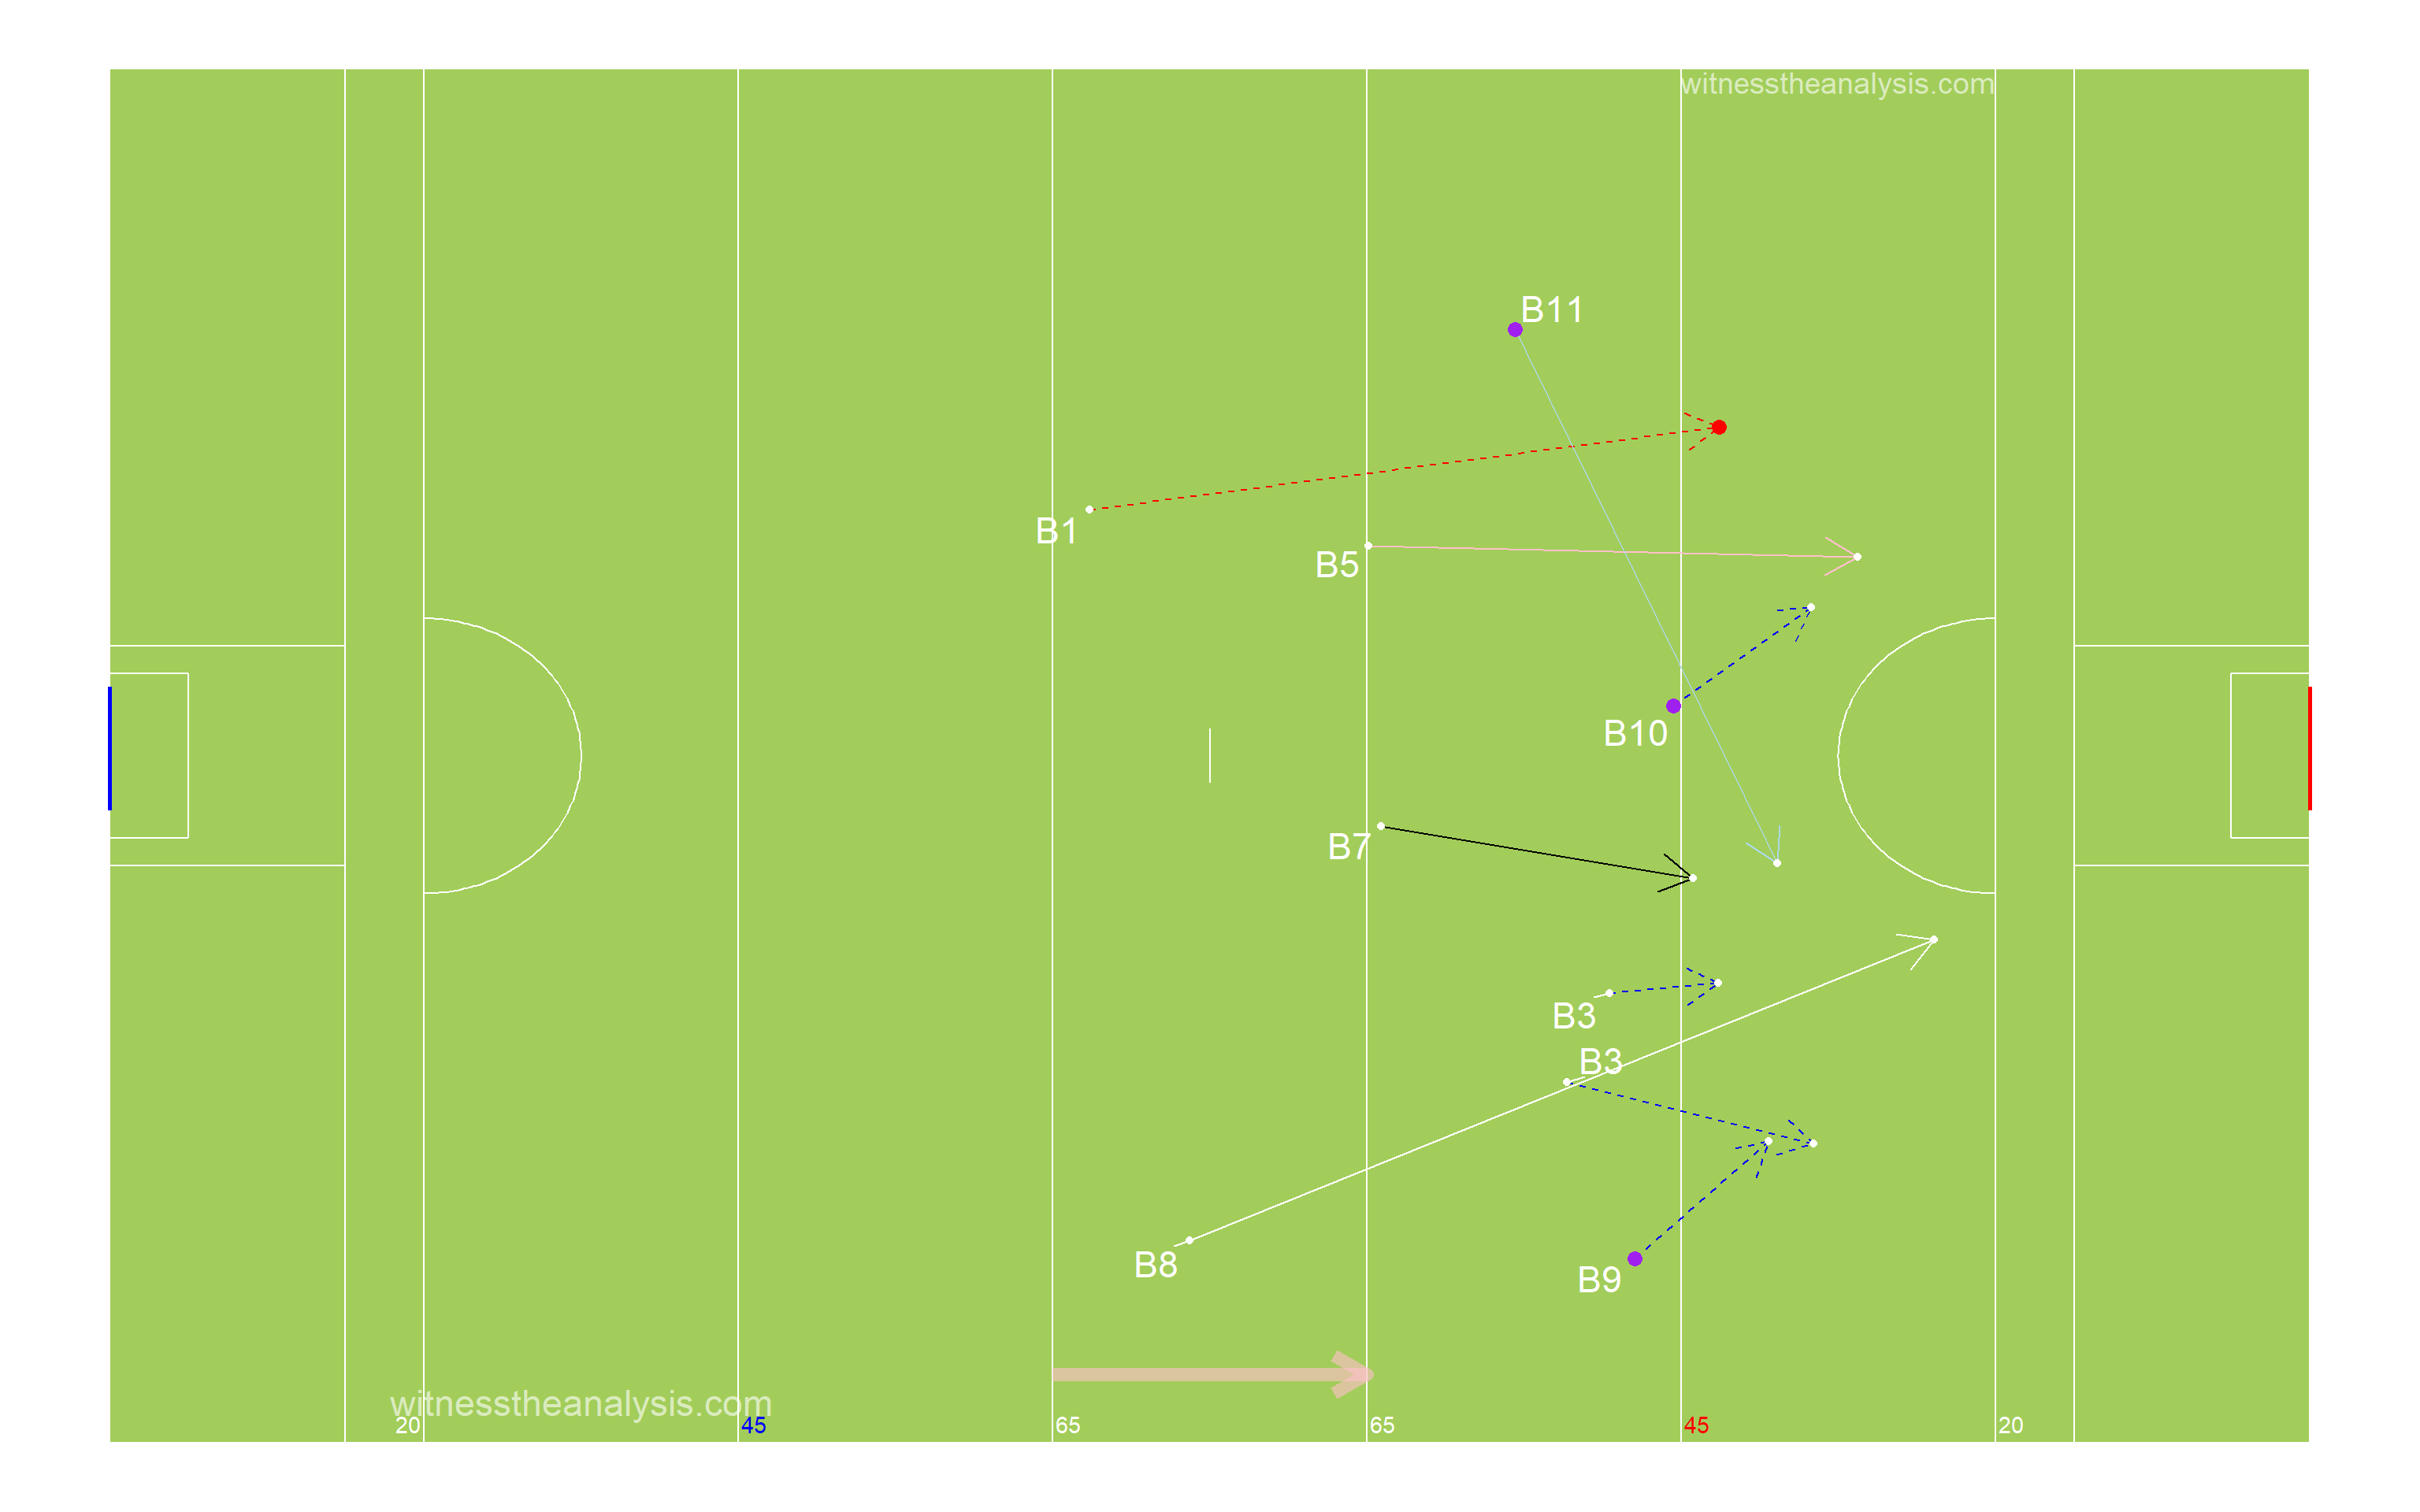
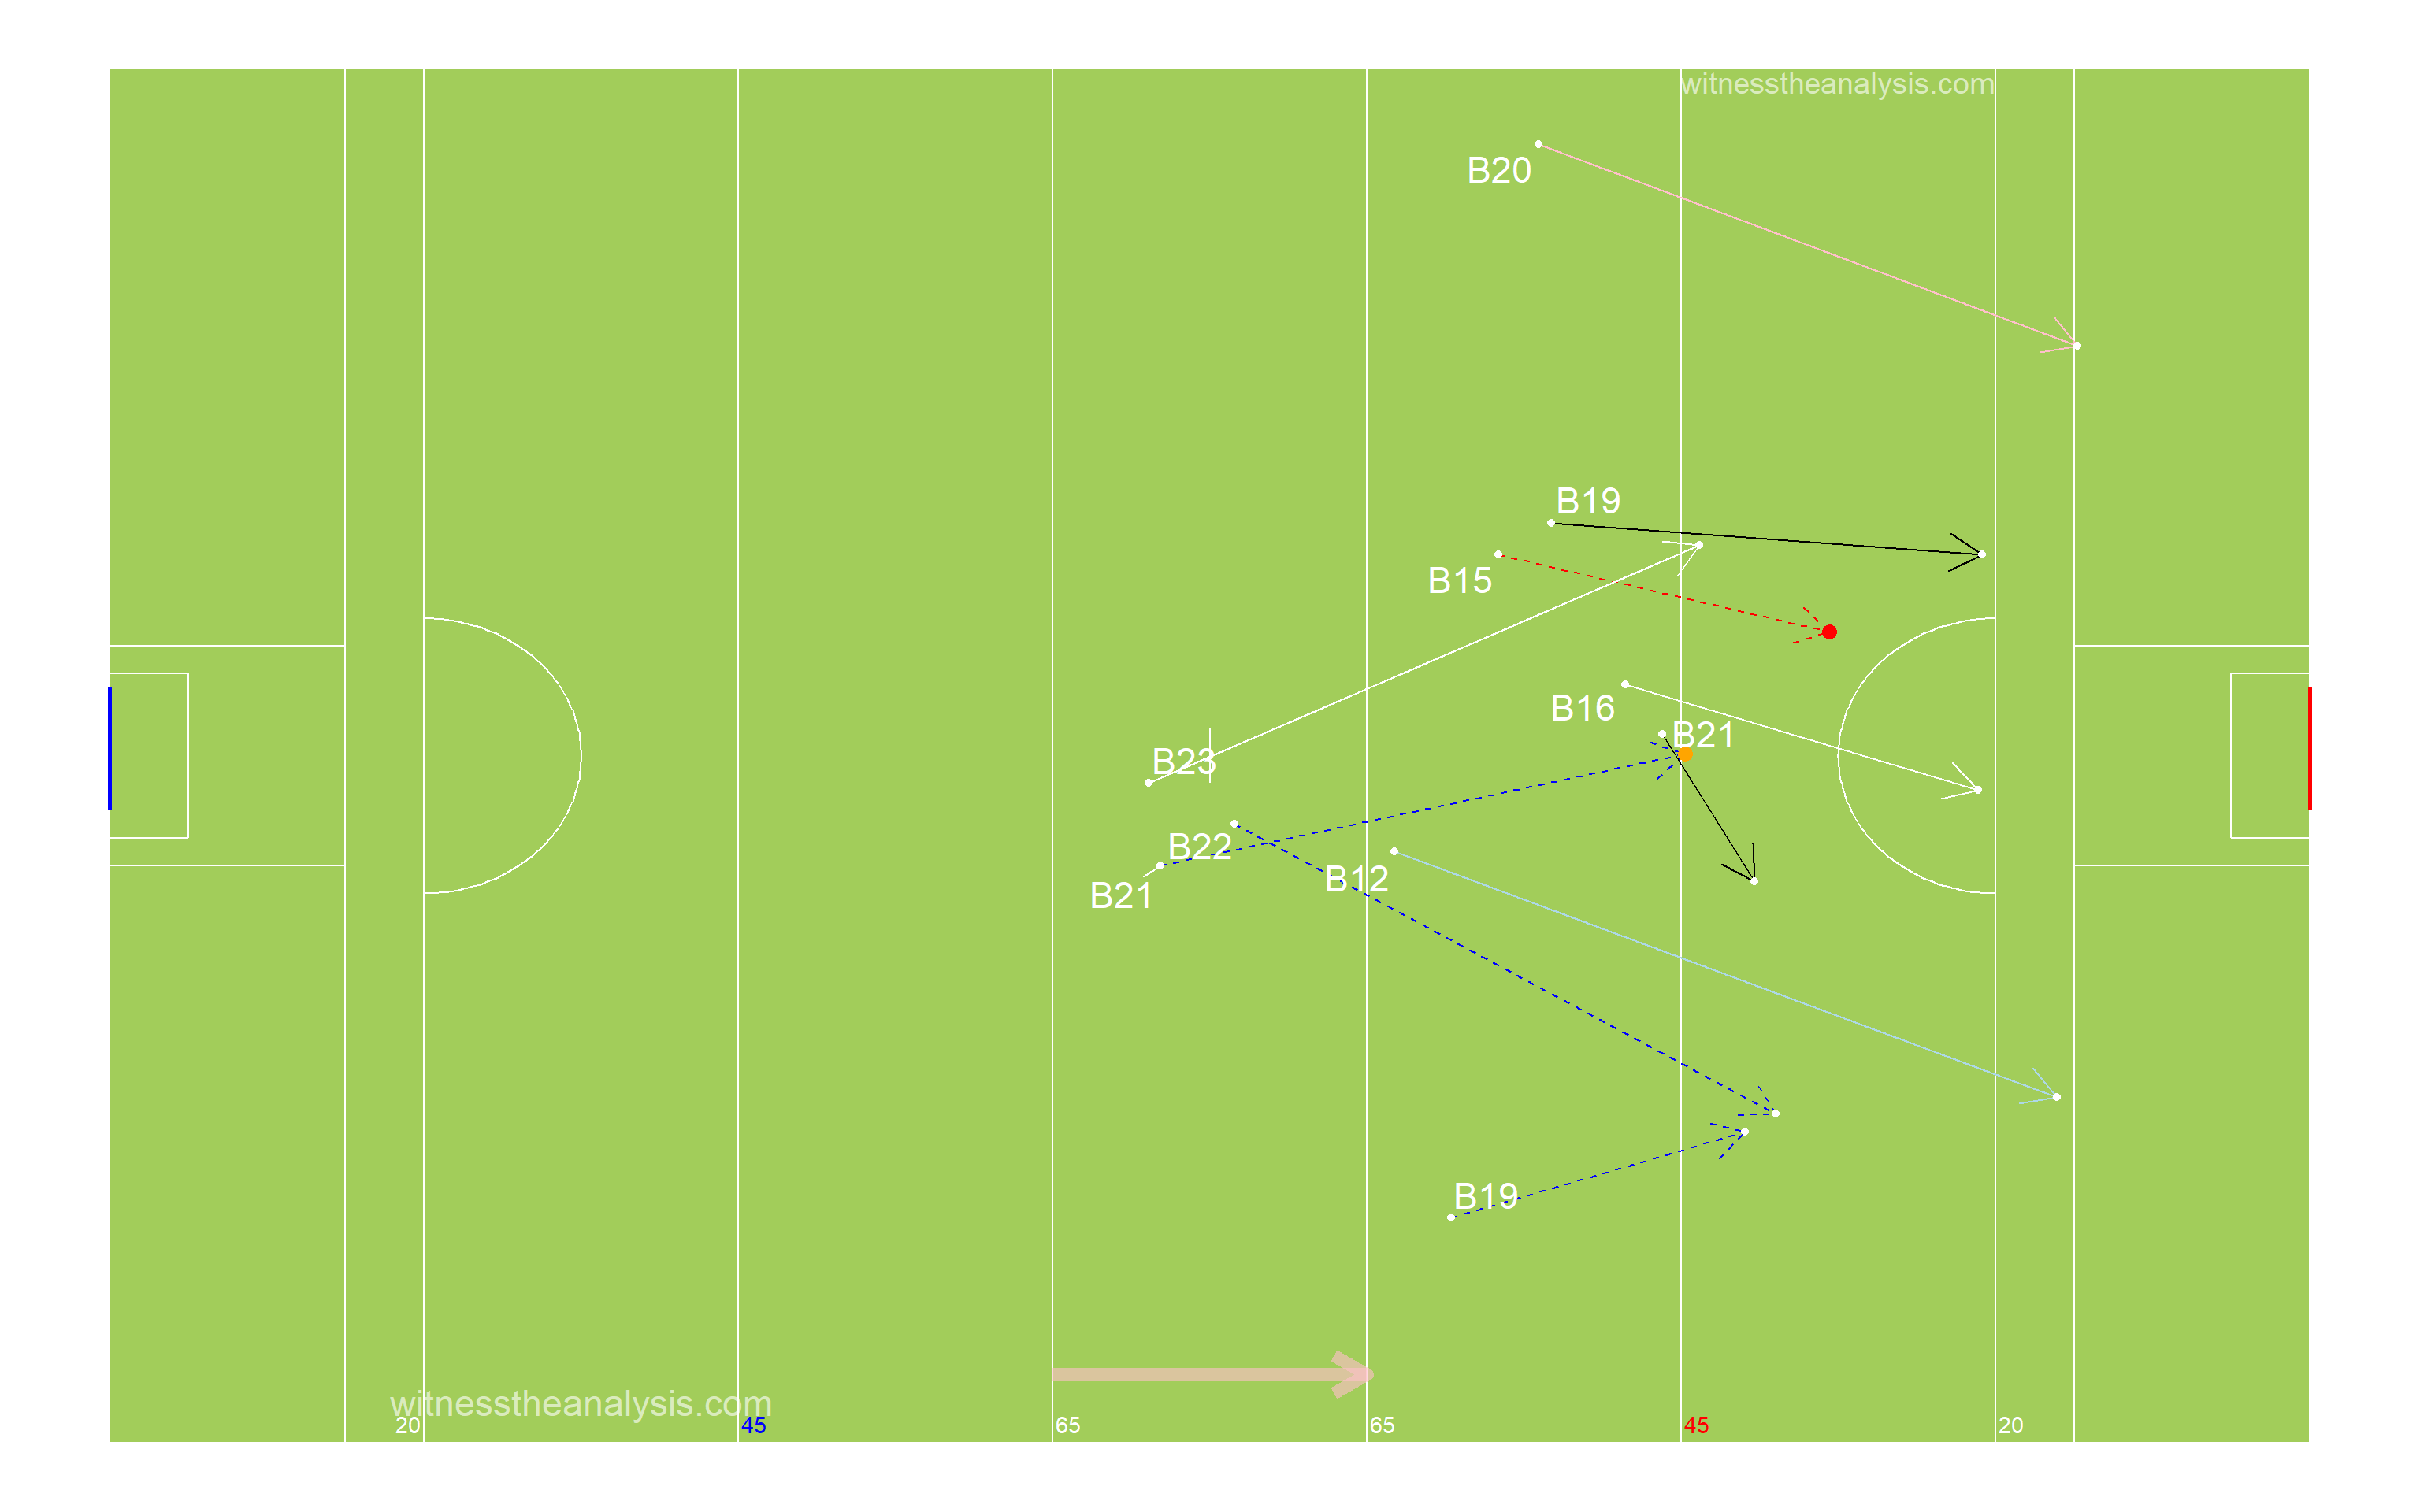
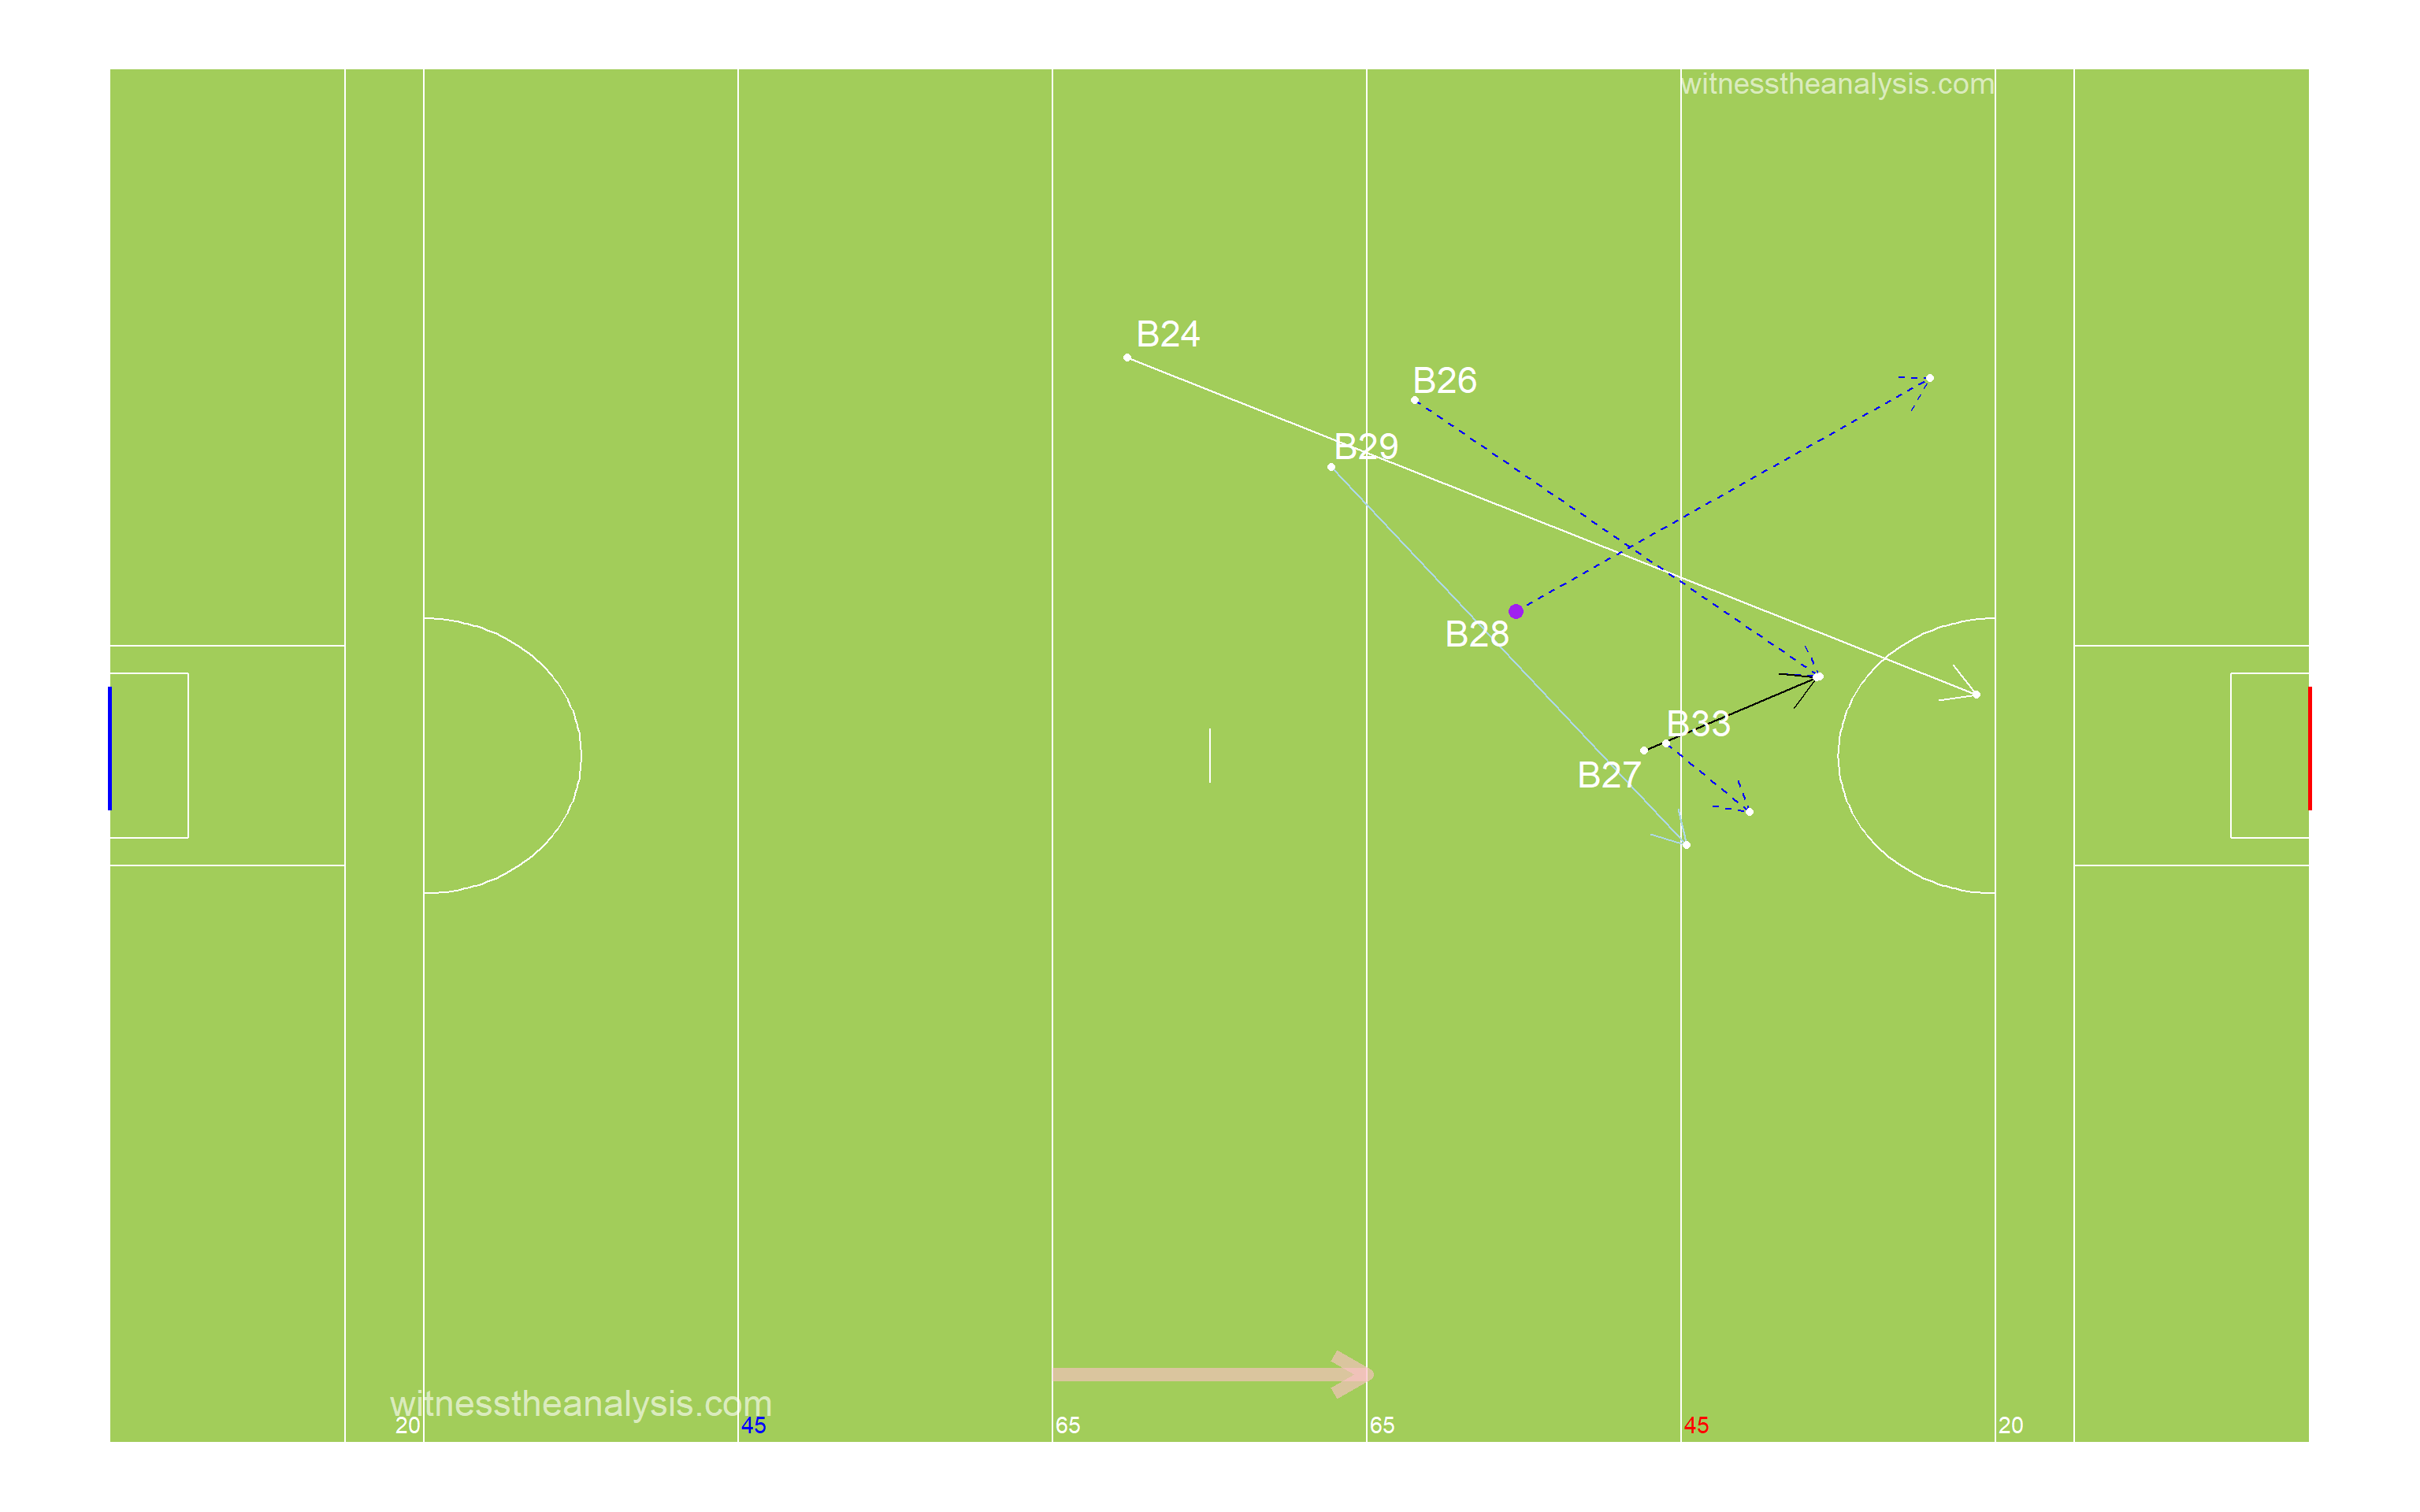
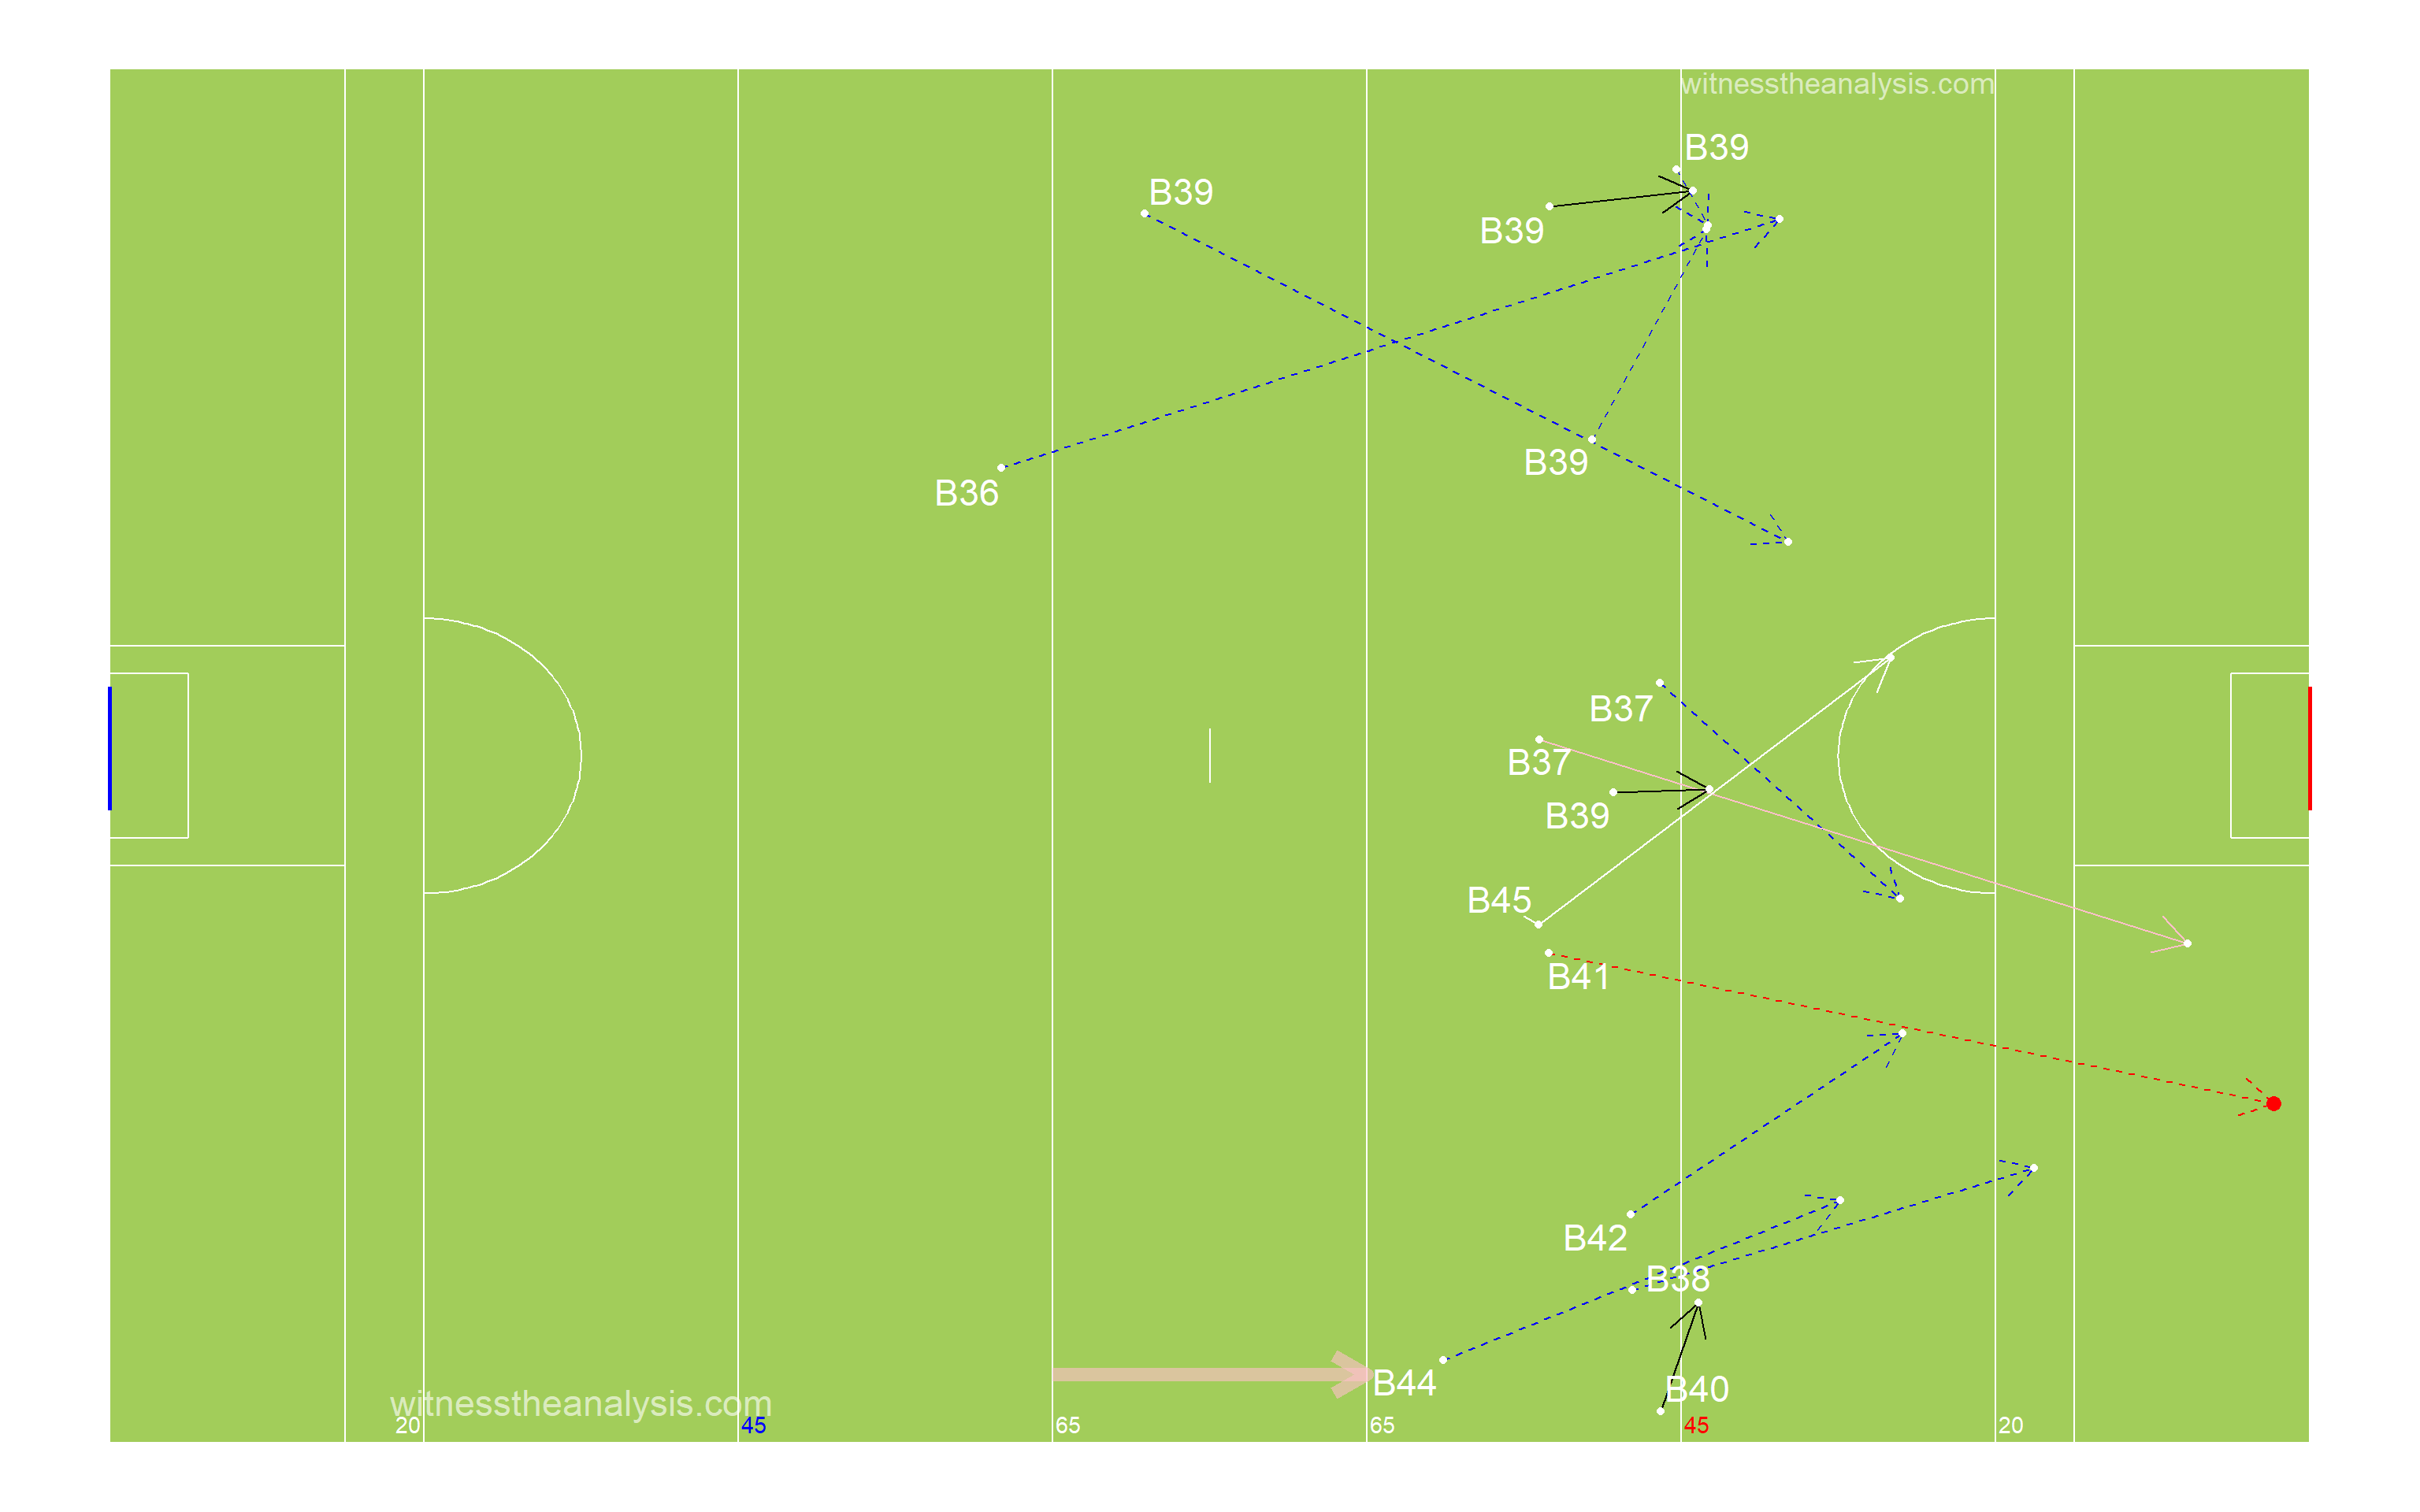
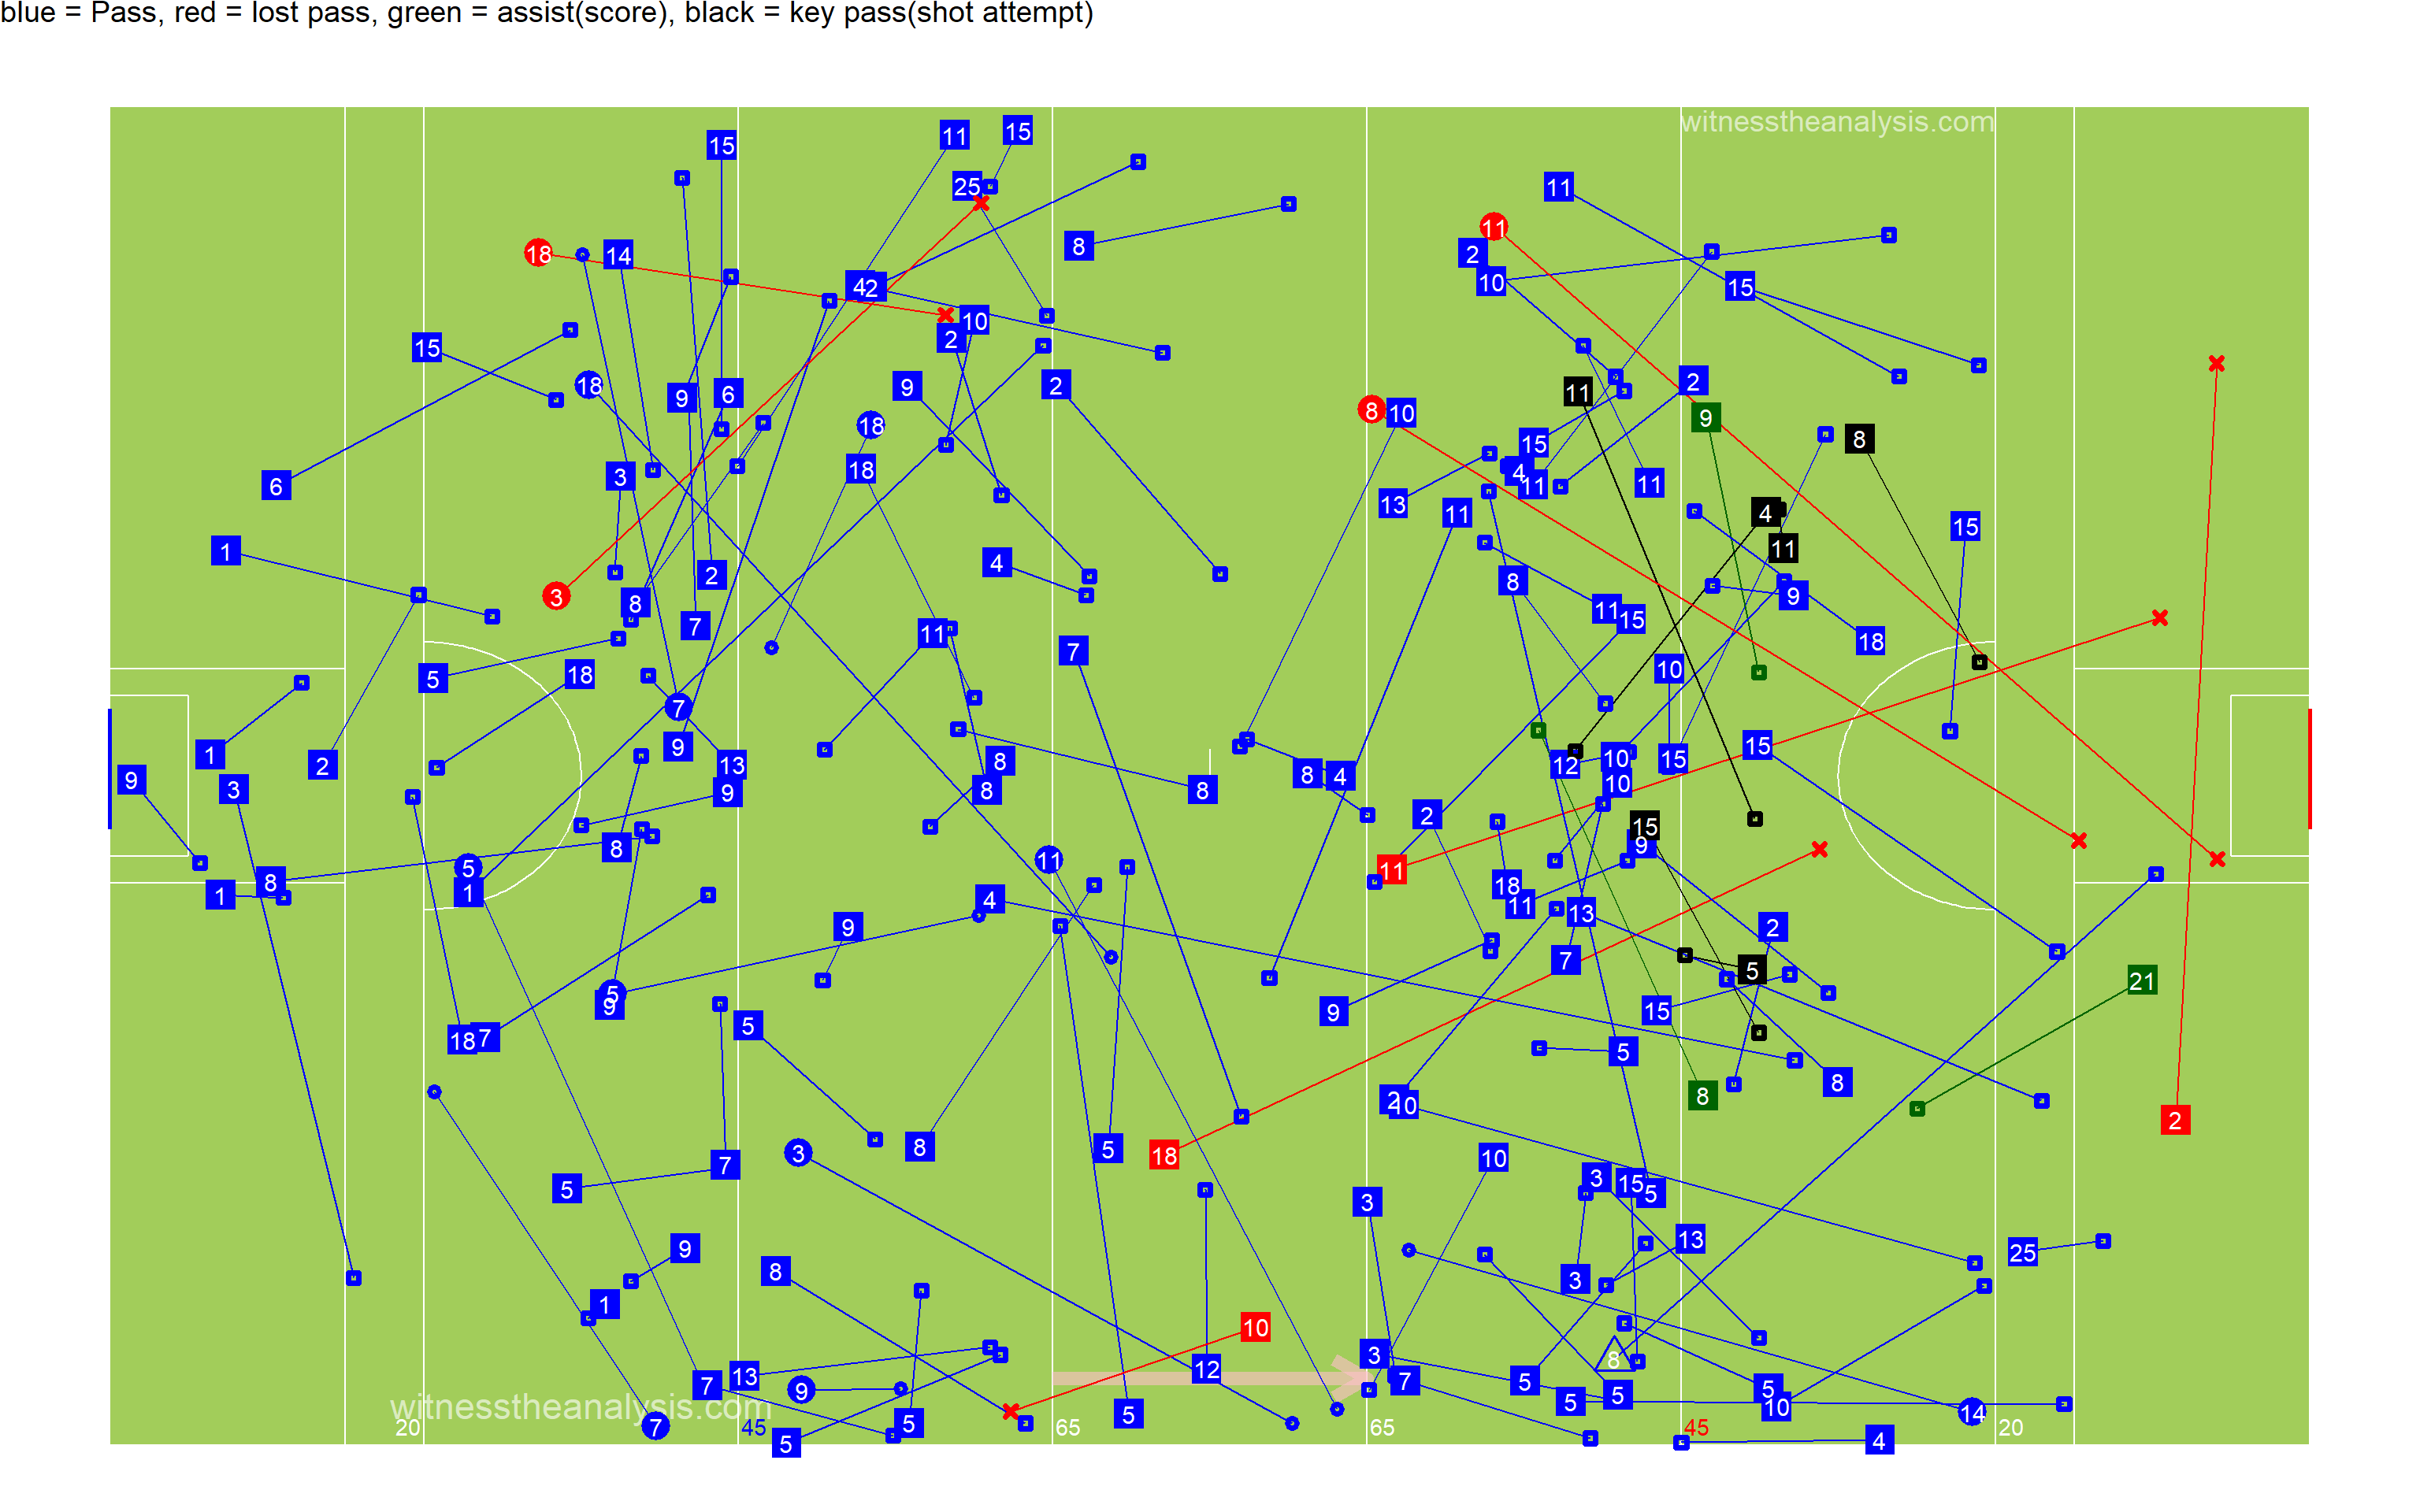
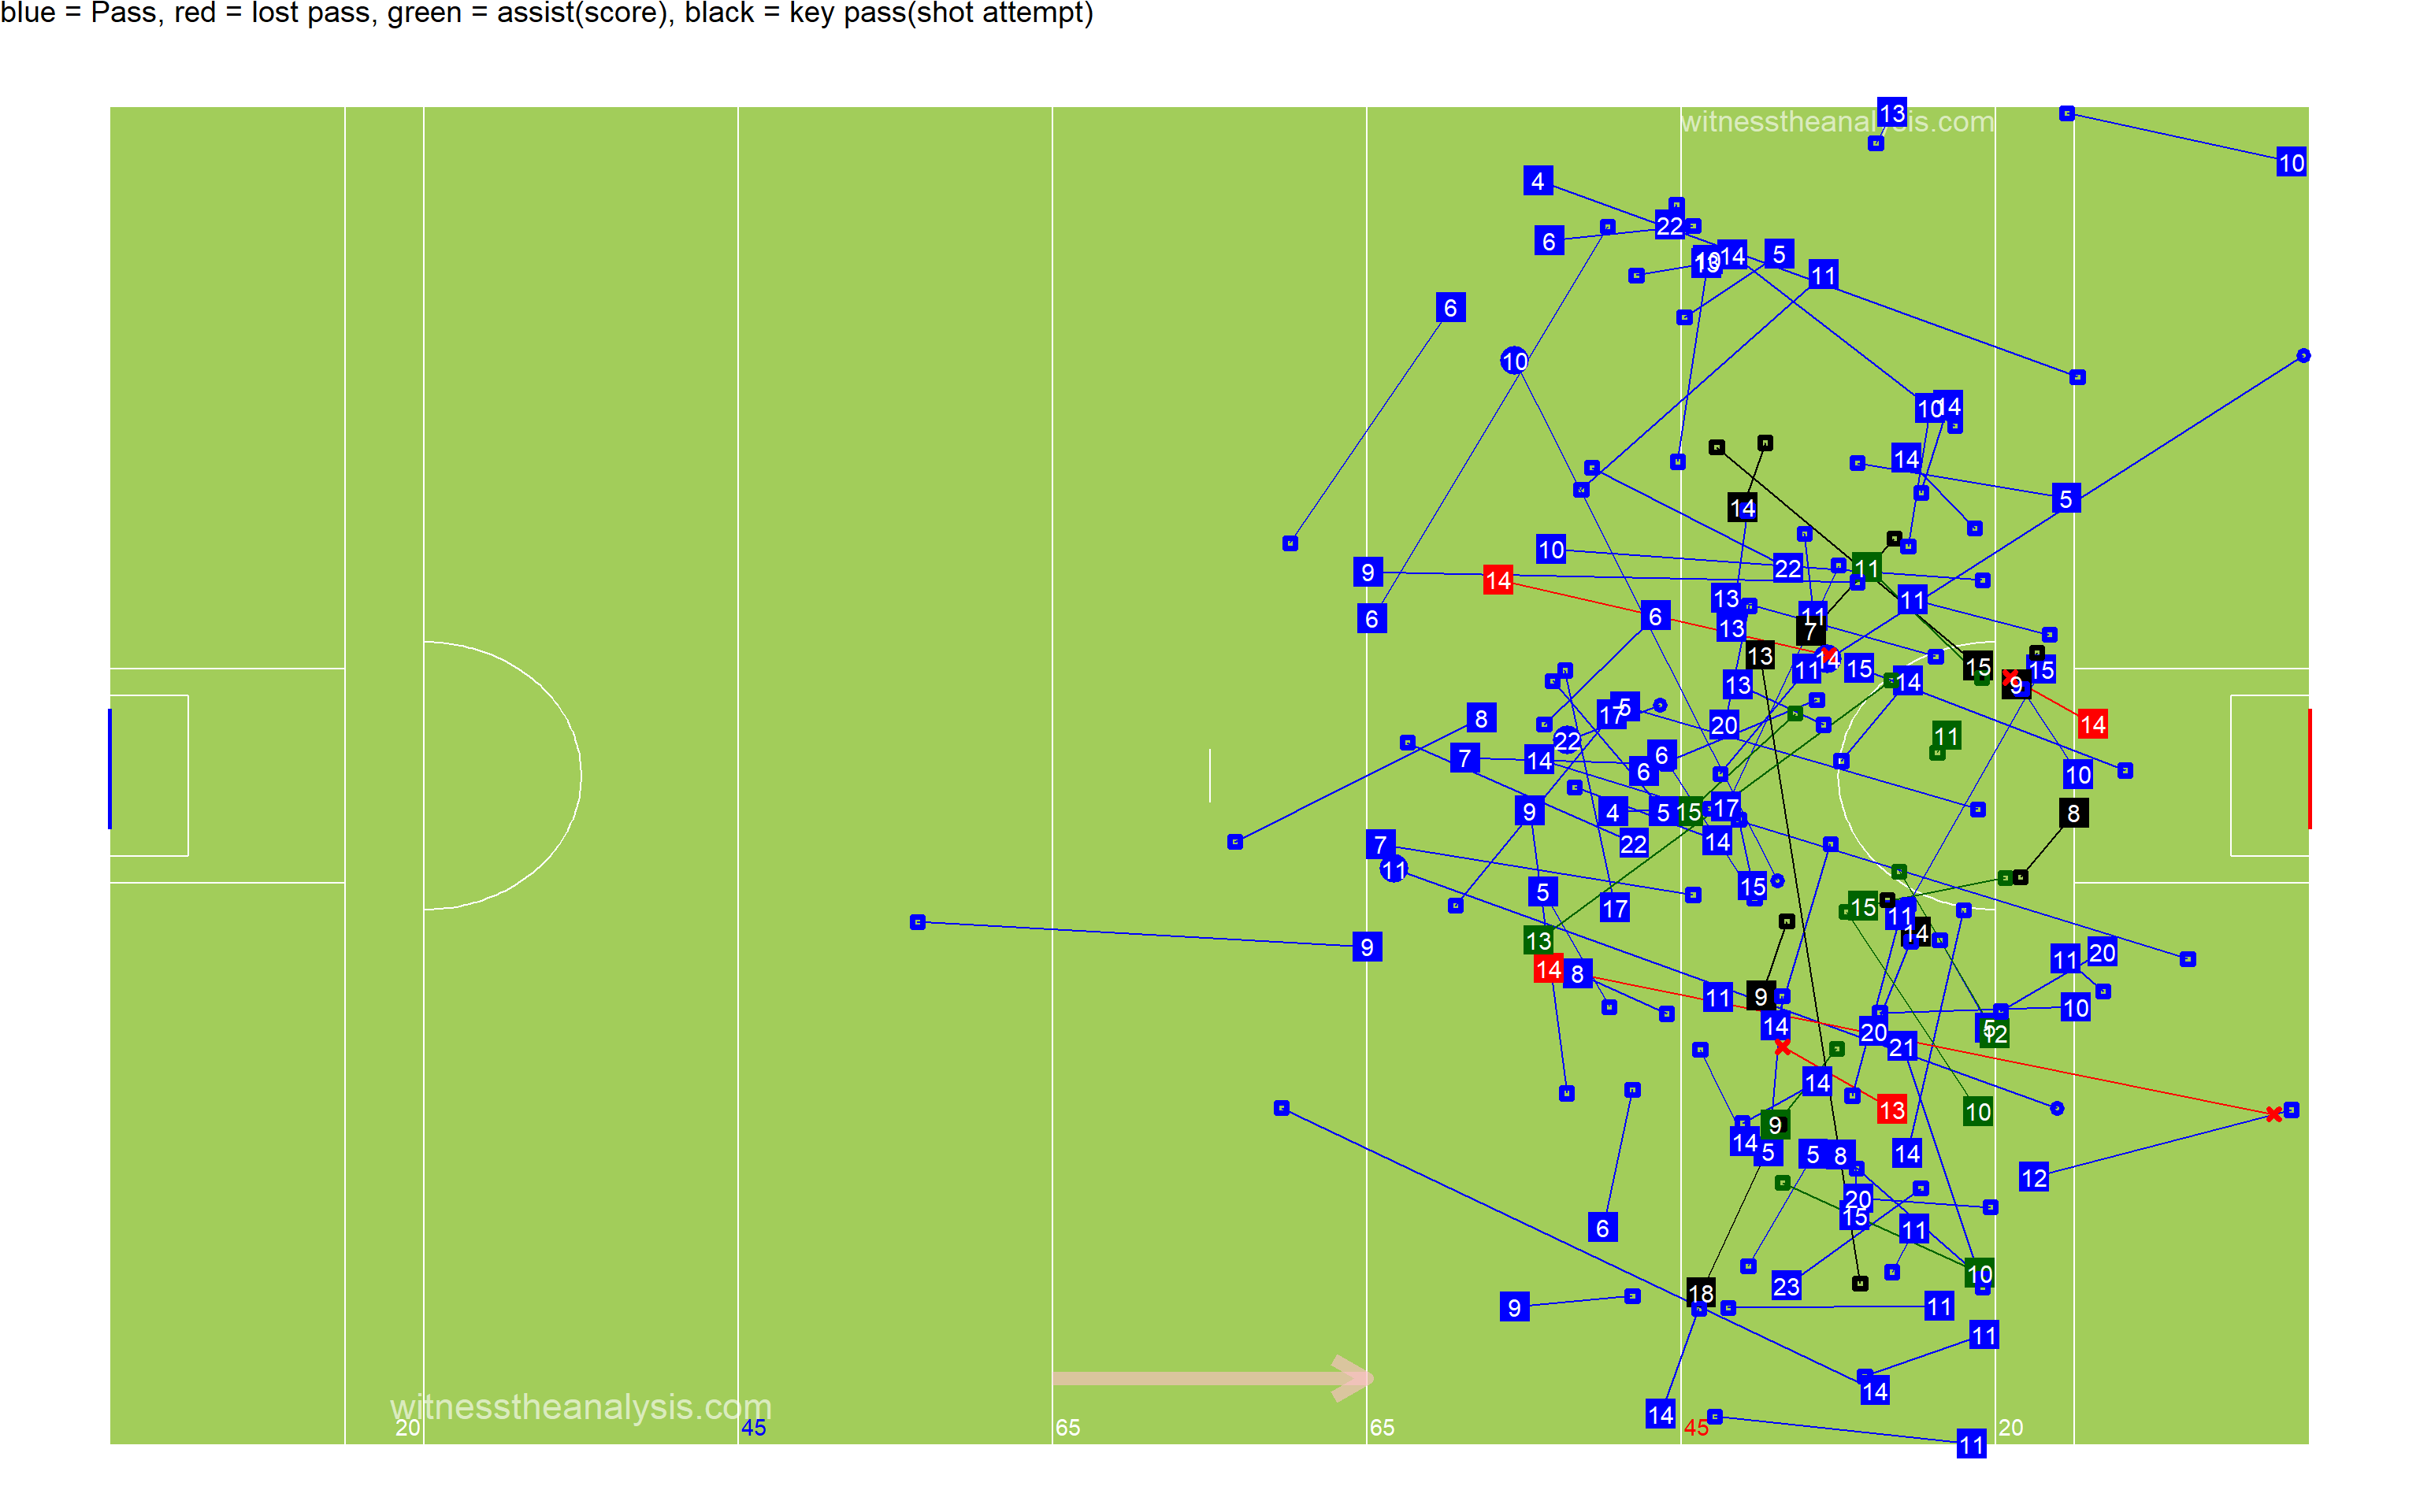
##Path of Possession
| Lines | X | X.1 | X.2 |
|---|---|---|---|
| Action | Colour | Action | Colour |
| Hand Pass | Black | Kickout Lost | Dark Red |
| Run | Blue | Kick Pass Left | Pink |
| Score | Yellow | Kick Pass Right | White |
| Miss shot | Red | Fk/Mk/Sl Pass | Light Blue |
| Kickout | Gold | Pass Loss | Red |
| Dots | |||
| Action | Colour | ||
| Possession Won | Purple | ||
| Ko/Pass Lost | Red | ||
| Fk Won | Blue | ||
| Fk Won (in 45) | Orange | ||
| Kickout Won | Black |
###Thomas Davis - Game 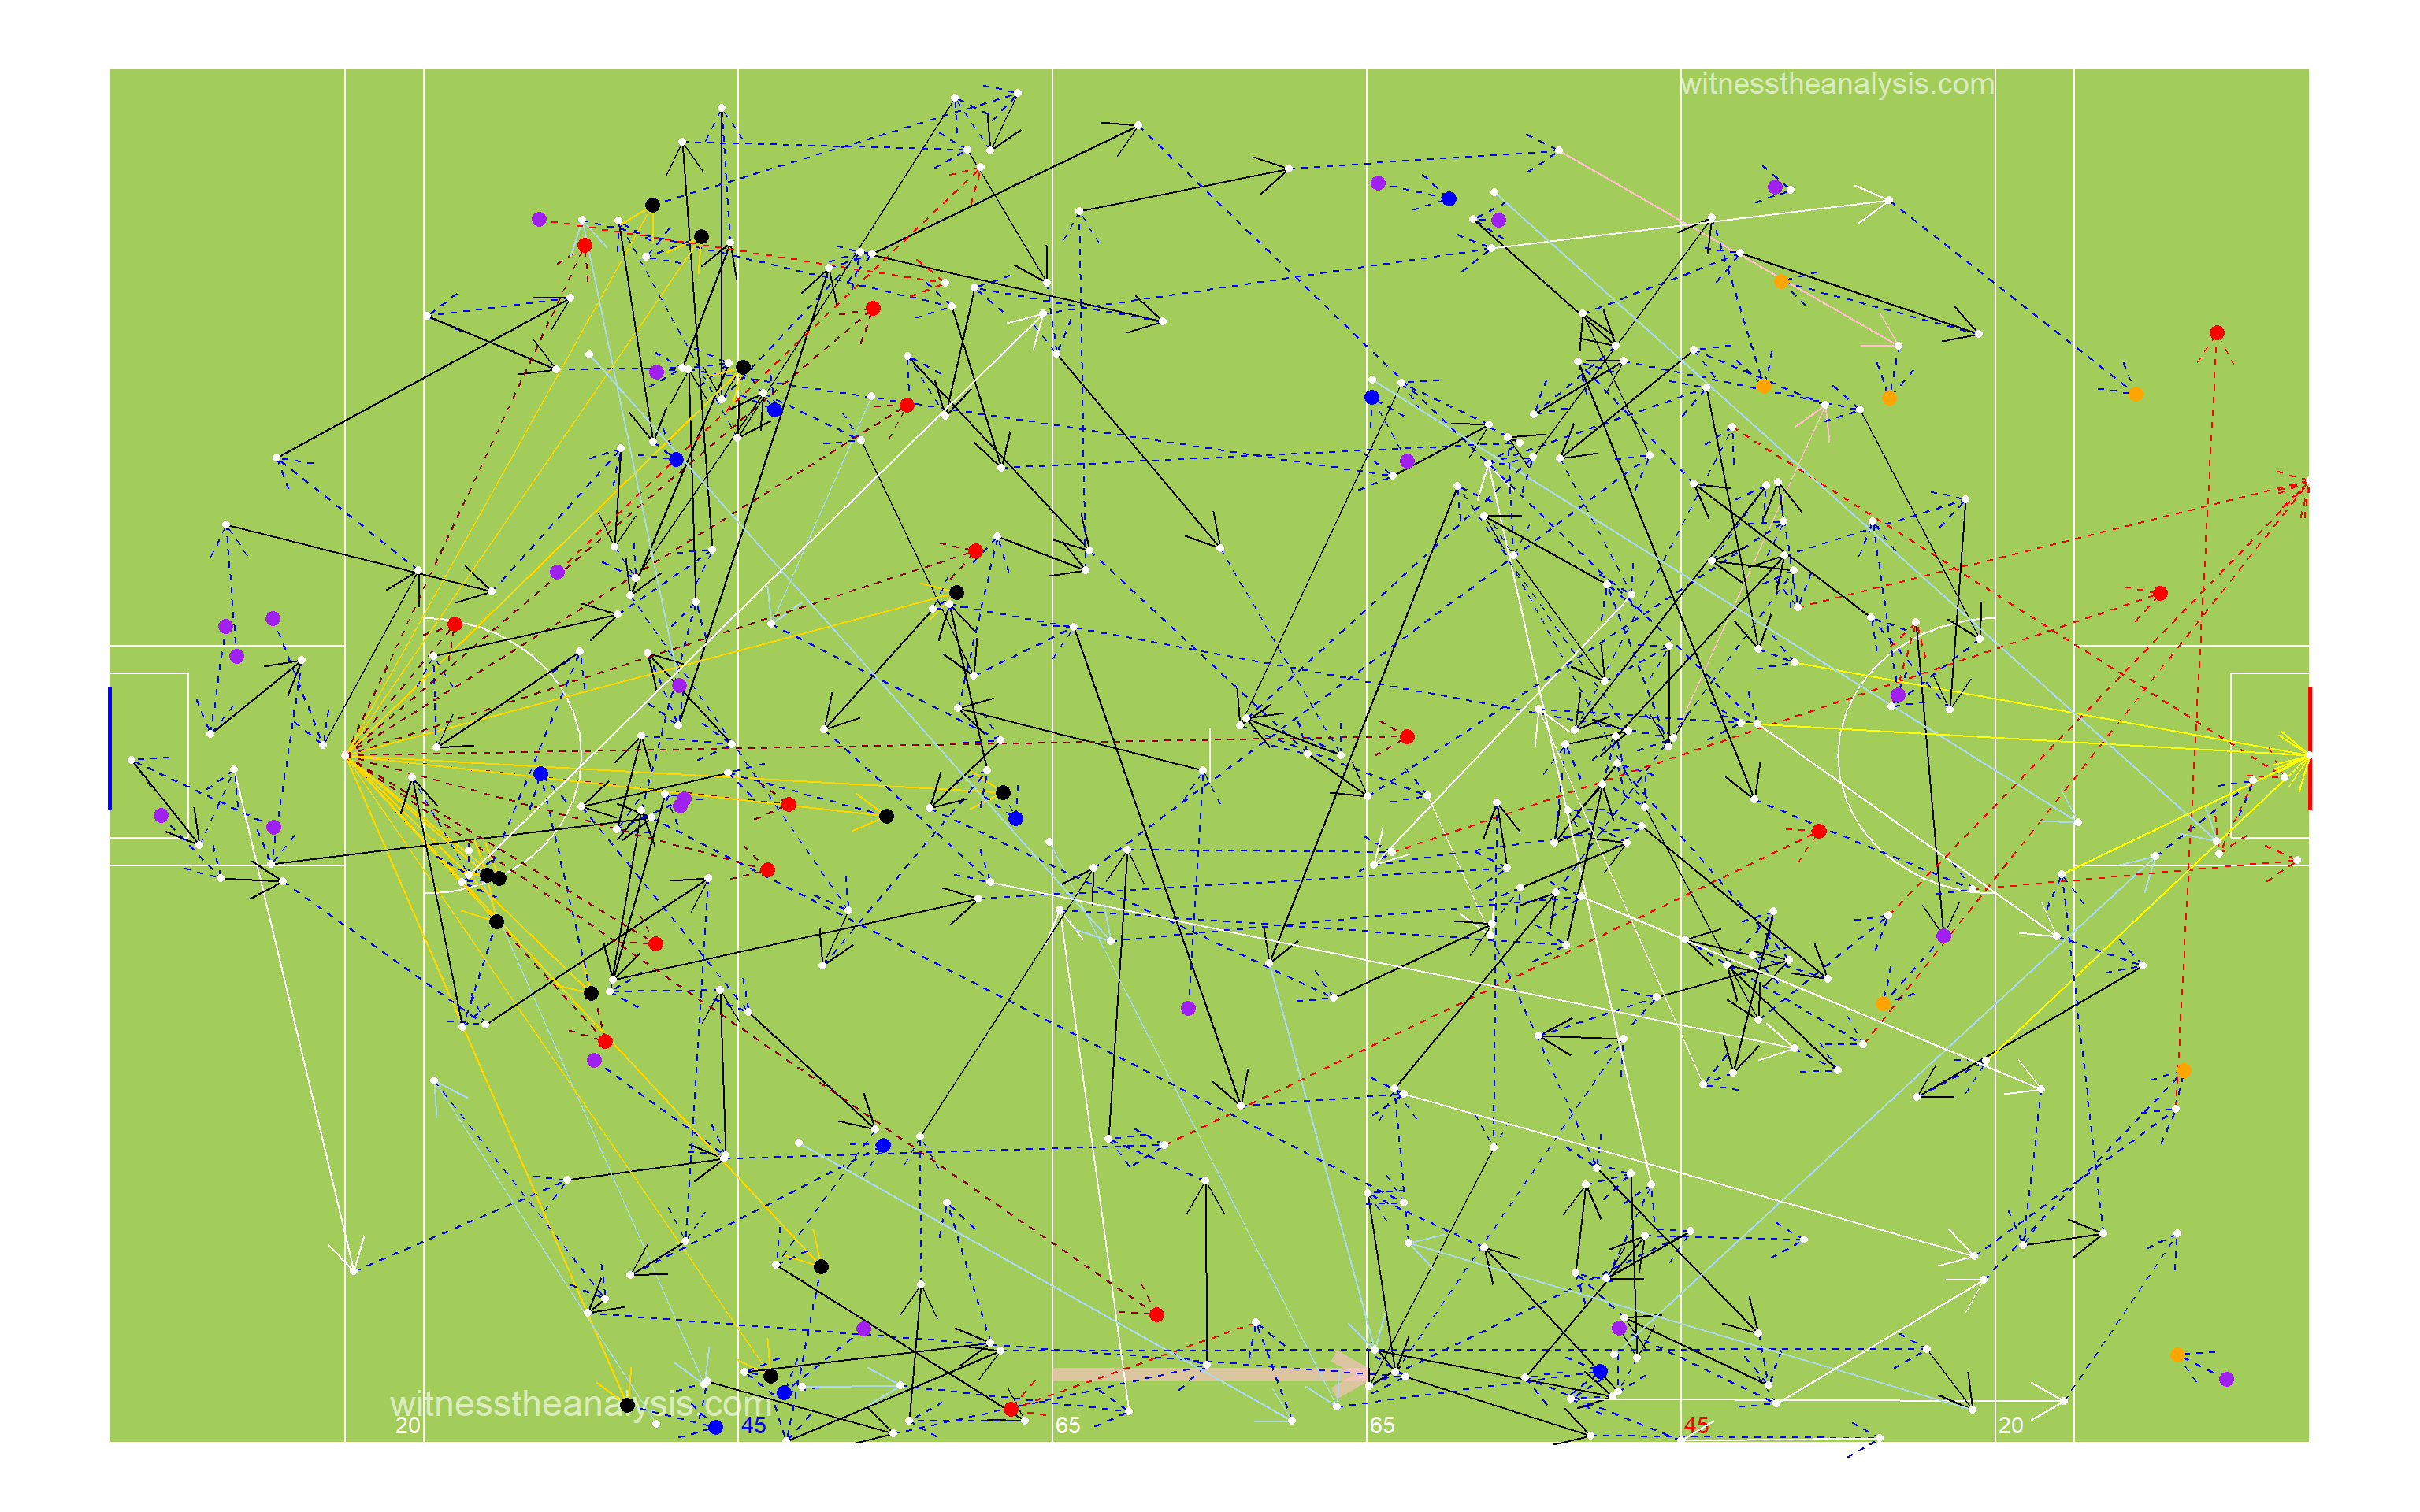
###Pop Starting from Possession Won 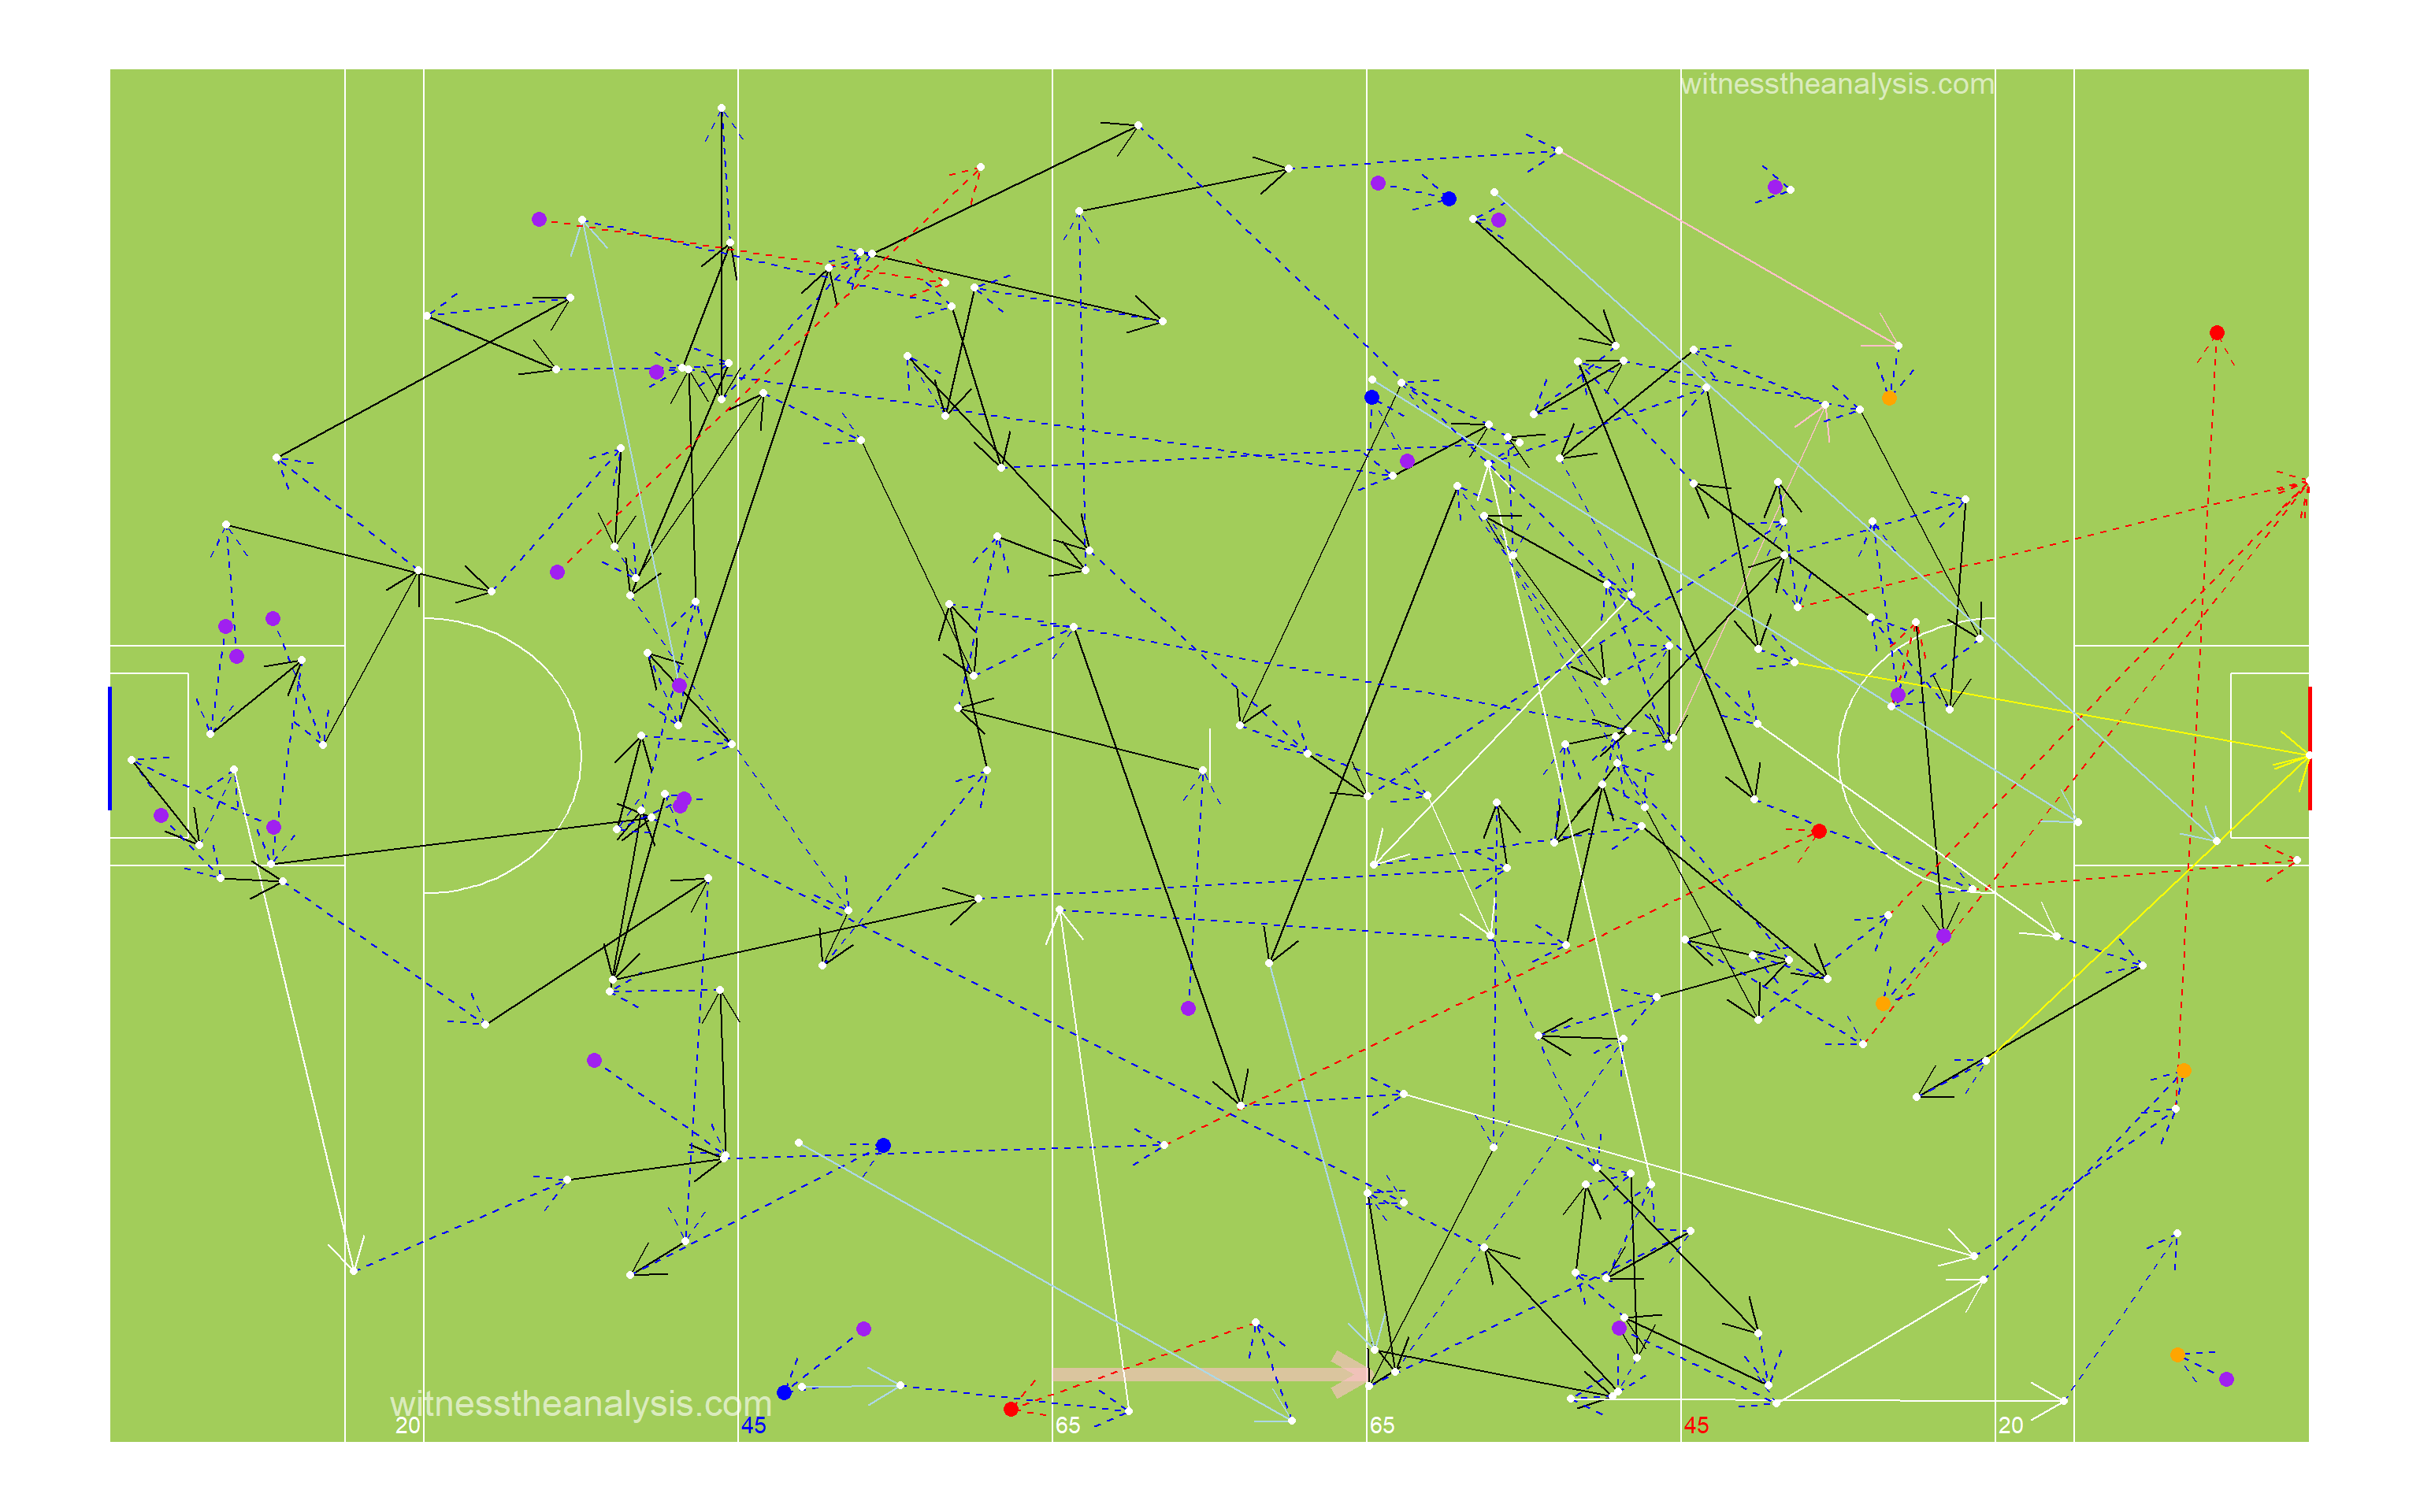
###Pop Starting from Kick Out 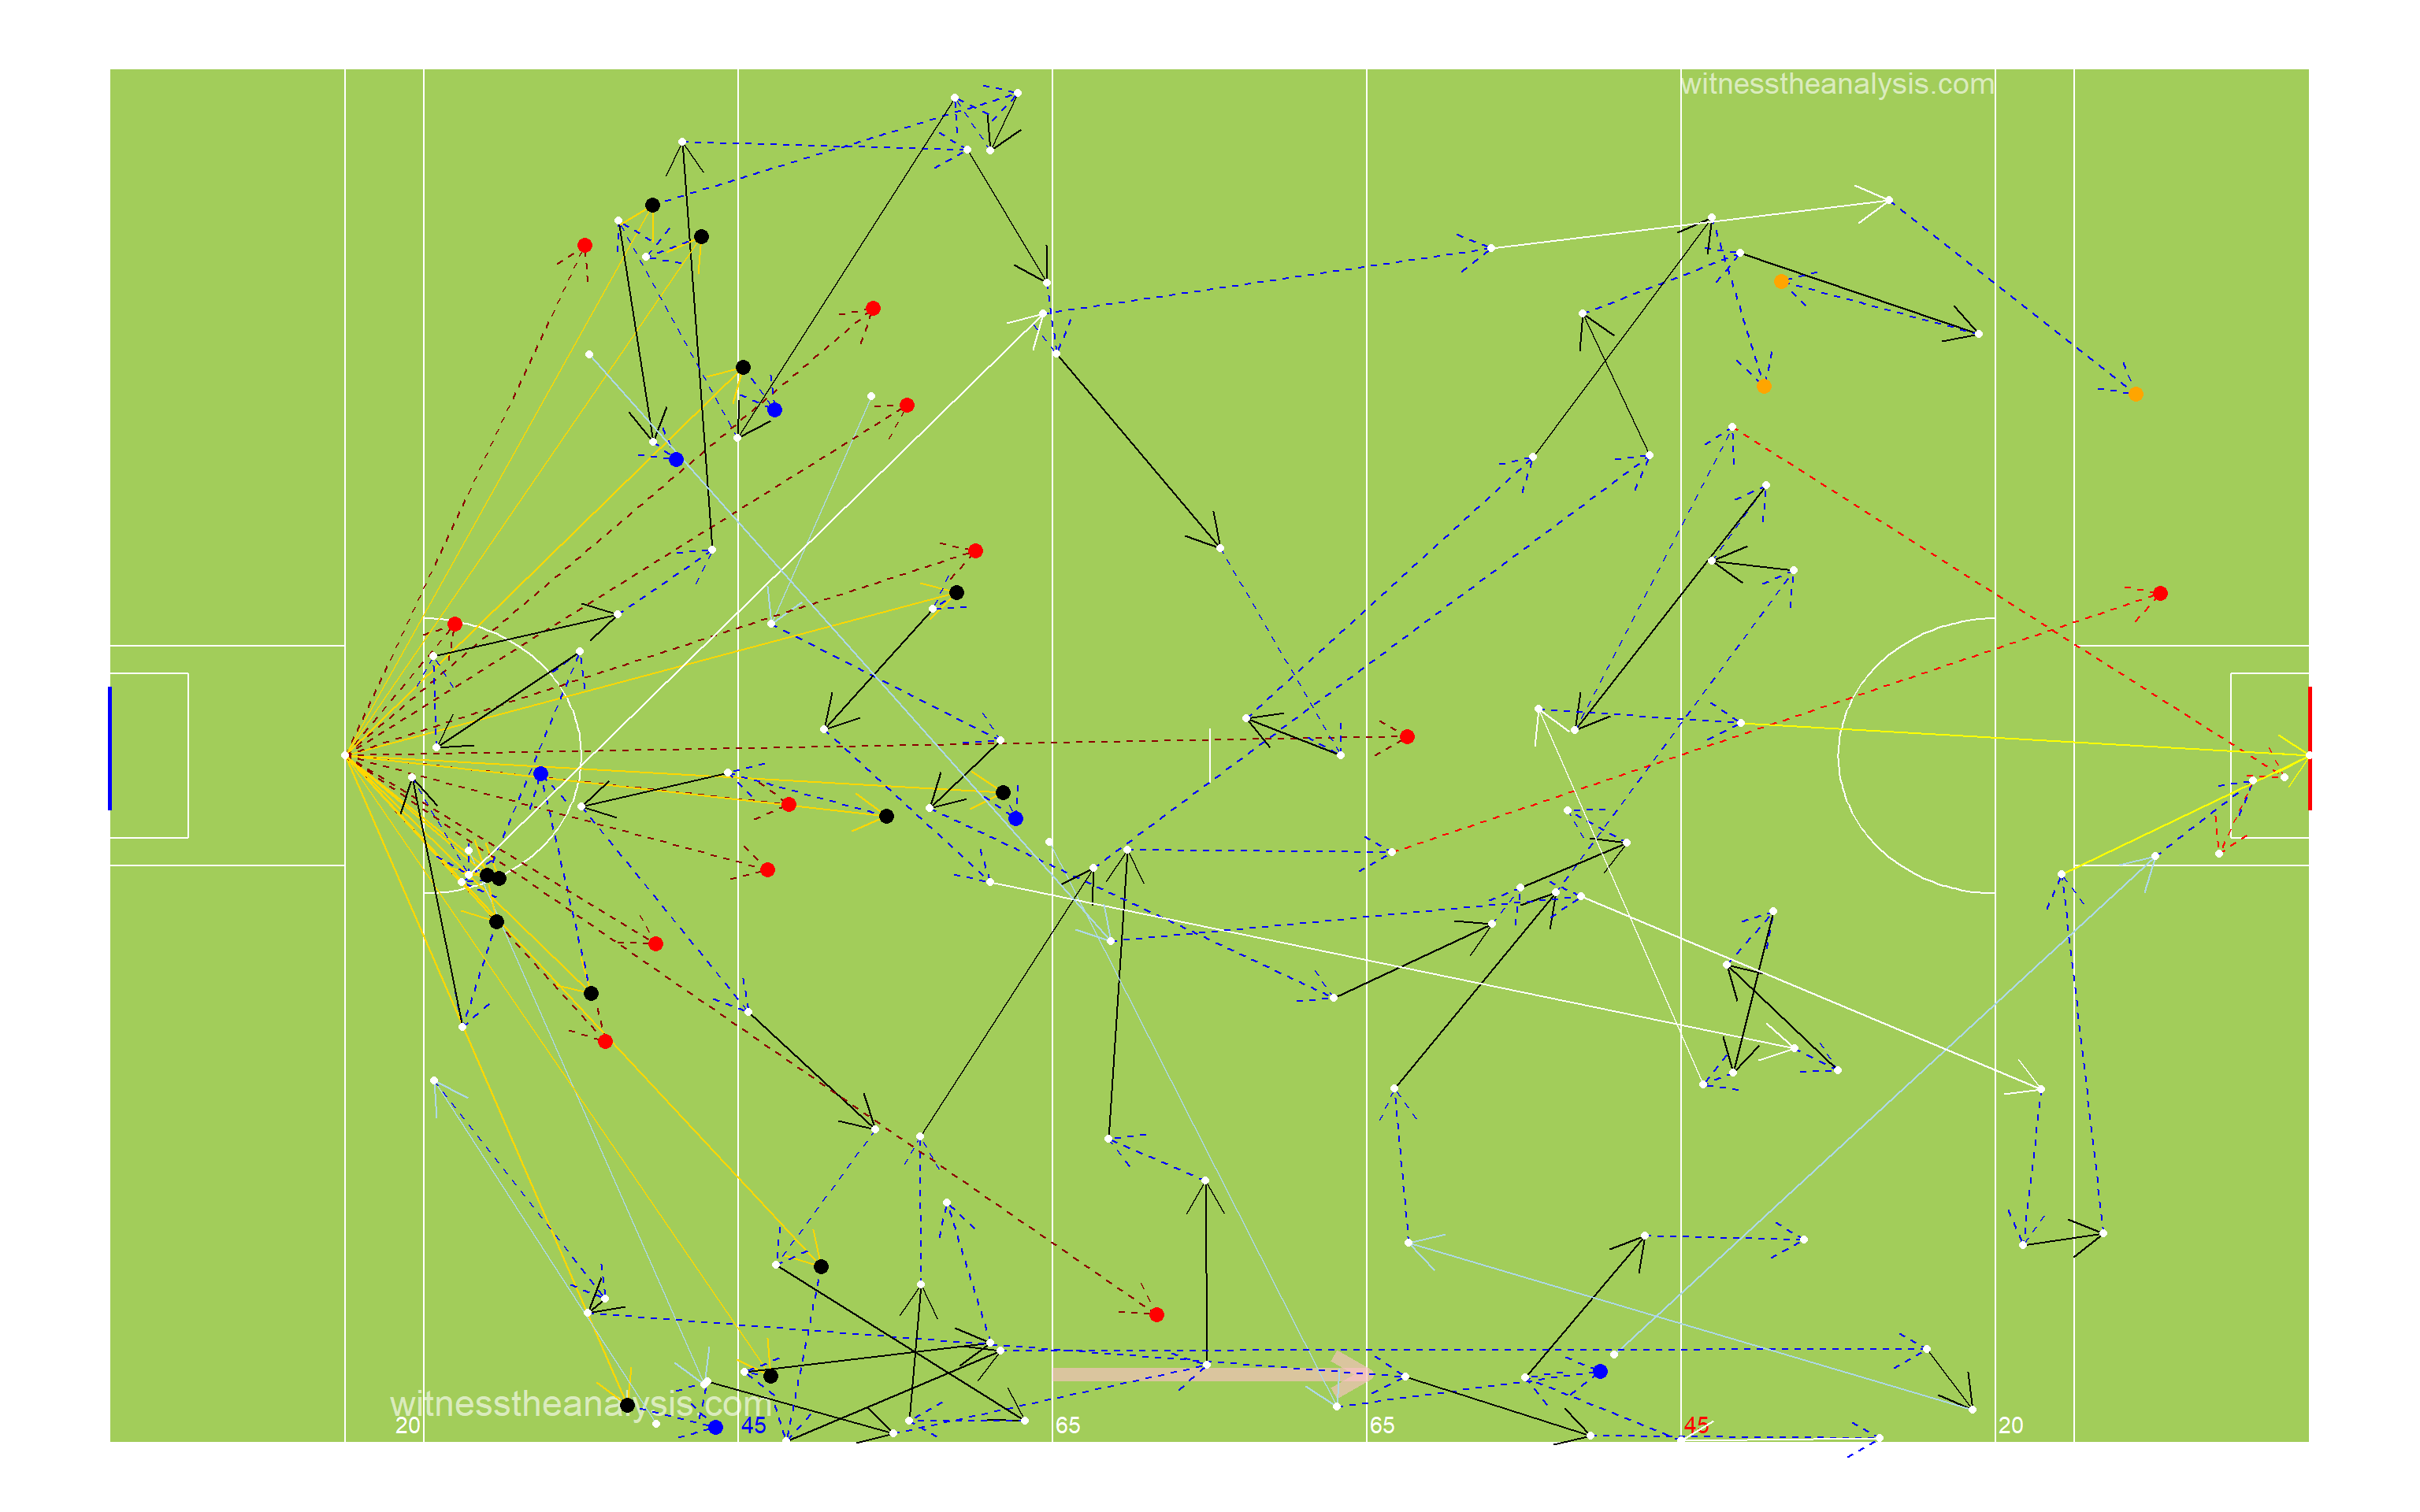
###Thomas Davis - Period 1 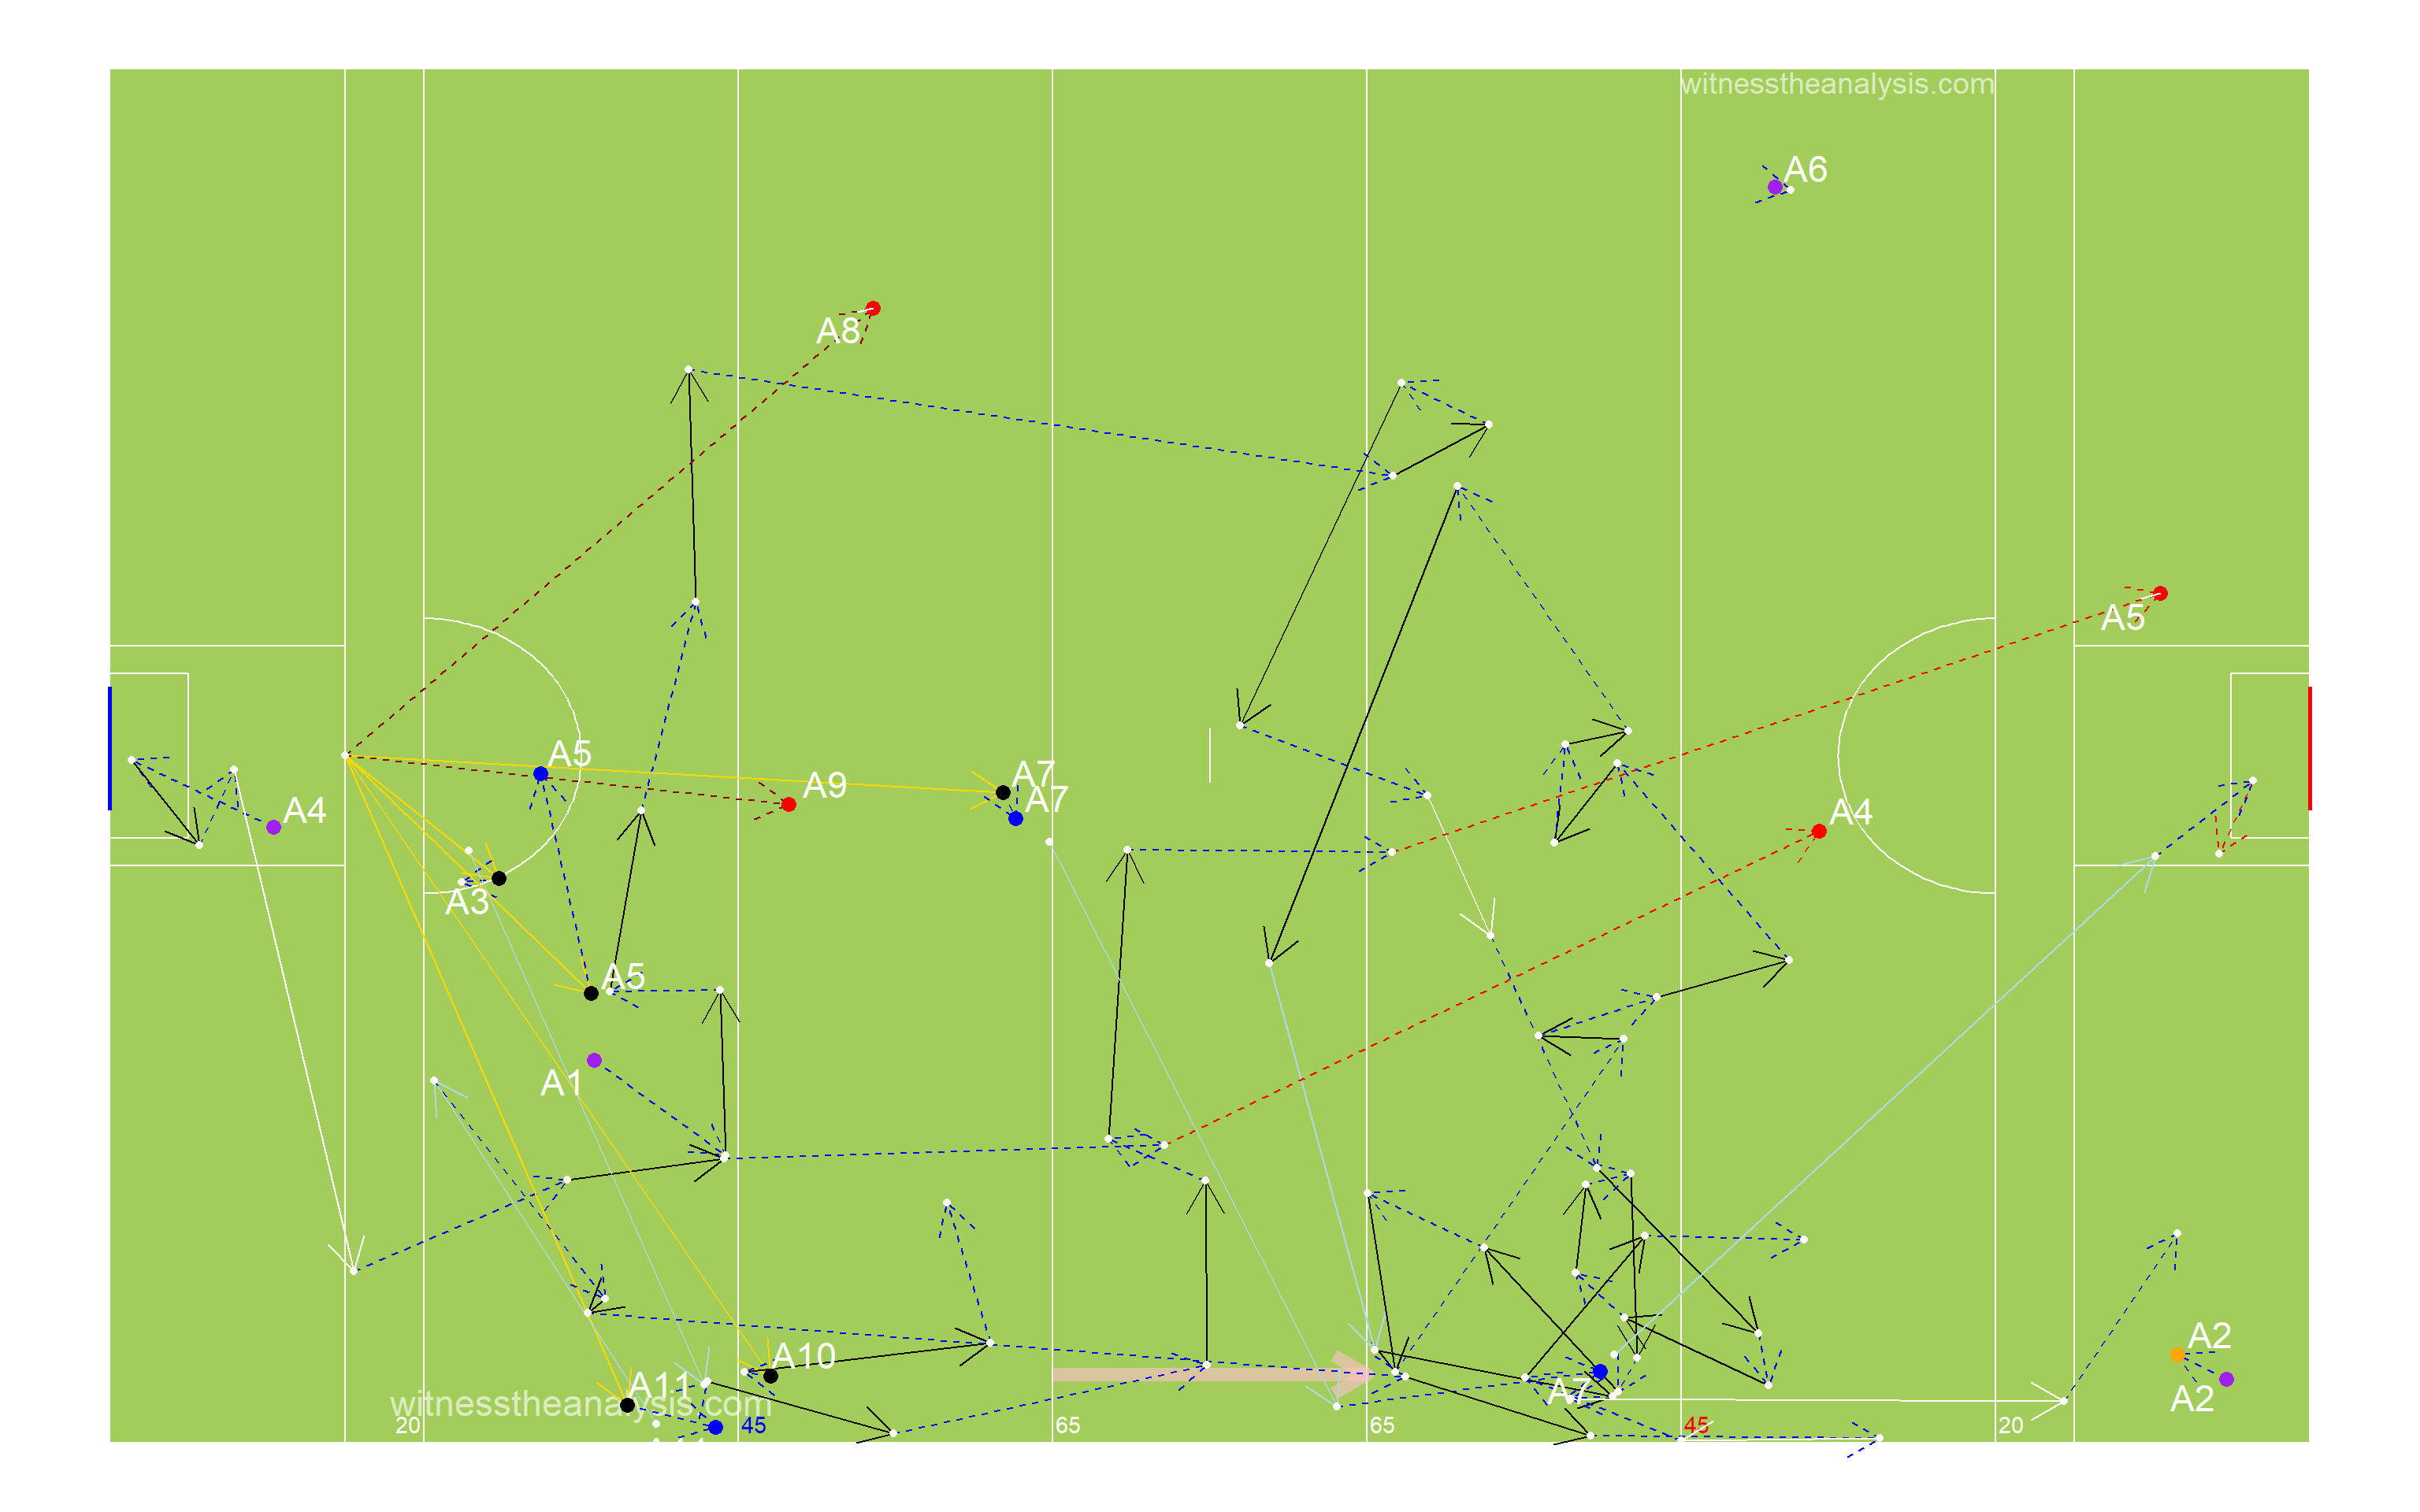
###Thomas Davis - Period 2 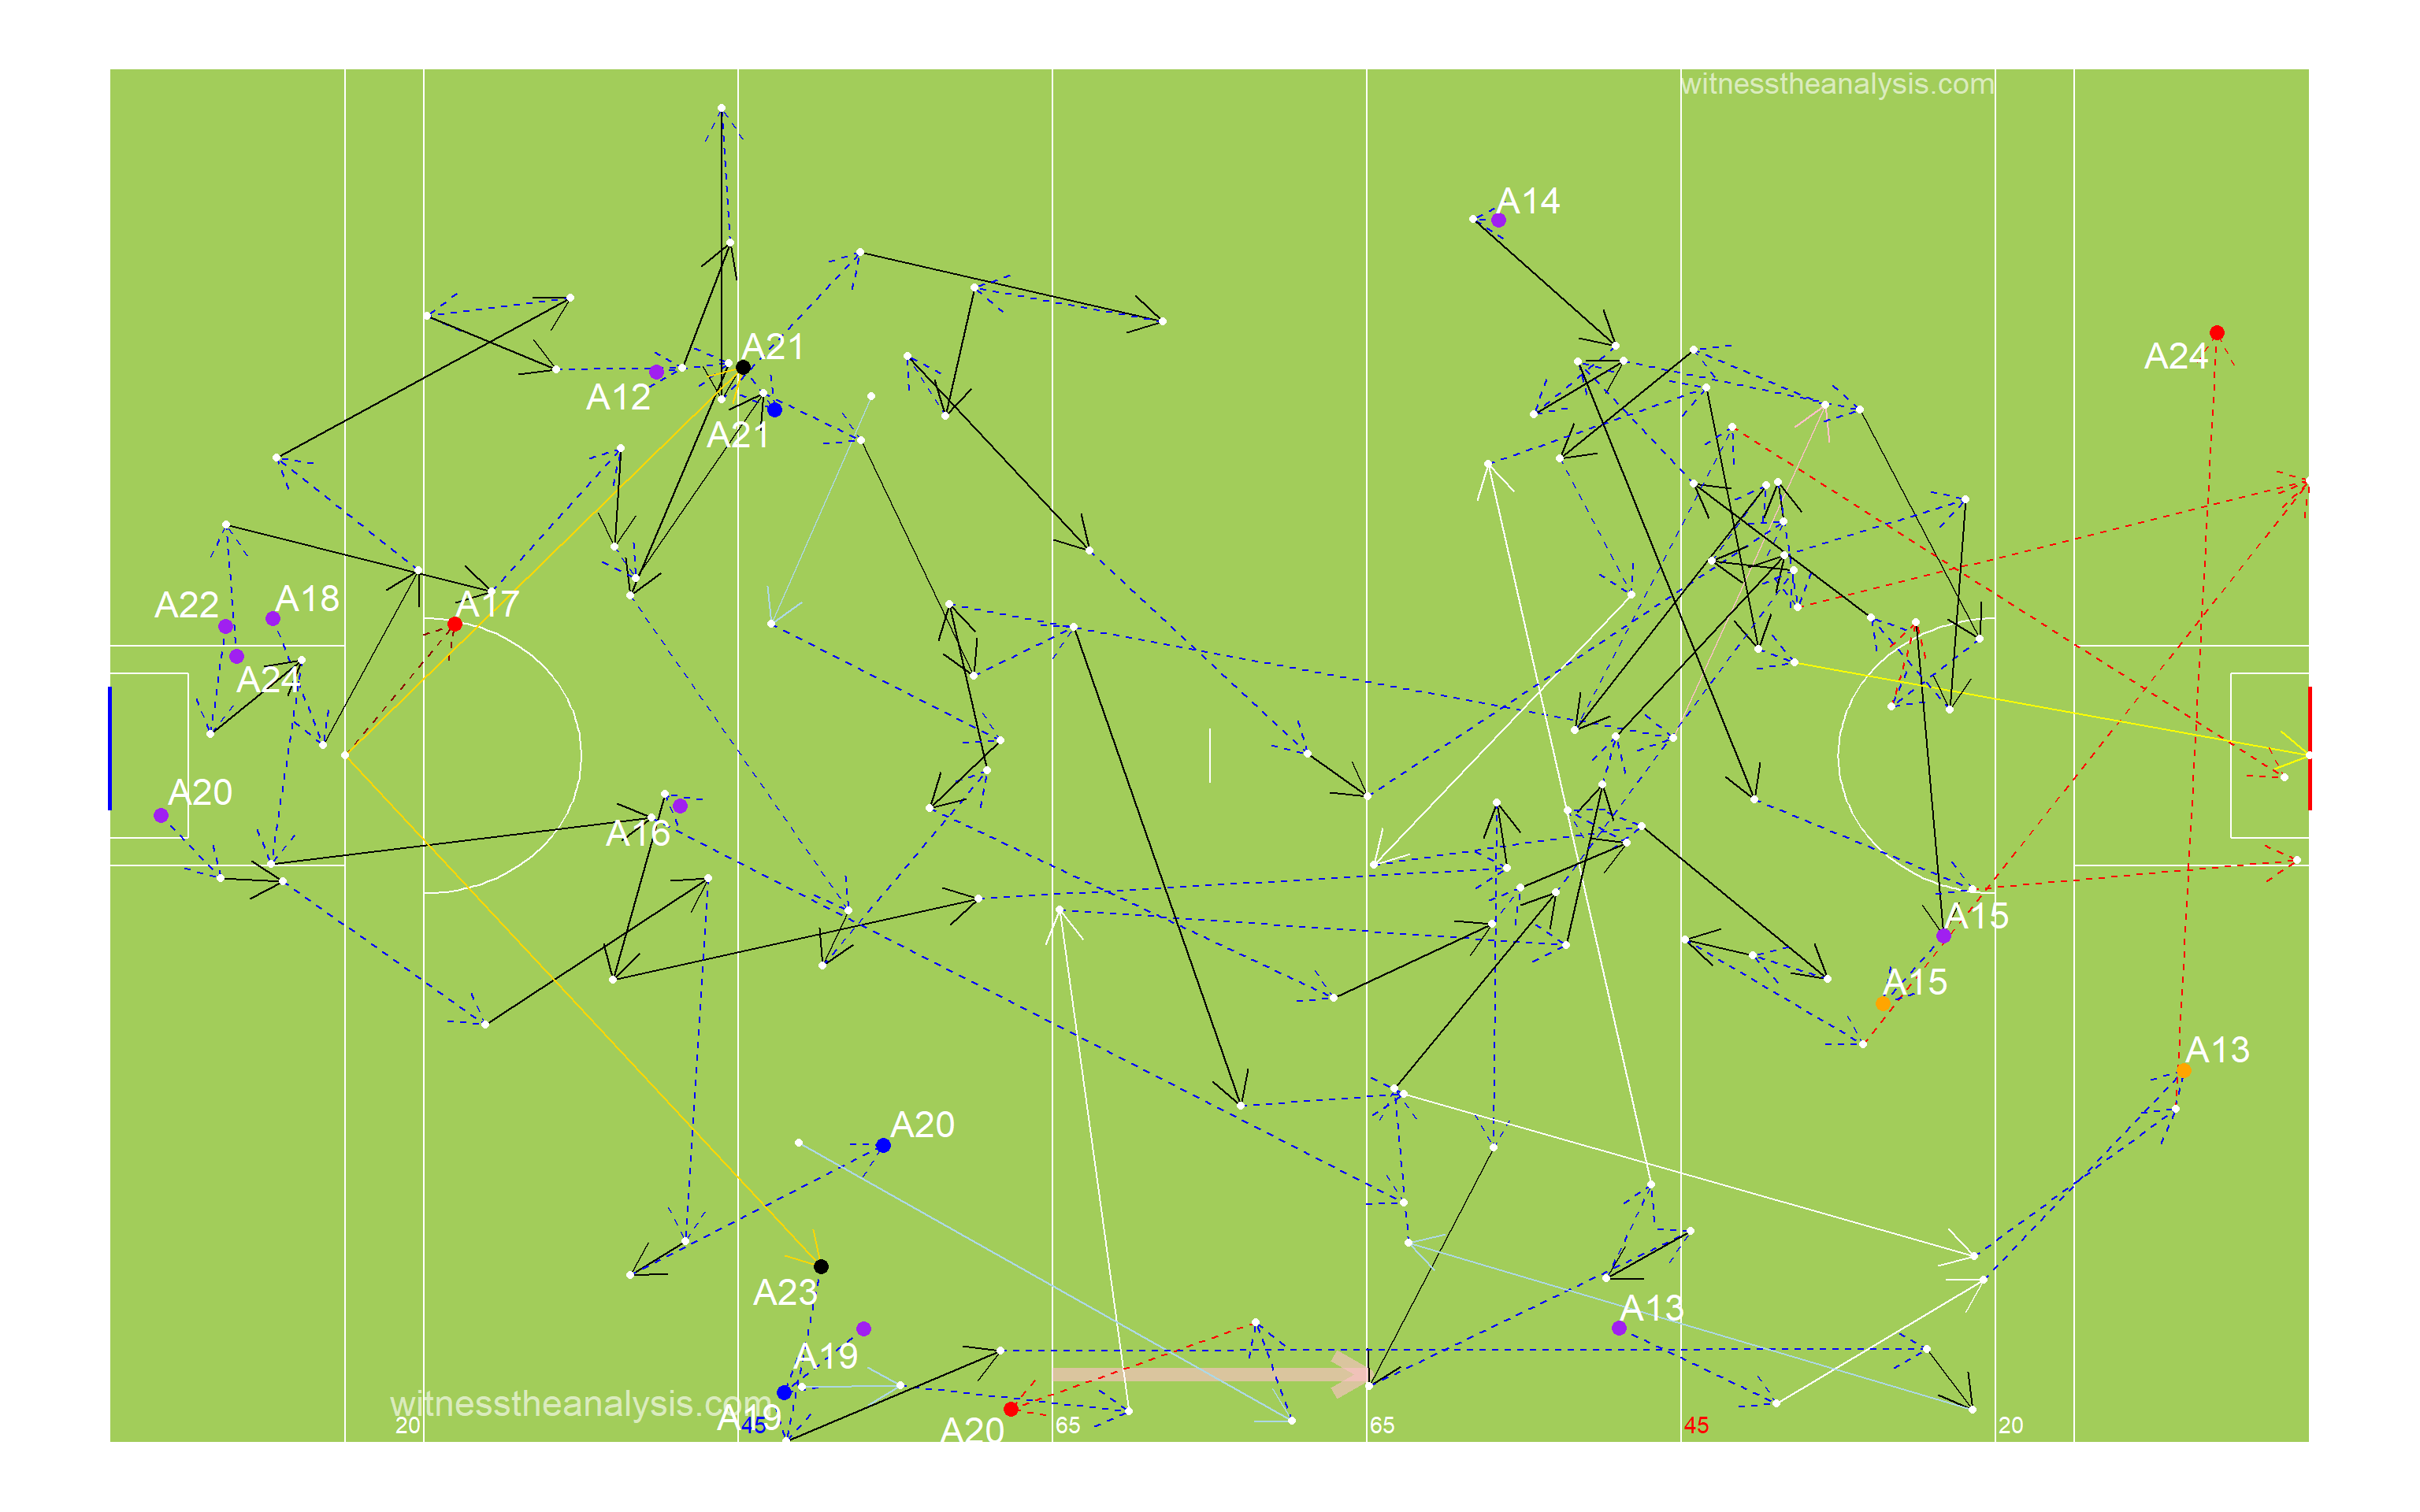
###Thomas Davis - Period 3 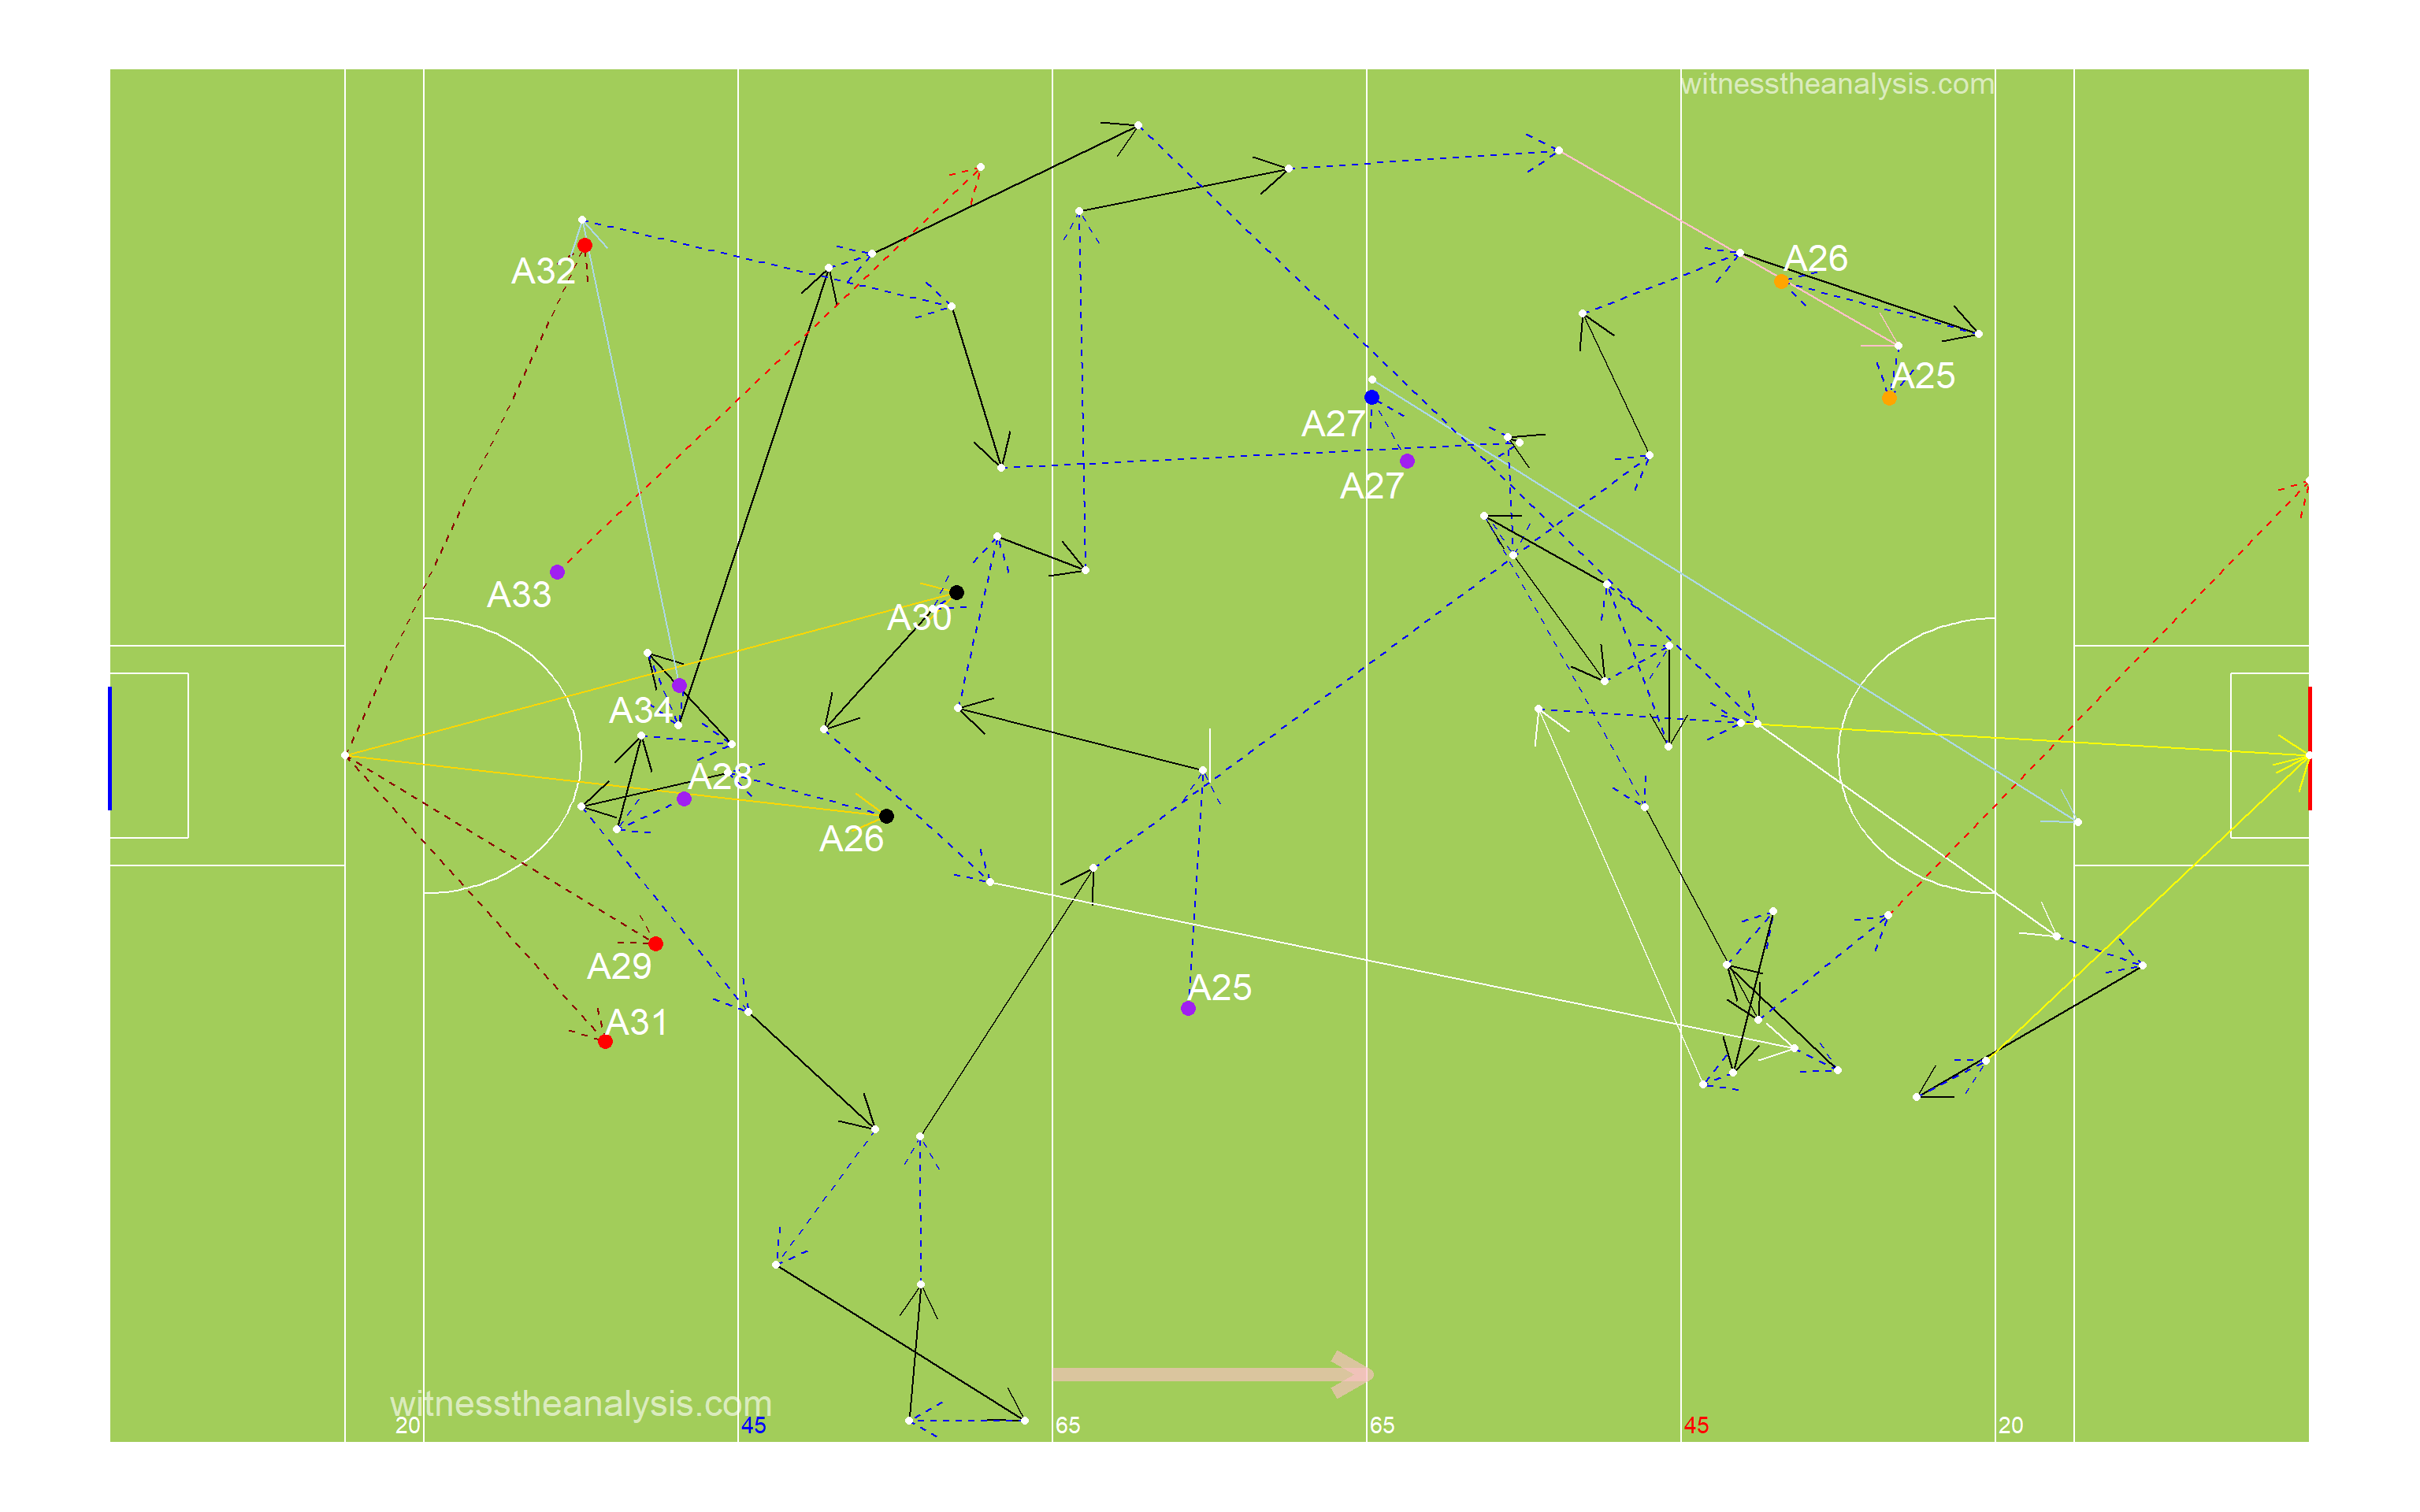
###Thomas Davis - Period 4 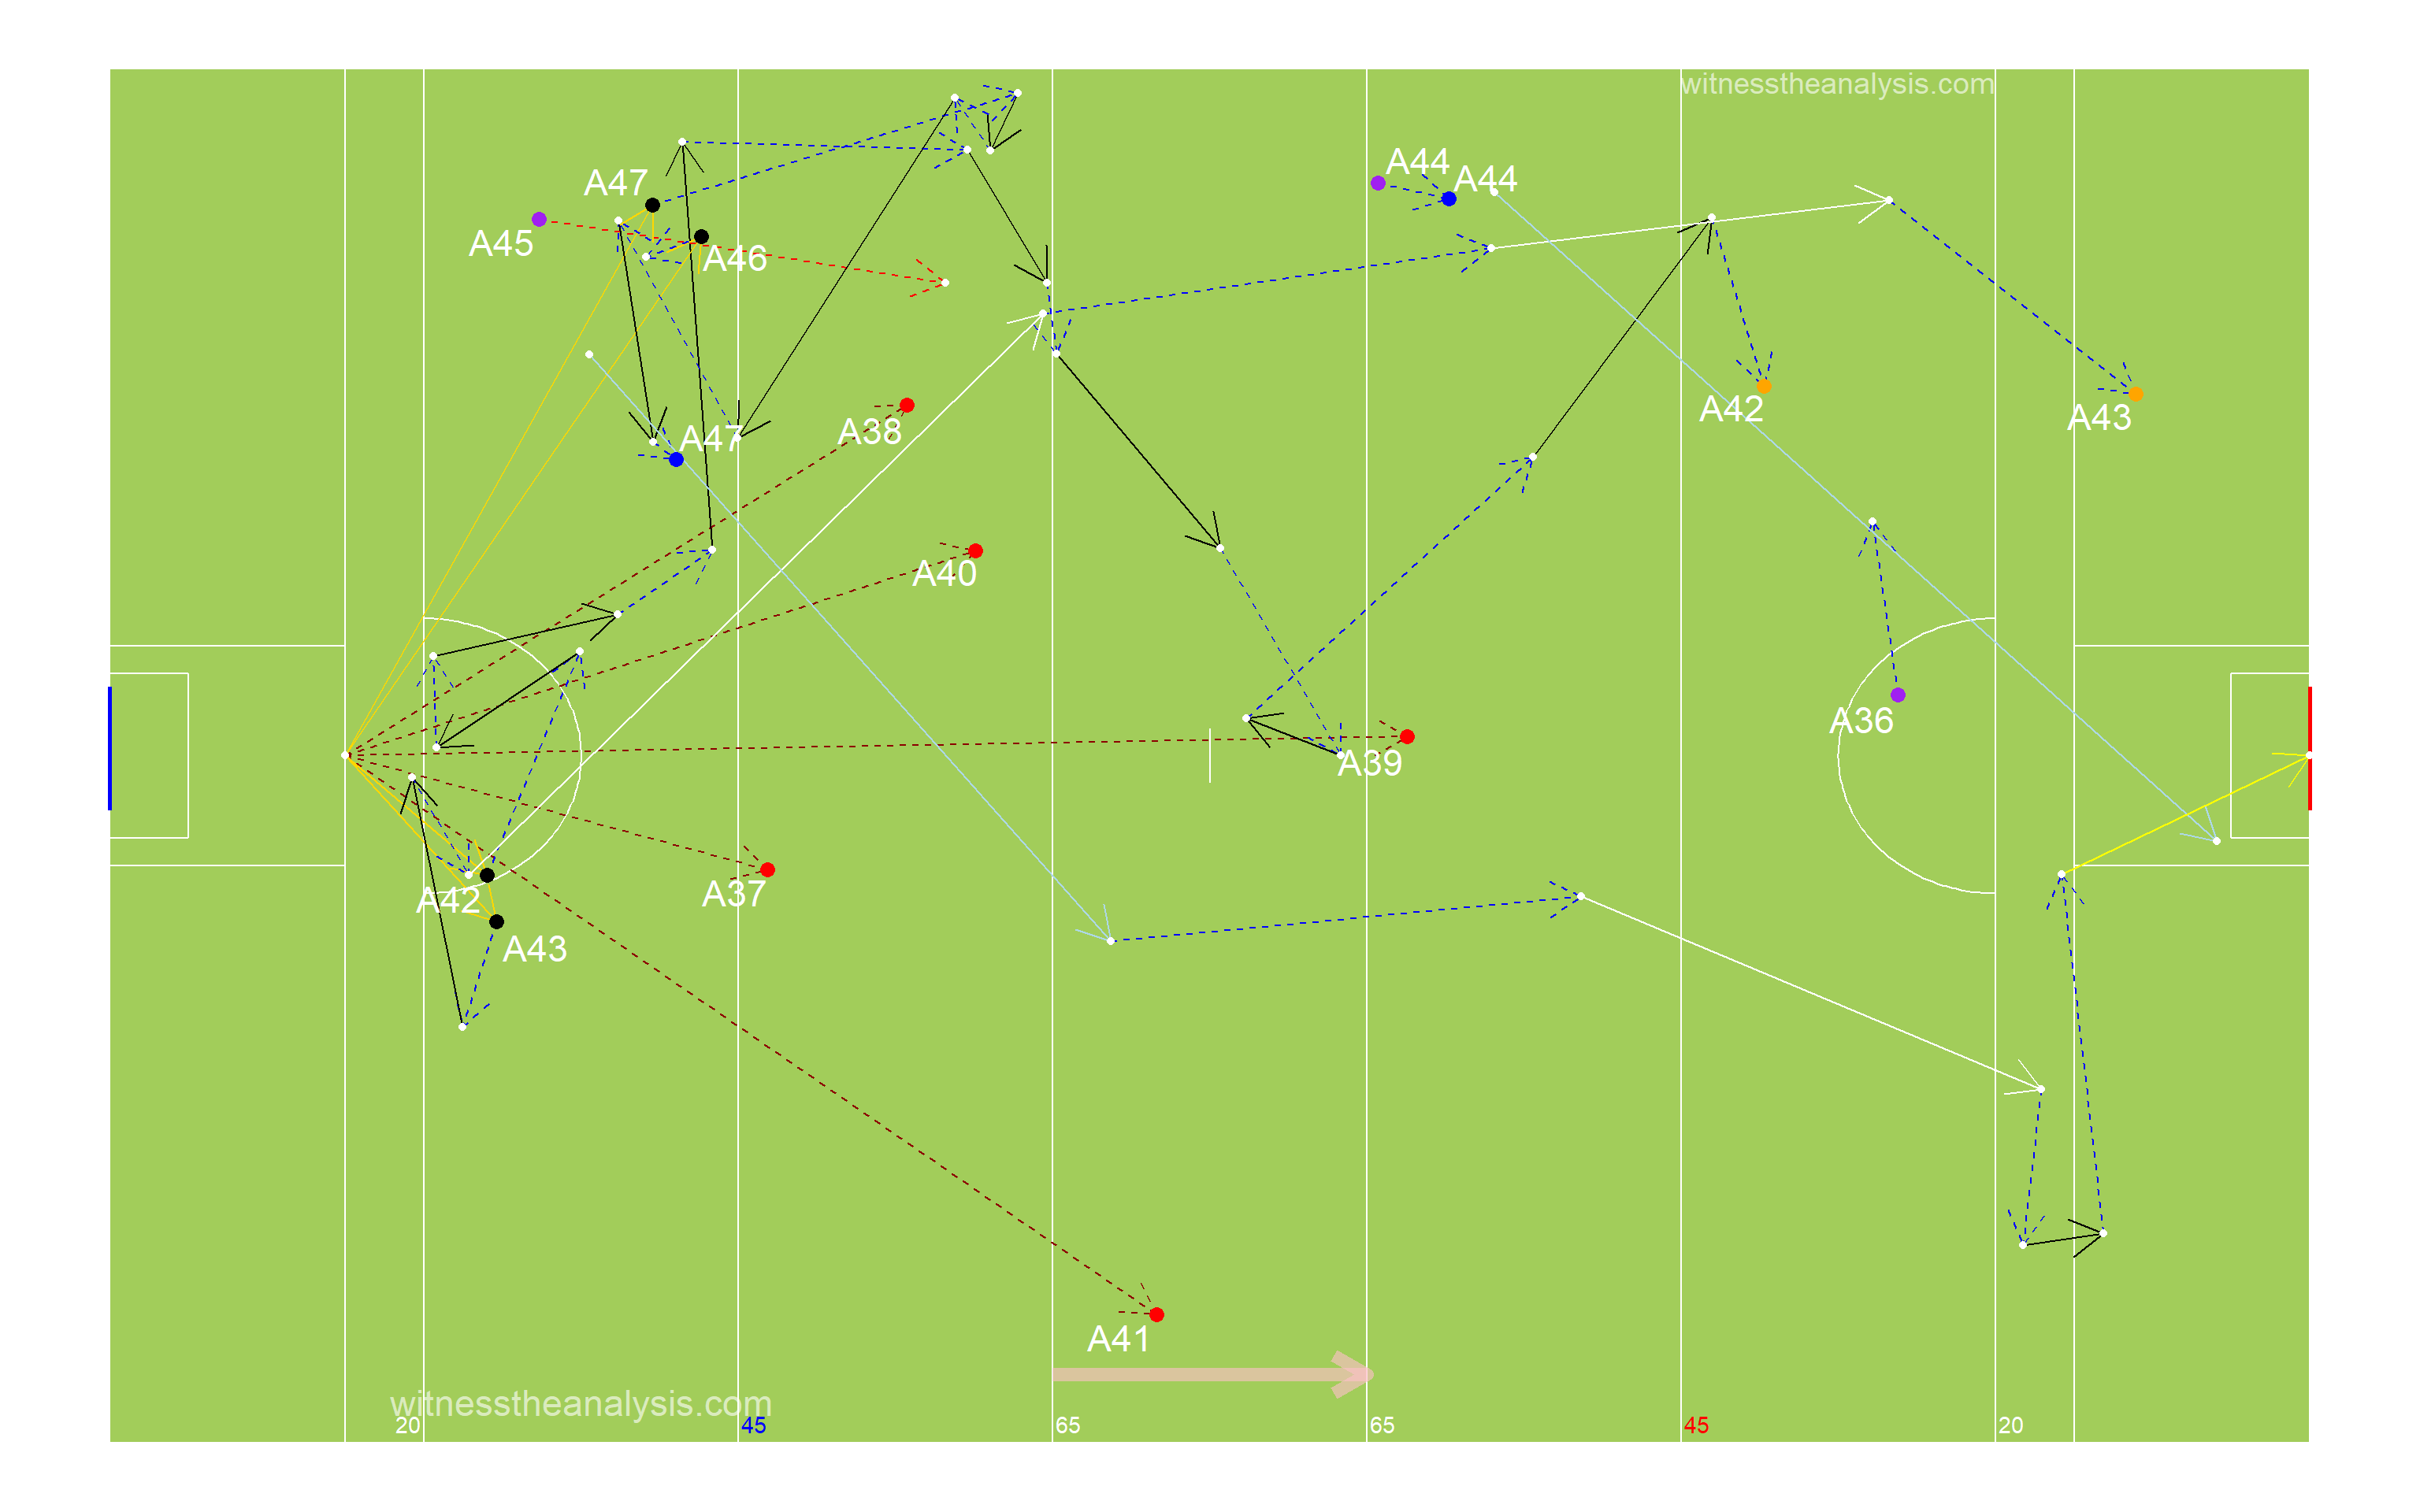
###Ballyboden - Game 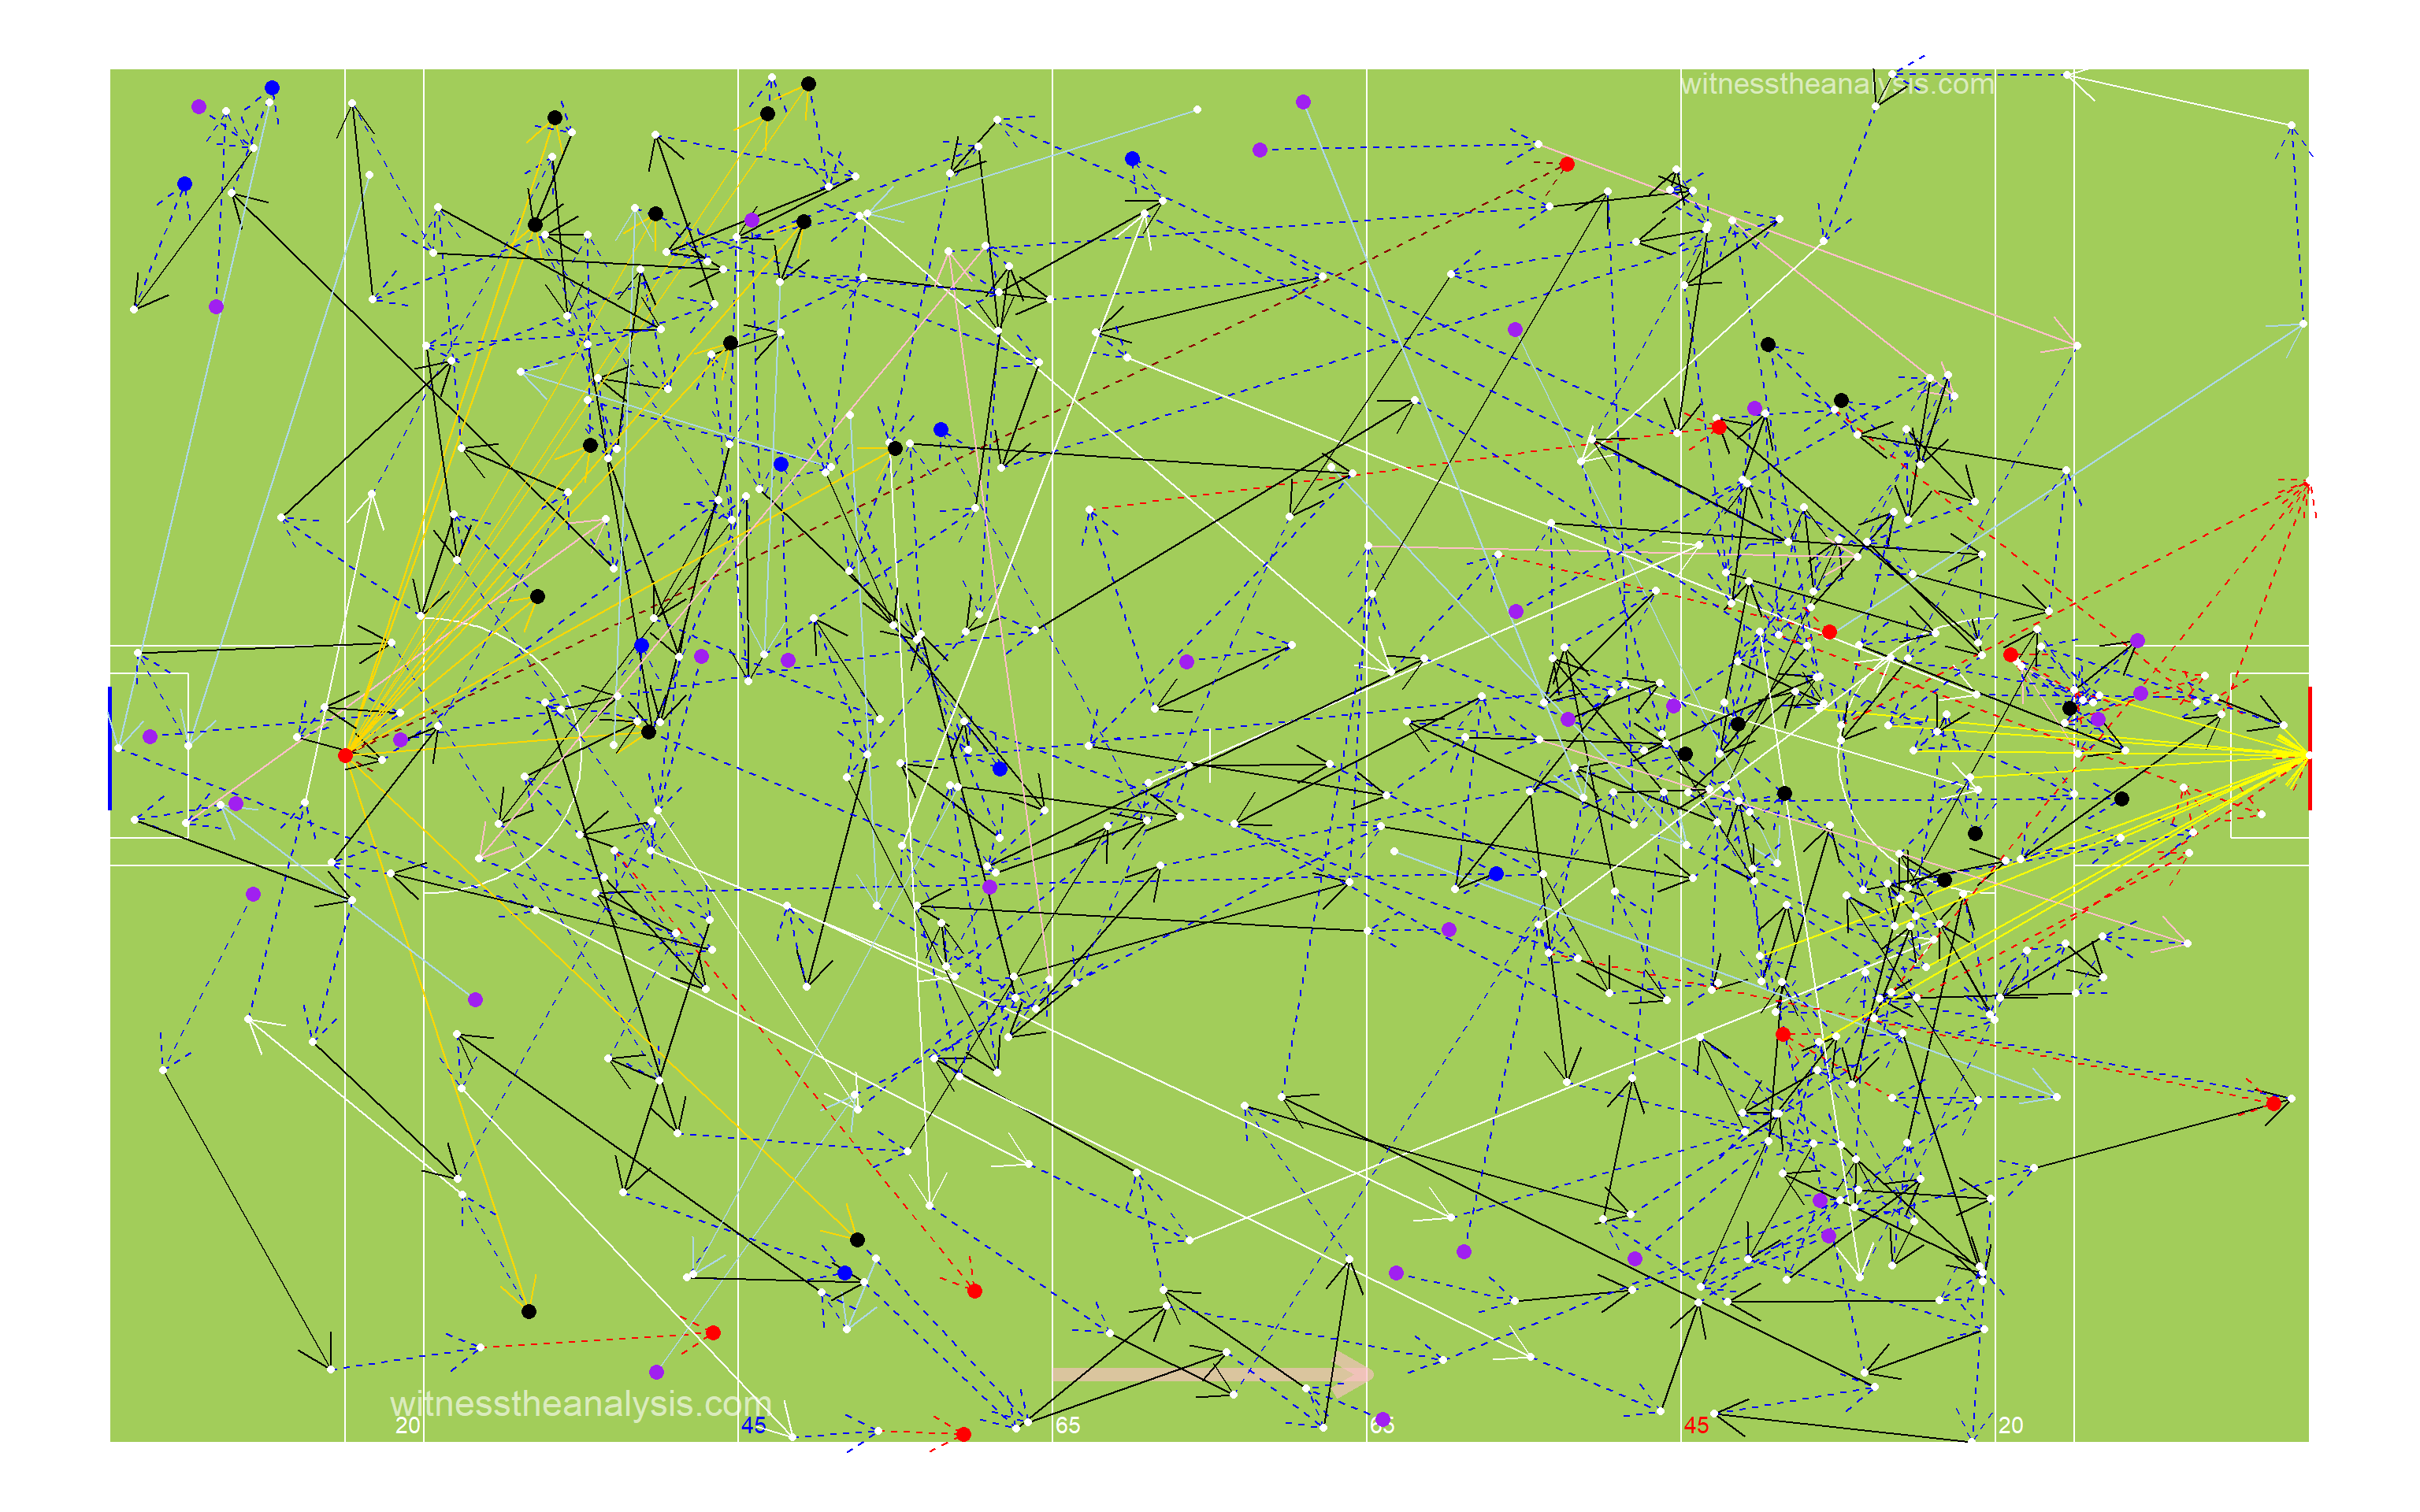
###Pop Starting from Possession Won
###Pop Starting from Kick Out
###Ballyboden Period - 1 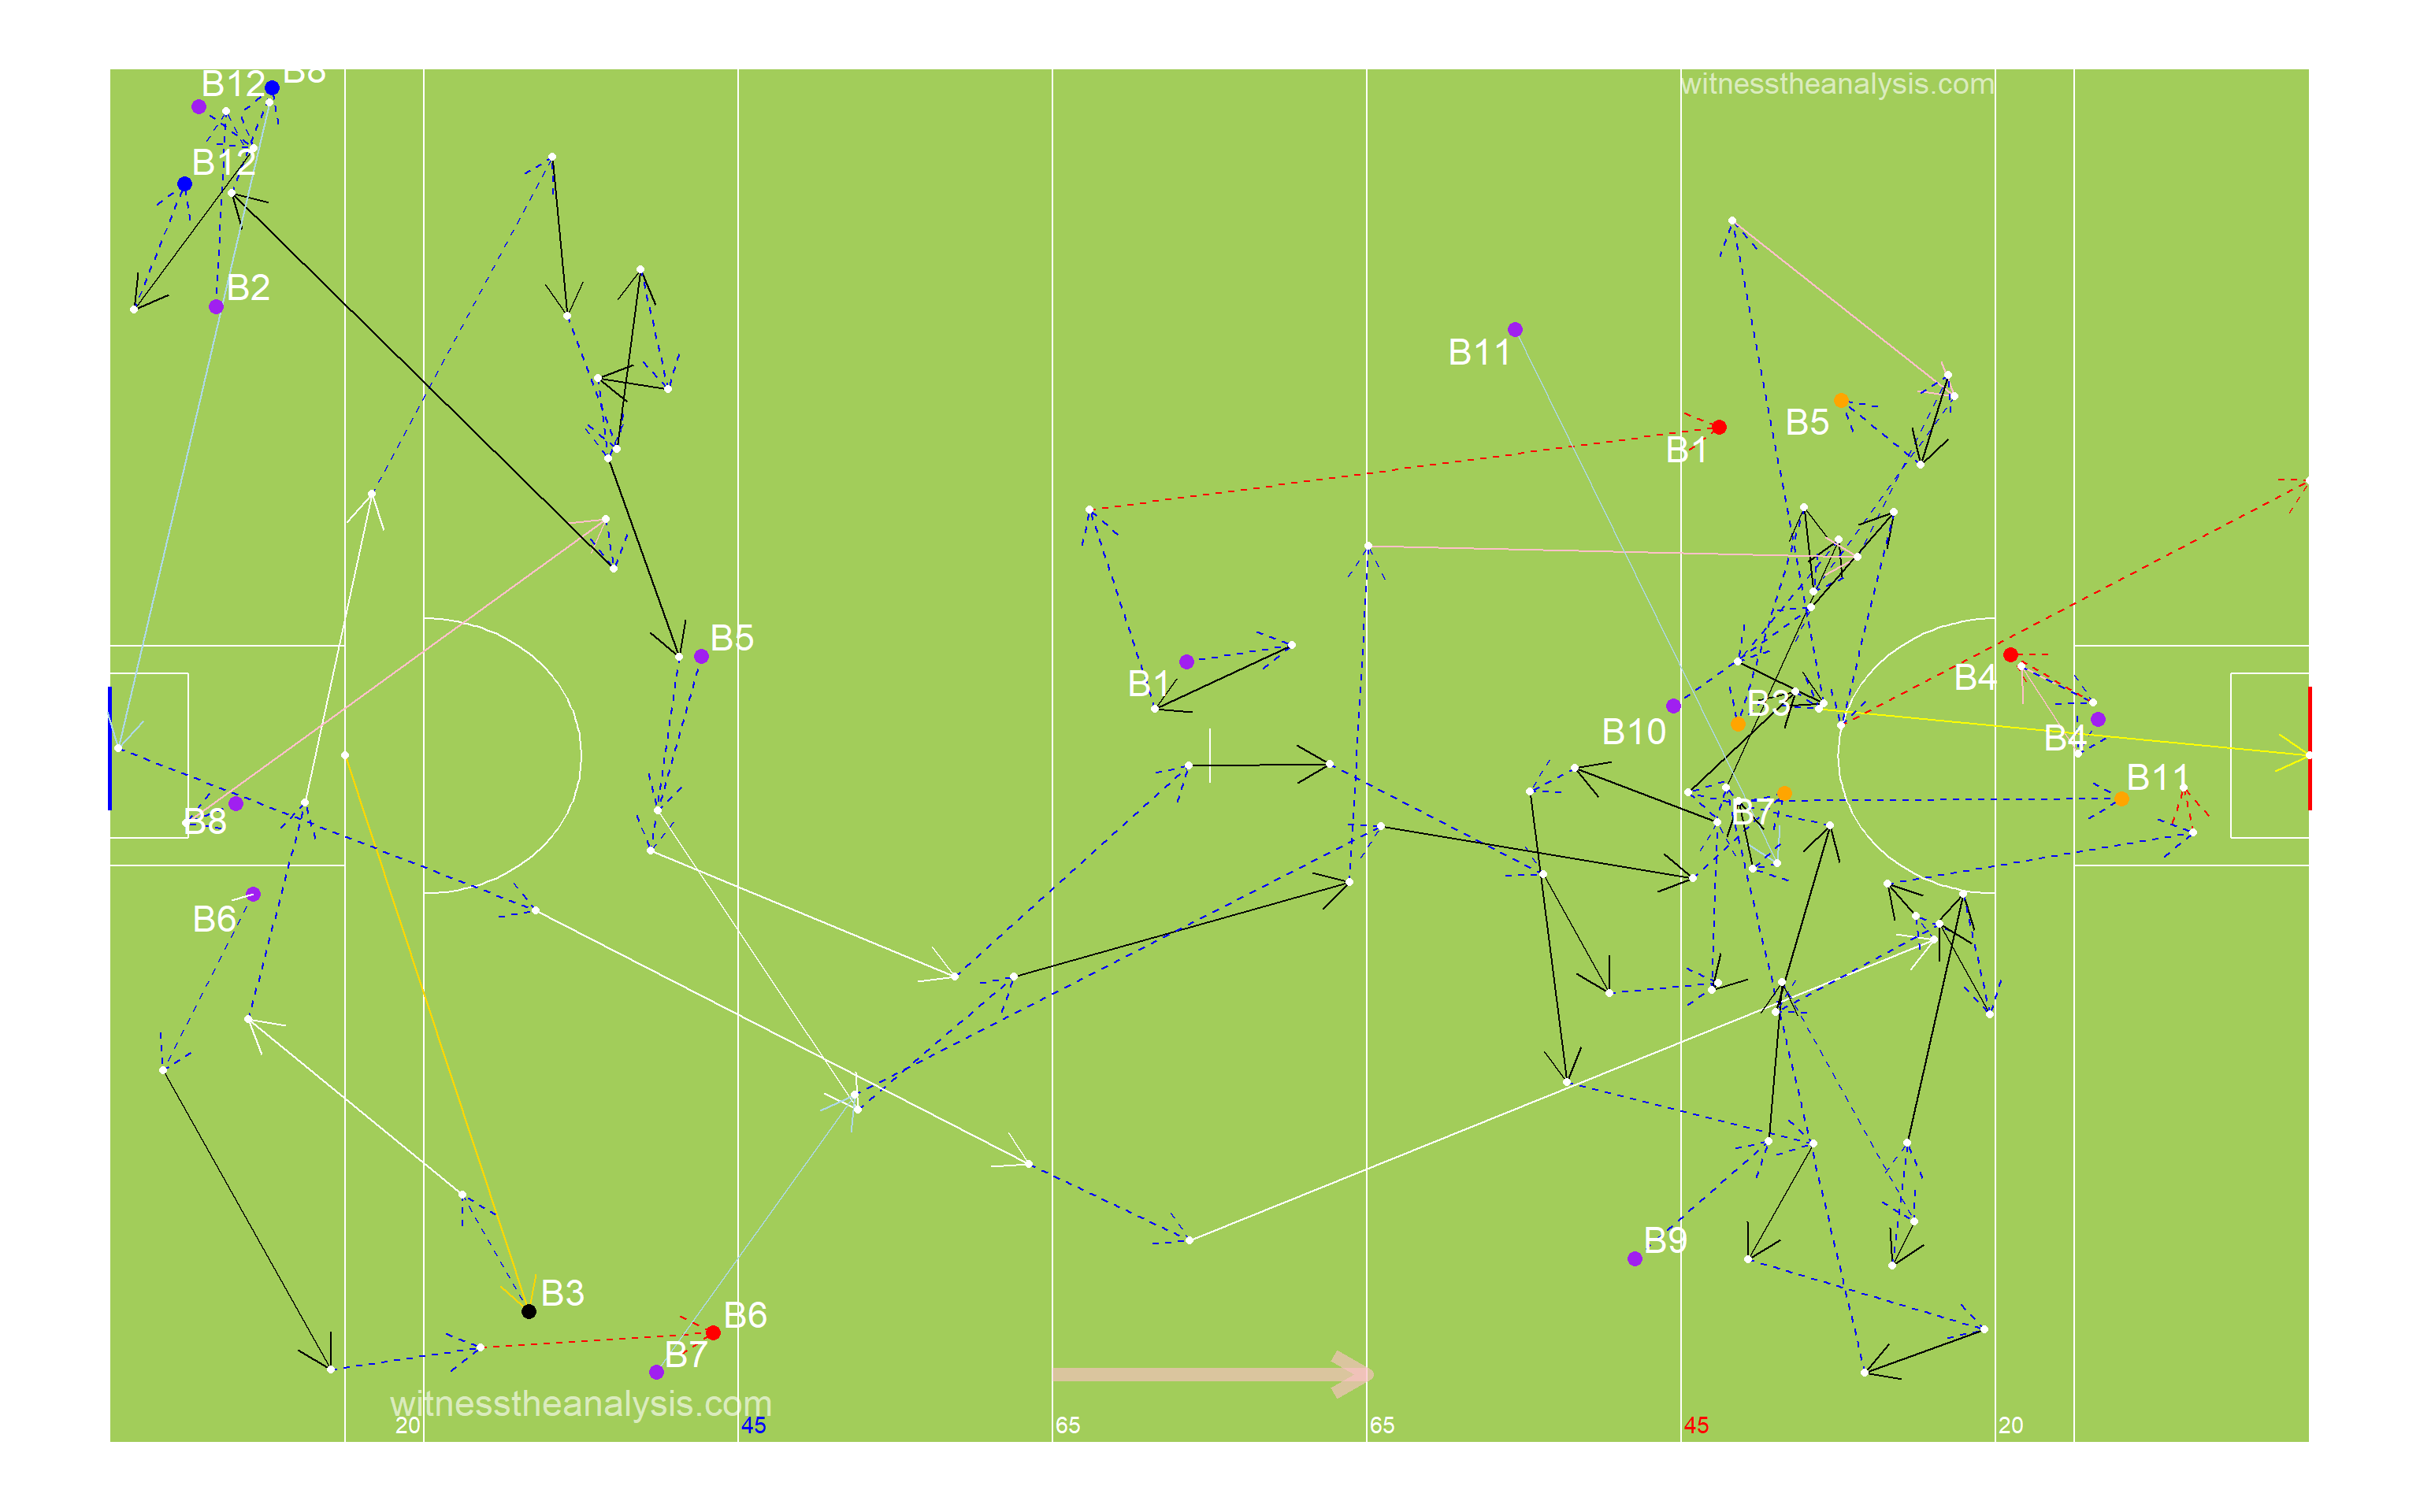
###Ballyboden Period - 2 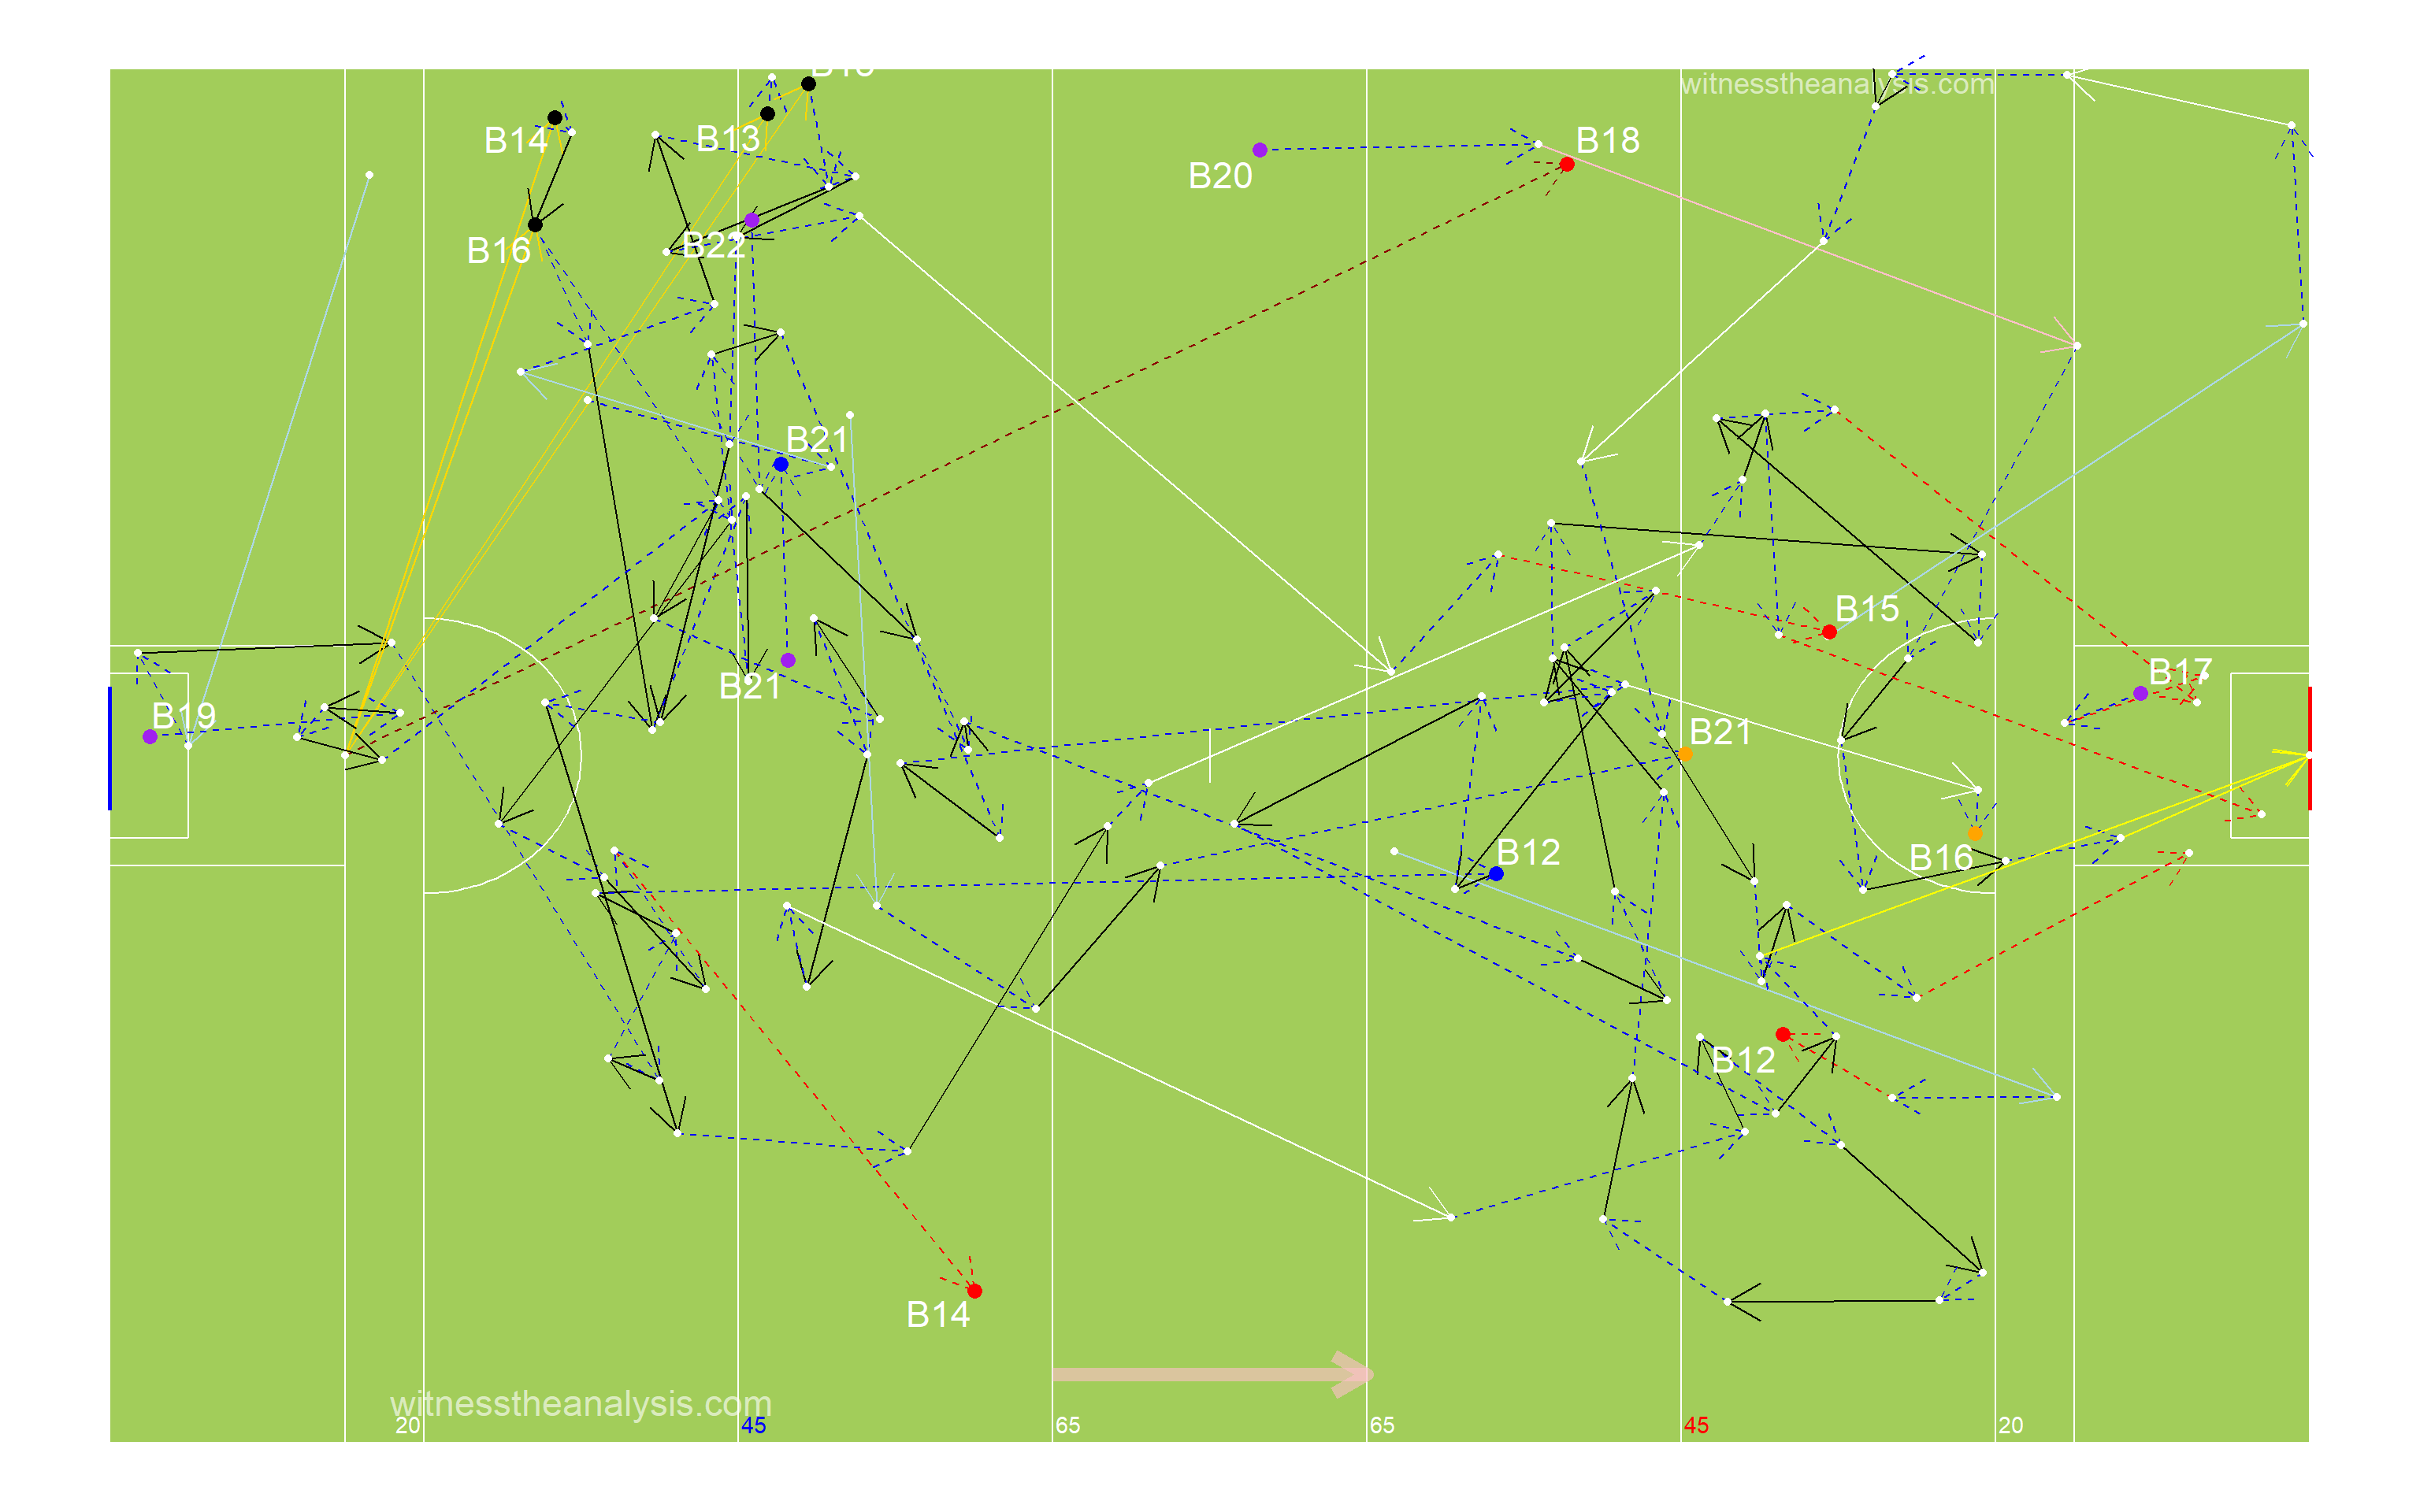
###Ballyboden Period - 3 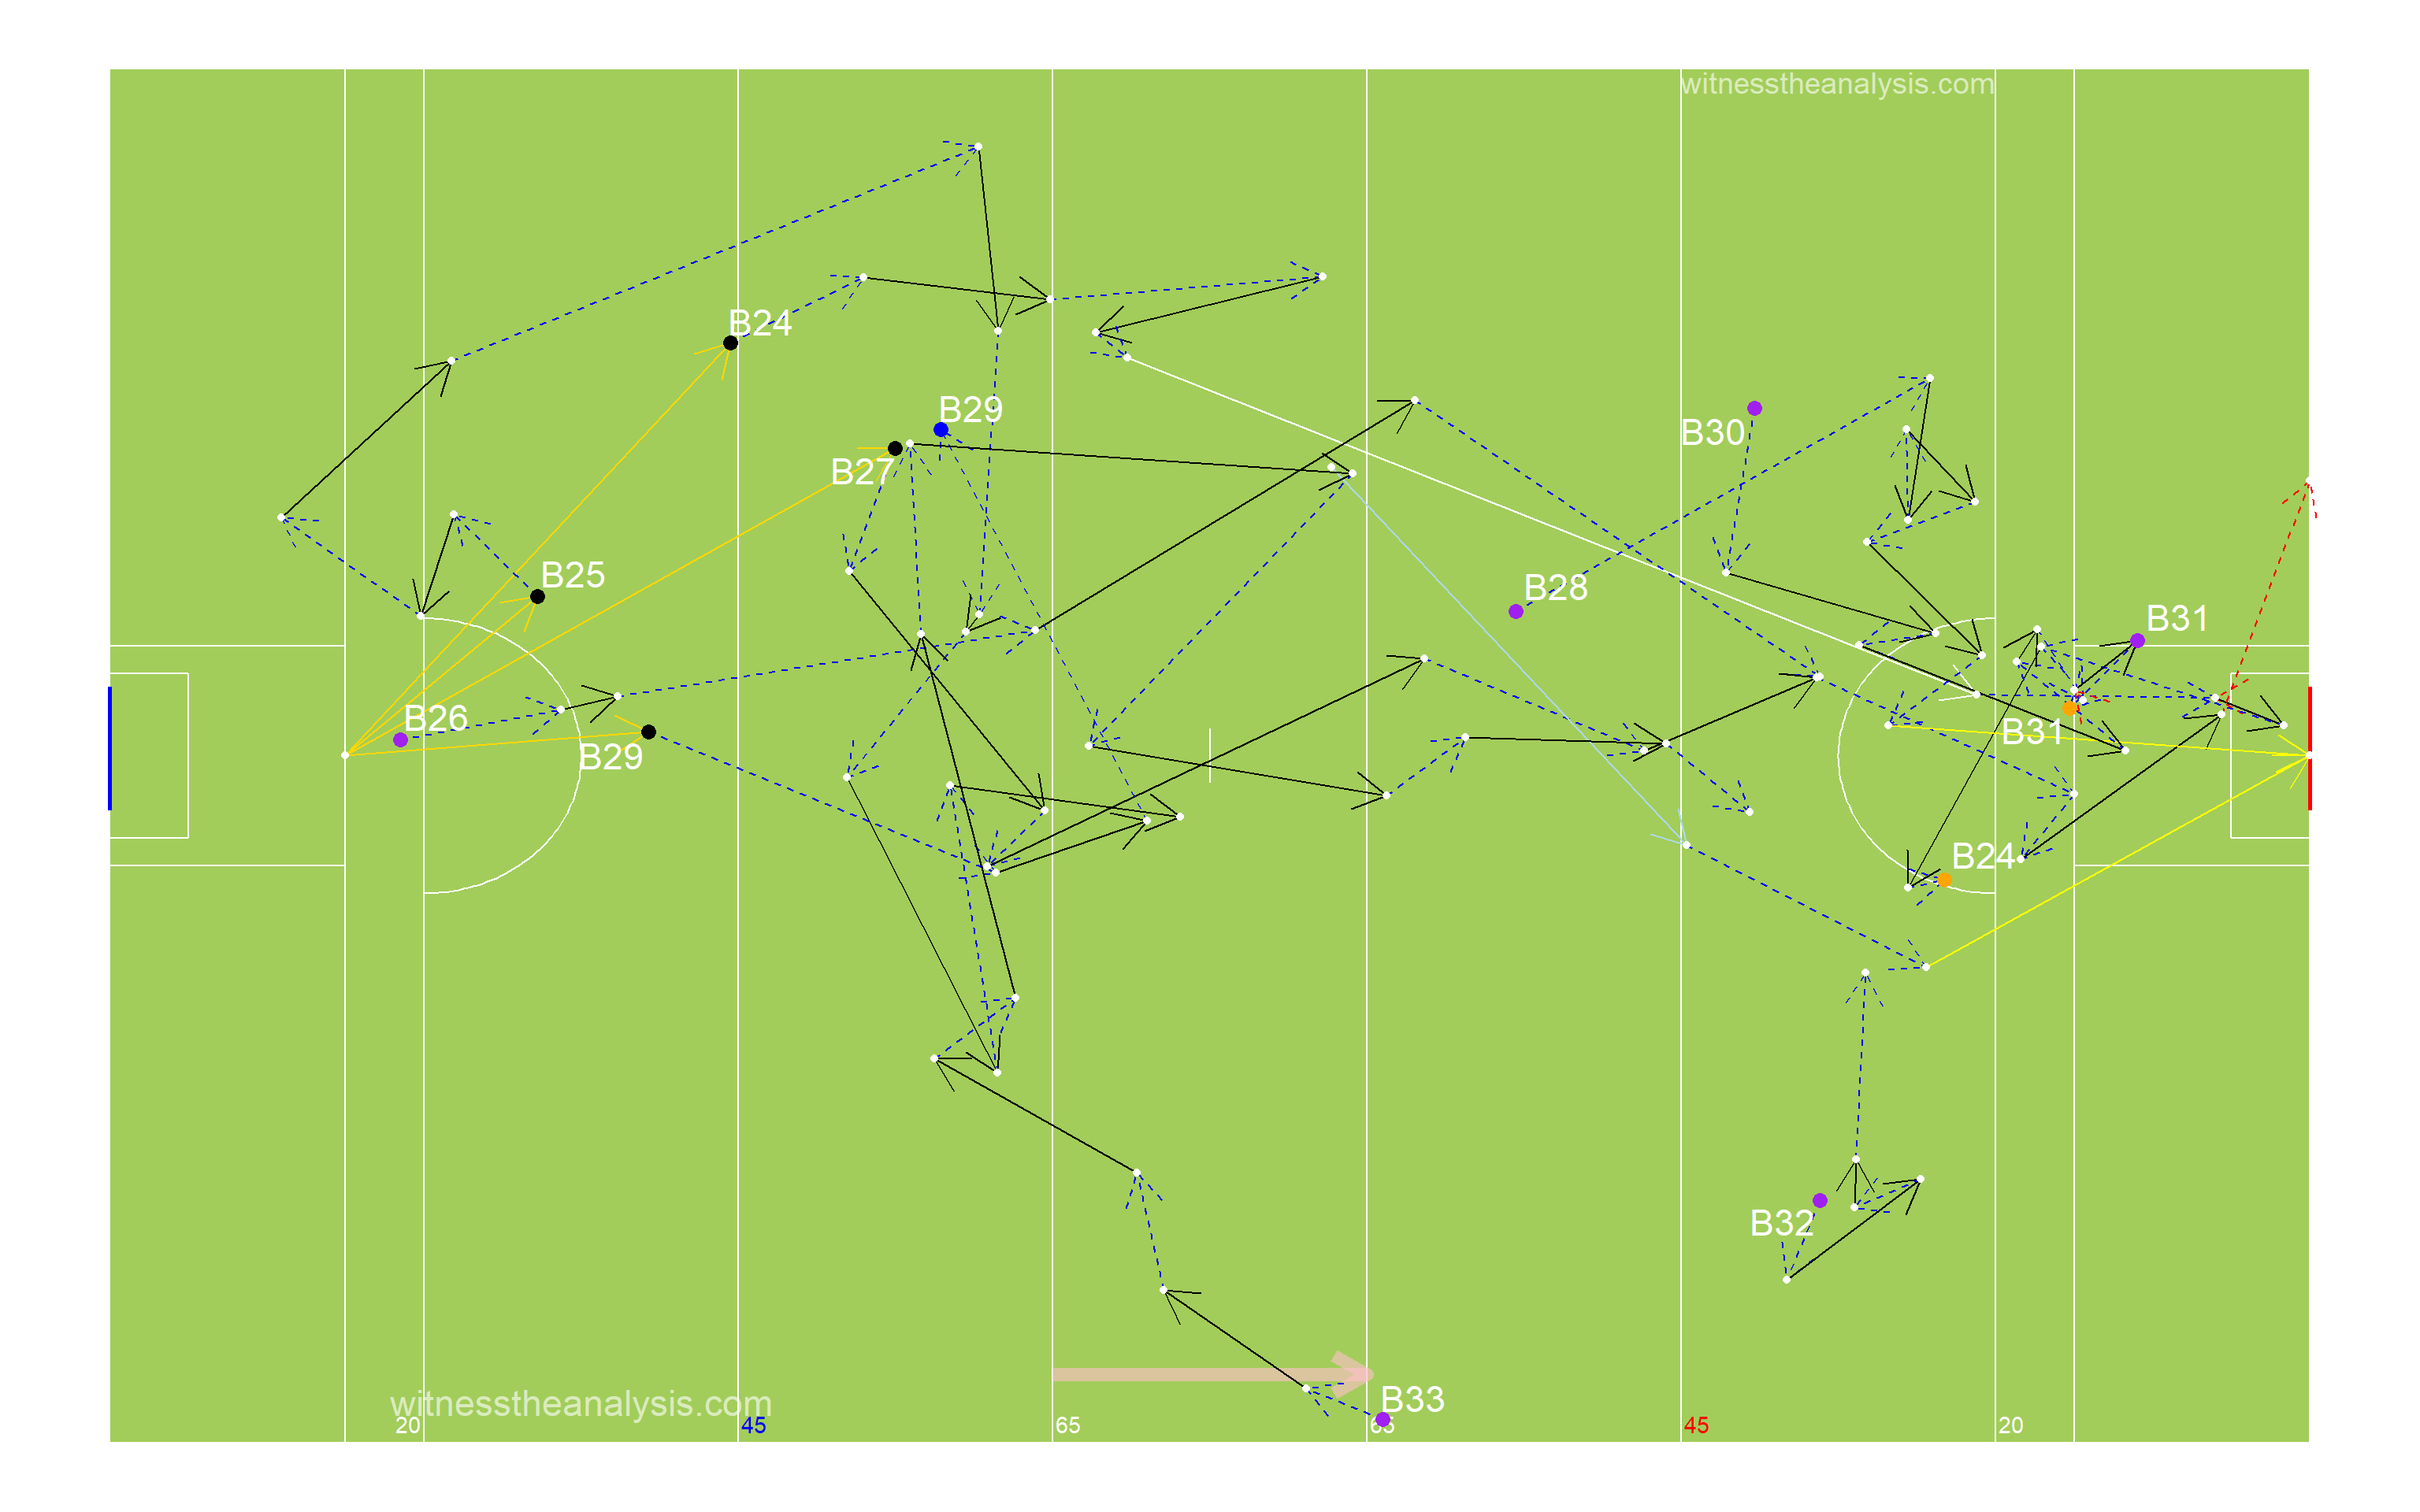
###Ballyboden Period - 4 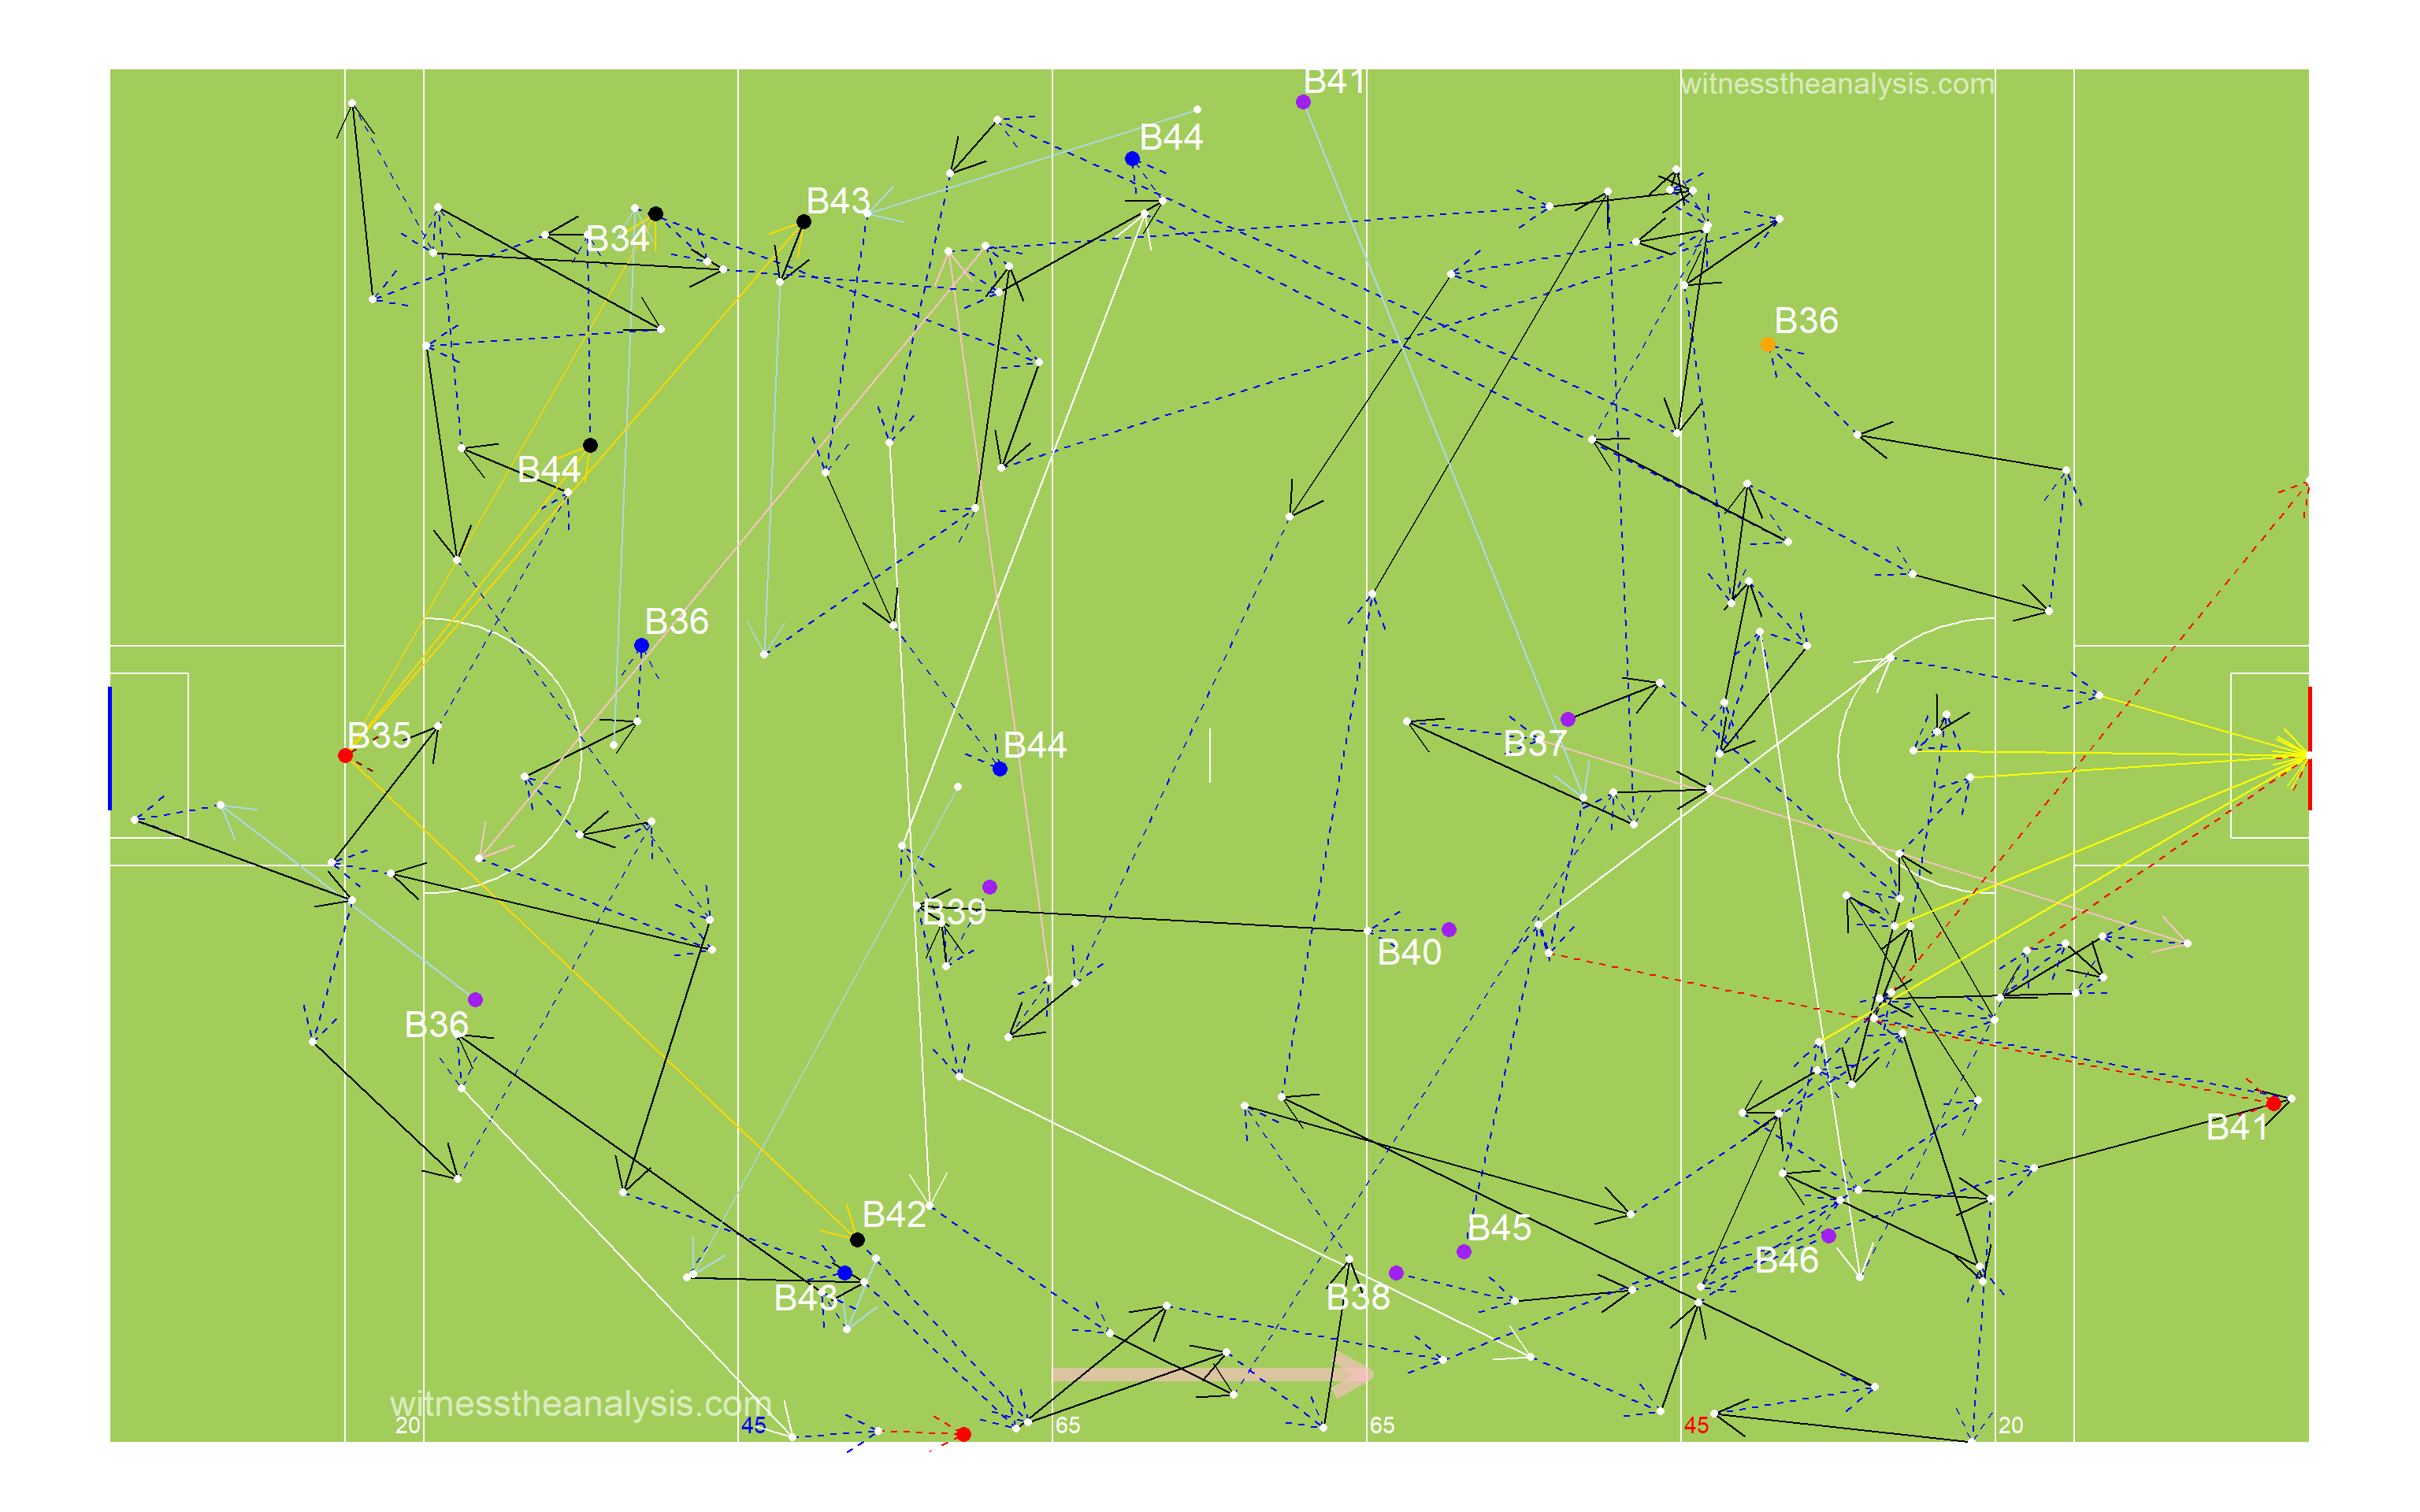
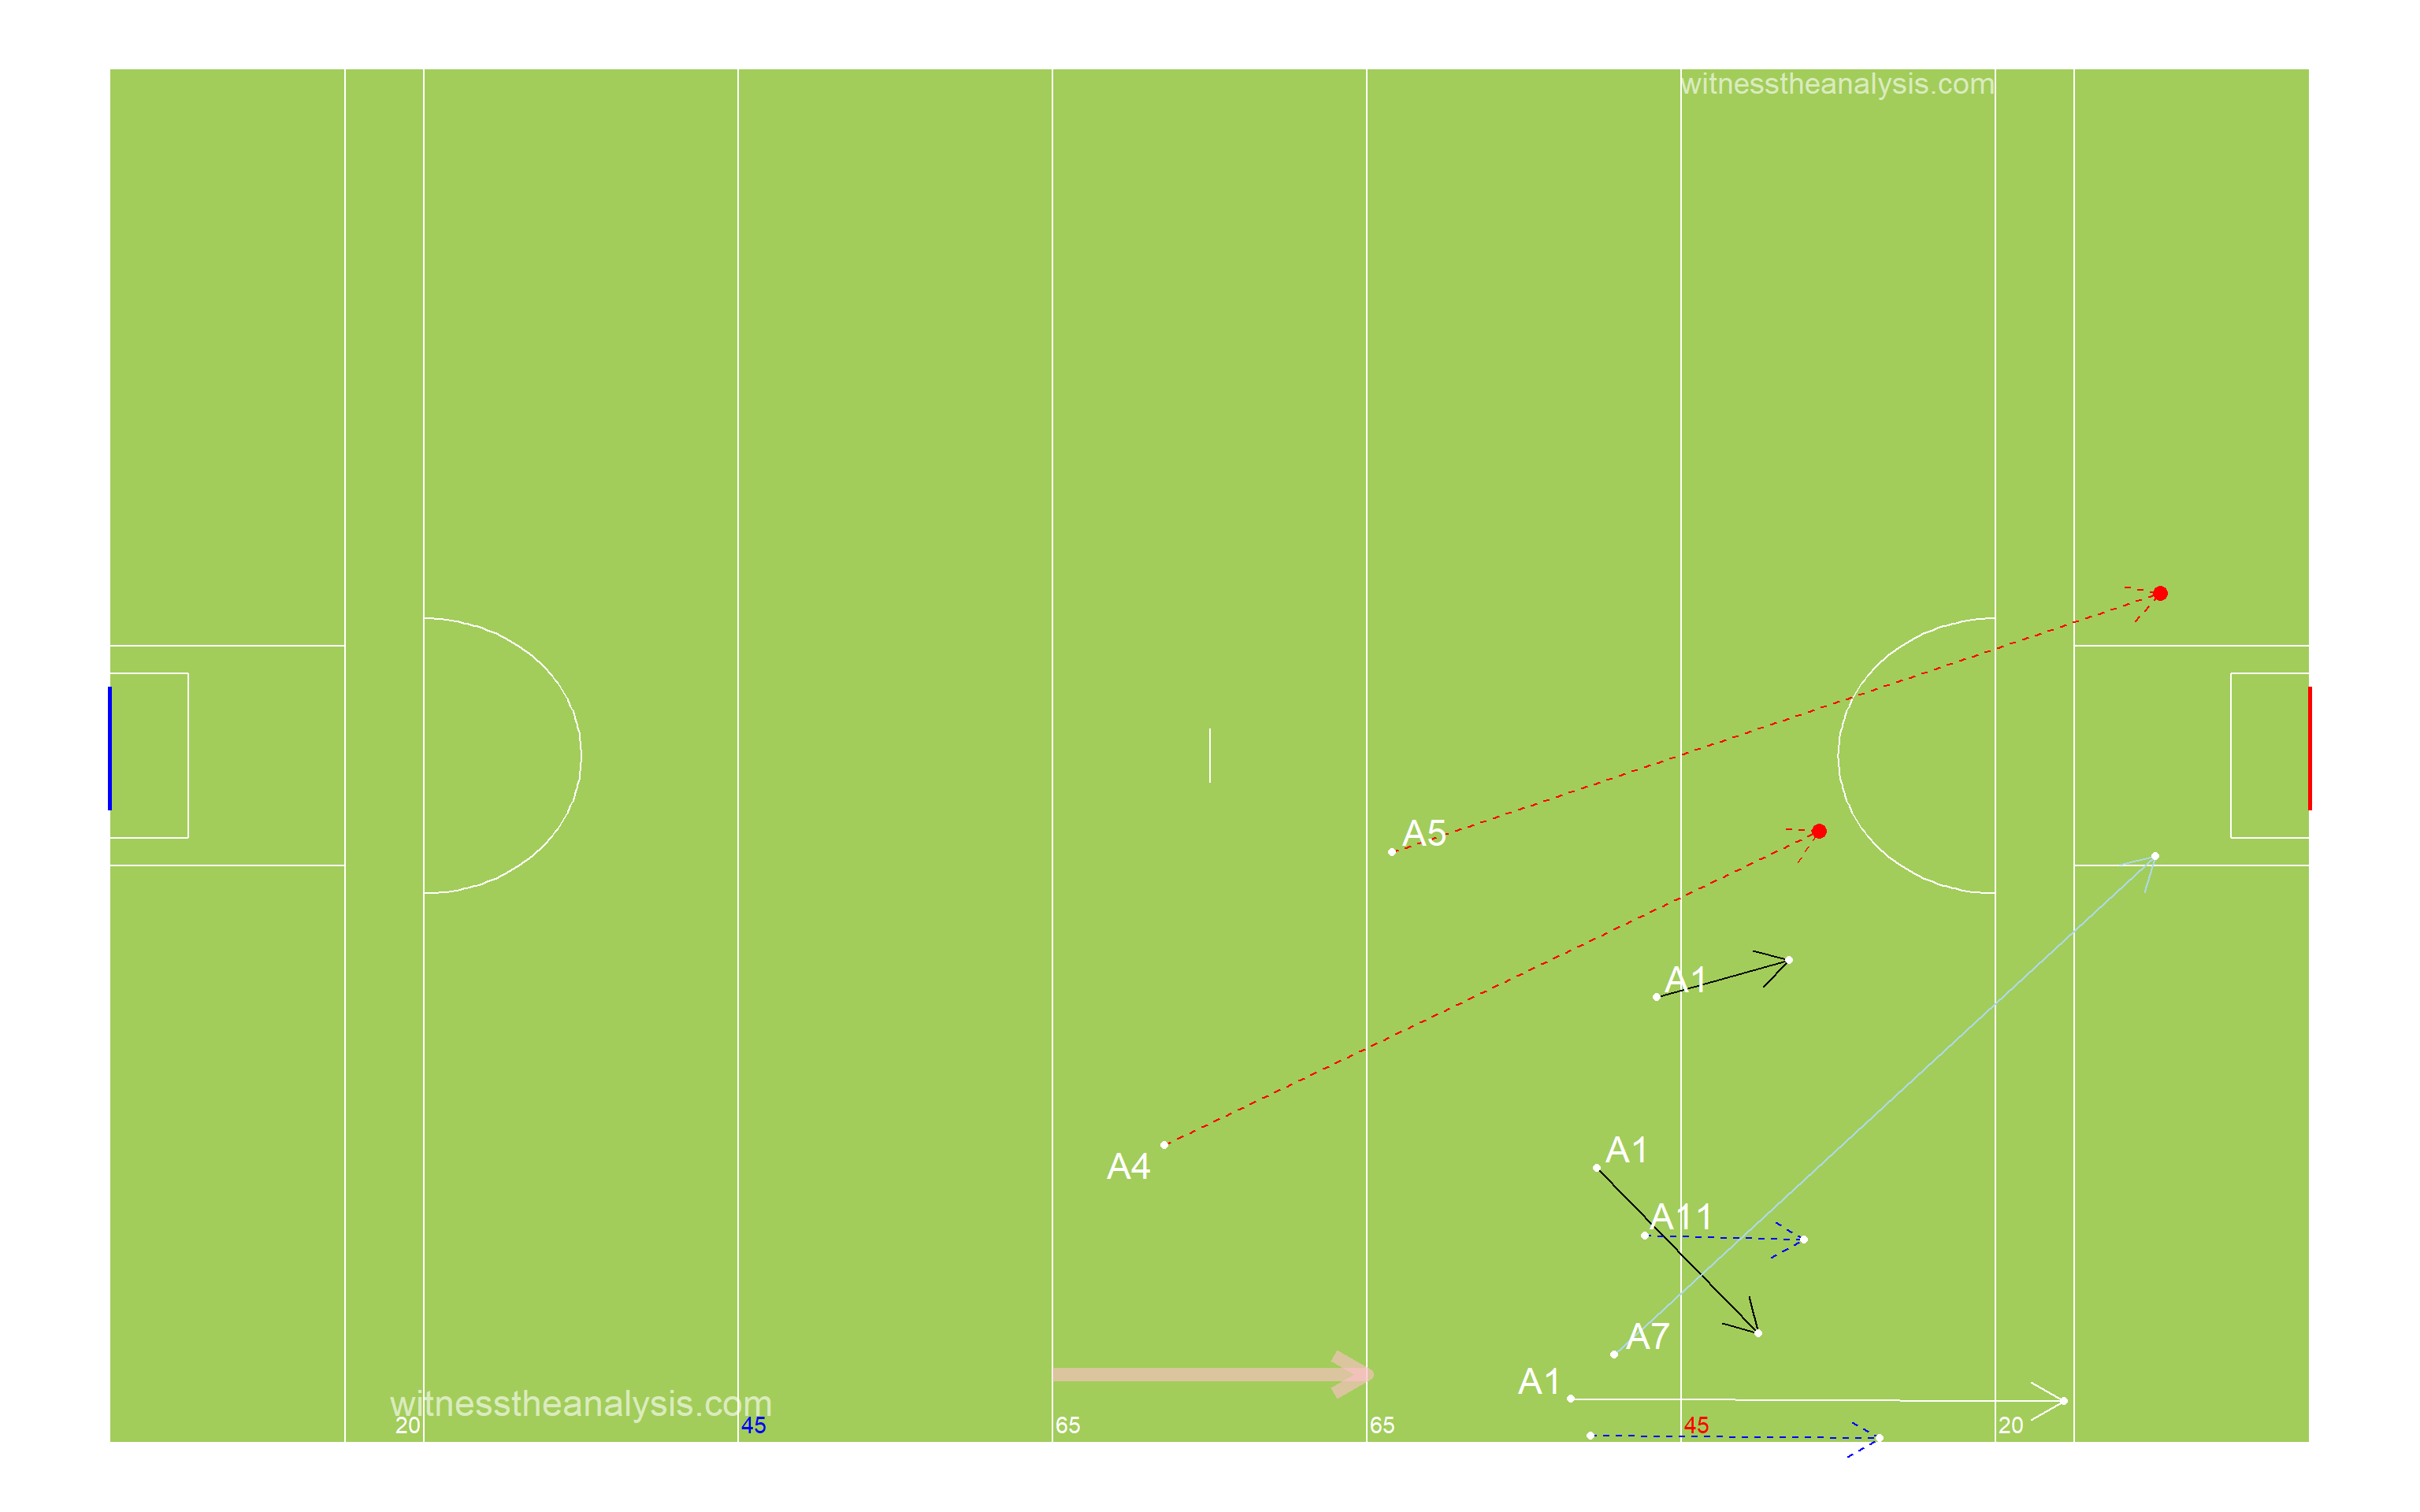
##45 Entries ###Thomas Davis - Game
###Thomas Davis - Period 1
###Thomas Davis - Period 2
###Thomas Davis - Period 3
###Thomas Davis - Period 4

###Ballyboden - Game
###Ballyboden - Period 1
###Ballyboden- Period 2
###Ballyboden - Period 3
###Ballyboden - Period 4
###Thomas Davis Total
##   count
## 1    32
###Thomas Davis Handpass
##   count
## 1     7
###Thomas Davis Run
##   count
## 1    13
###Thomas Davis Kick Pass Right
##   count
## 1     5
###Thomas Davis Pass Lost
##   count
## 1     2
###Thomas Davis Kick Pass Left
##   count
## 1     2
###Thomas Davis Fk/Mk/Sl Pass
##   count
## 1     3
###Ballyboden Total
##   count
## 1    39
###Ballyboden Handpass
##   count
## 1     7
###Ballyboden Run
##   count
## 1    18
###Ballyboden Kick Pass Right
##   count
## 1     5
###Ballyboden Pass Lost
##   count
## 1     3
###Ballyboden Kick Pass Left
##   count
## 1     3
###Ballyboden Fk/Mk/Sl Pass
## count
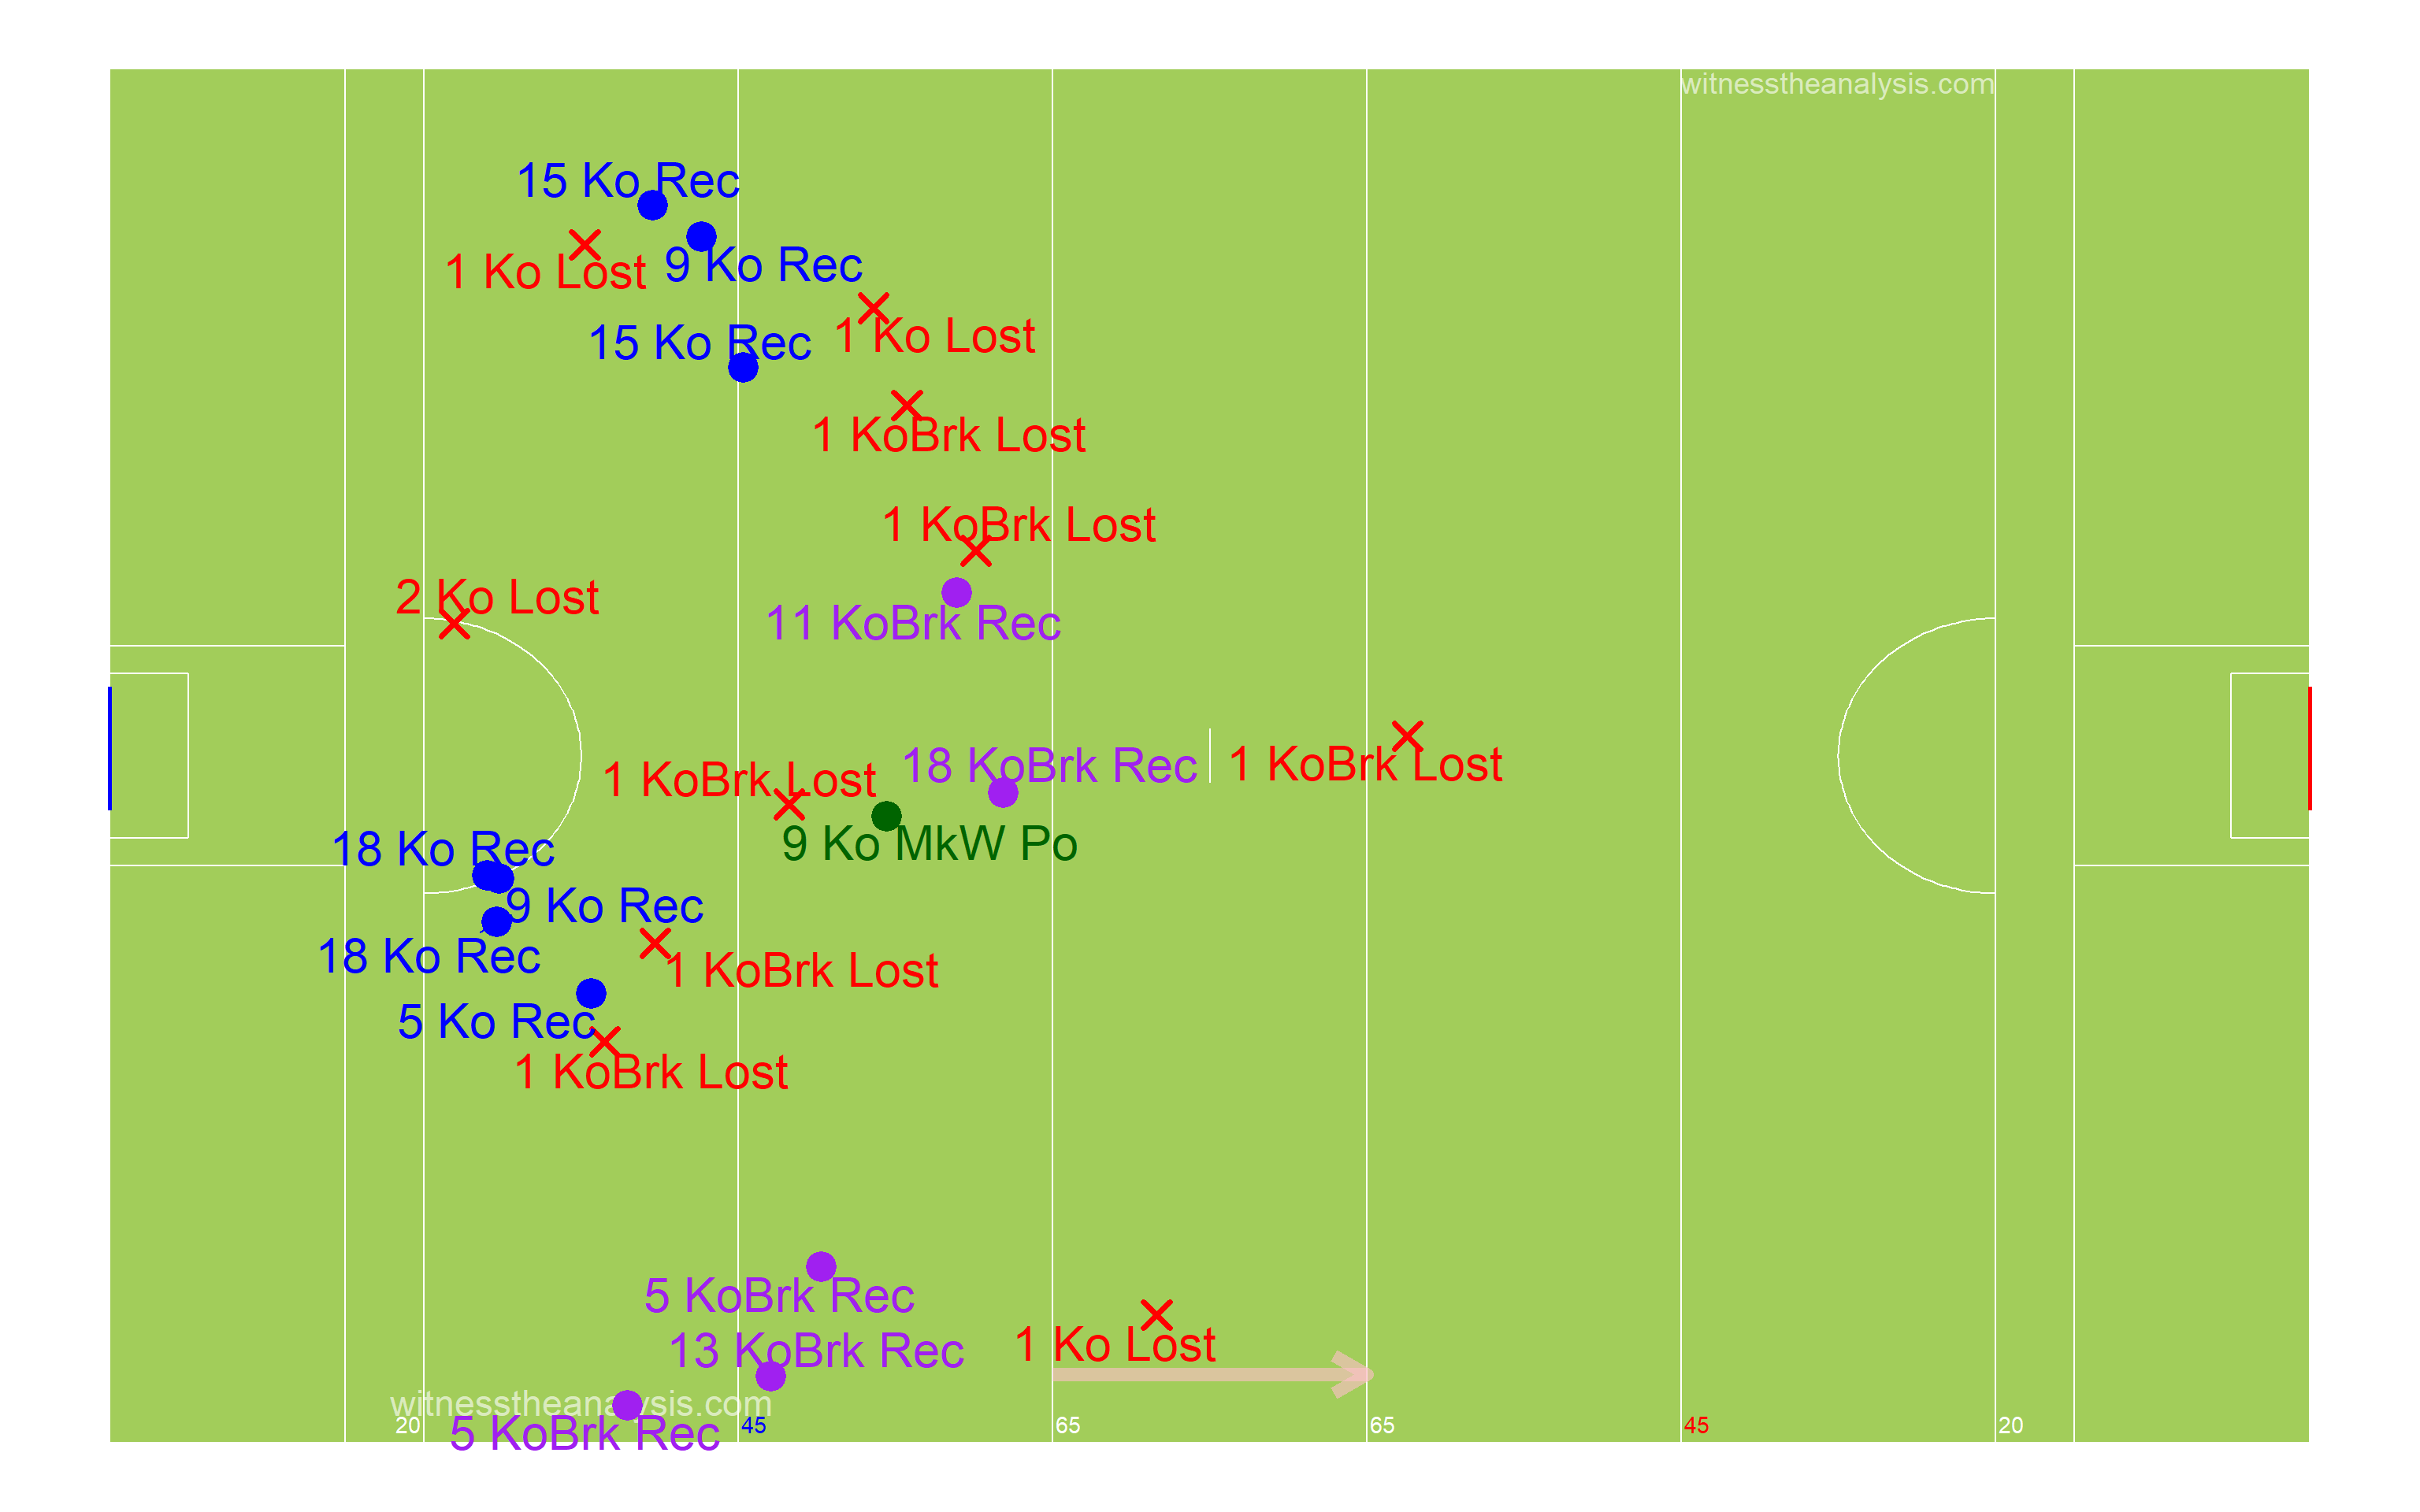
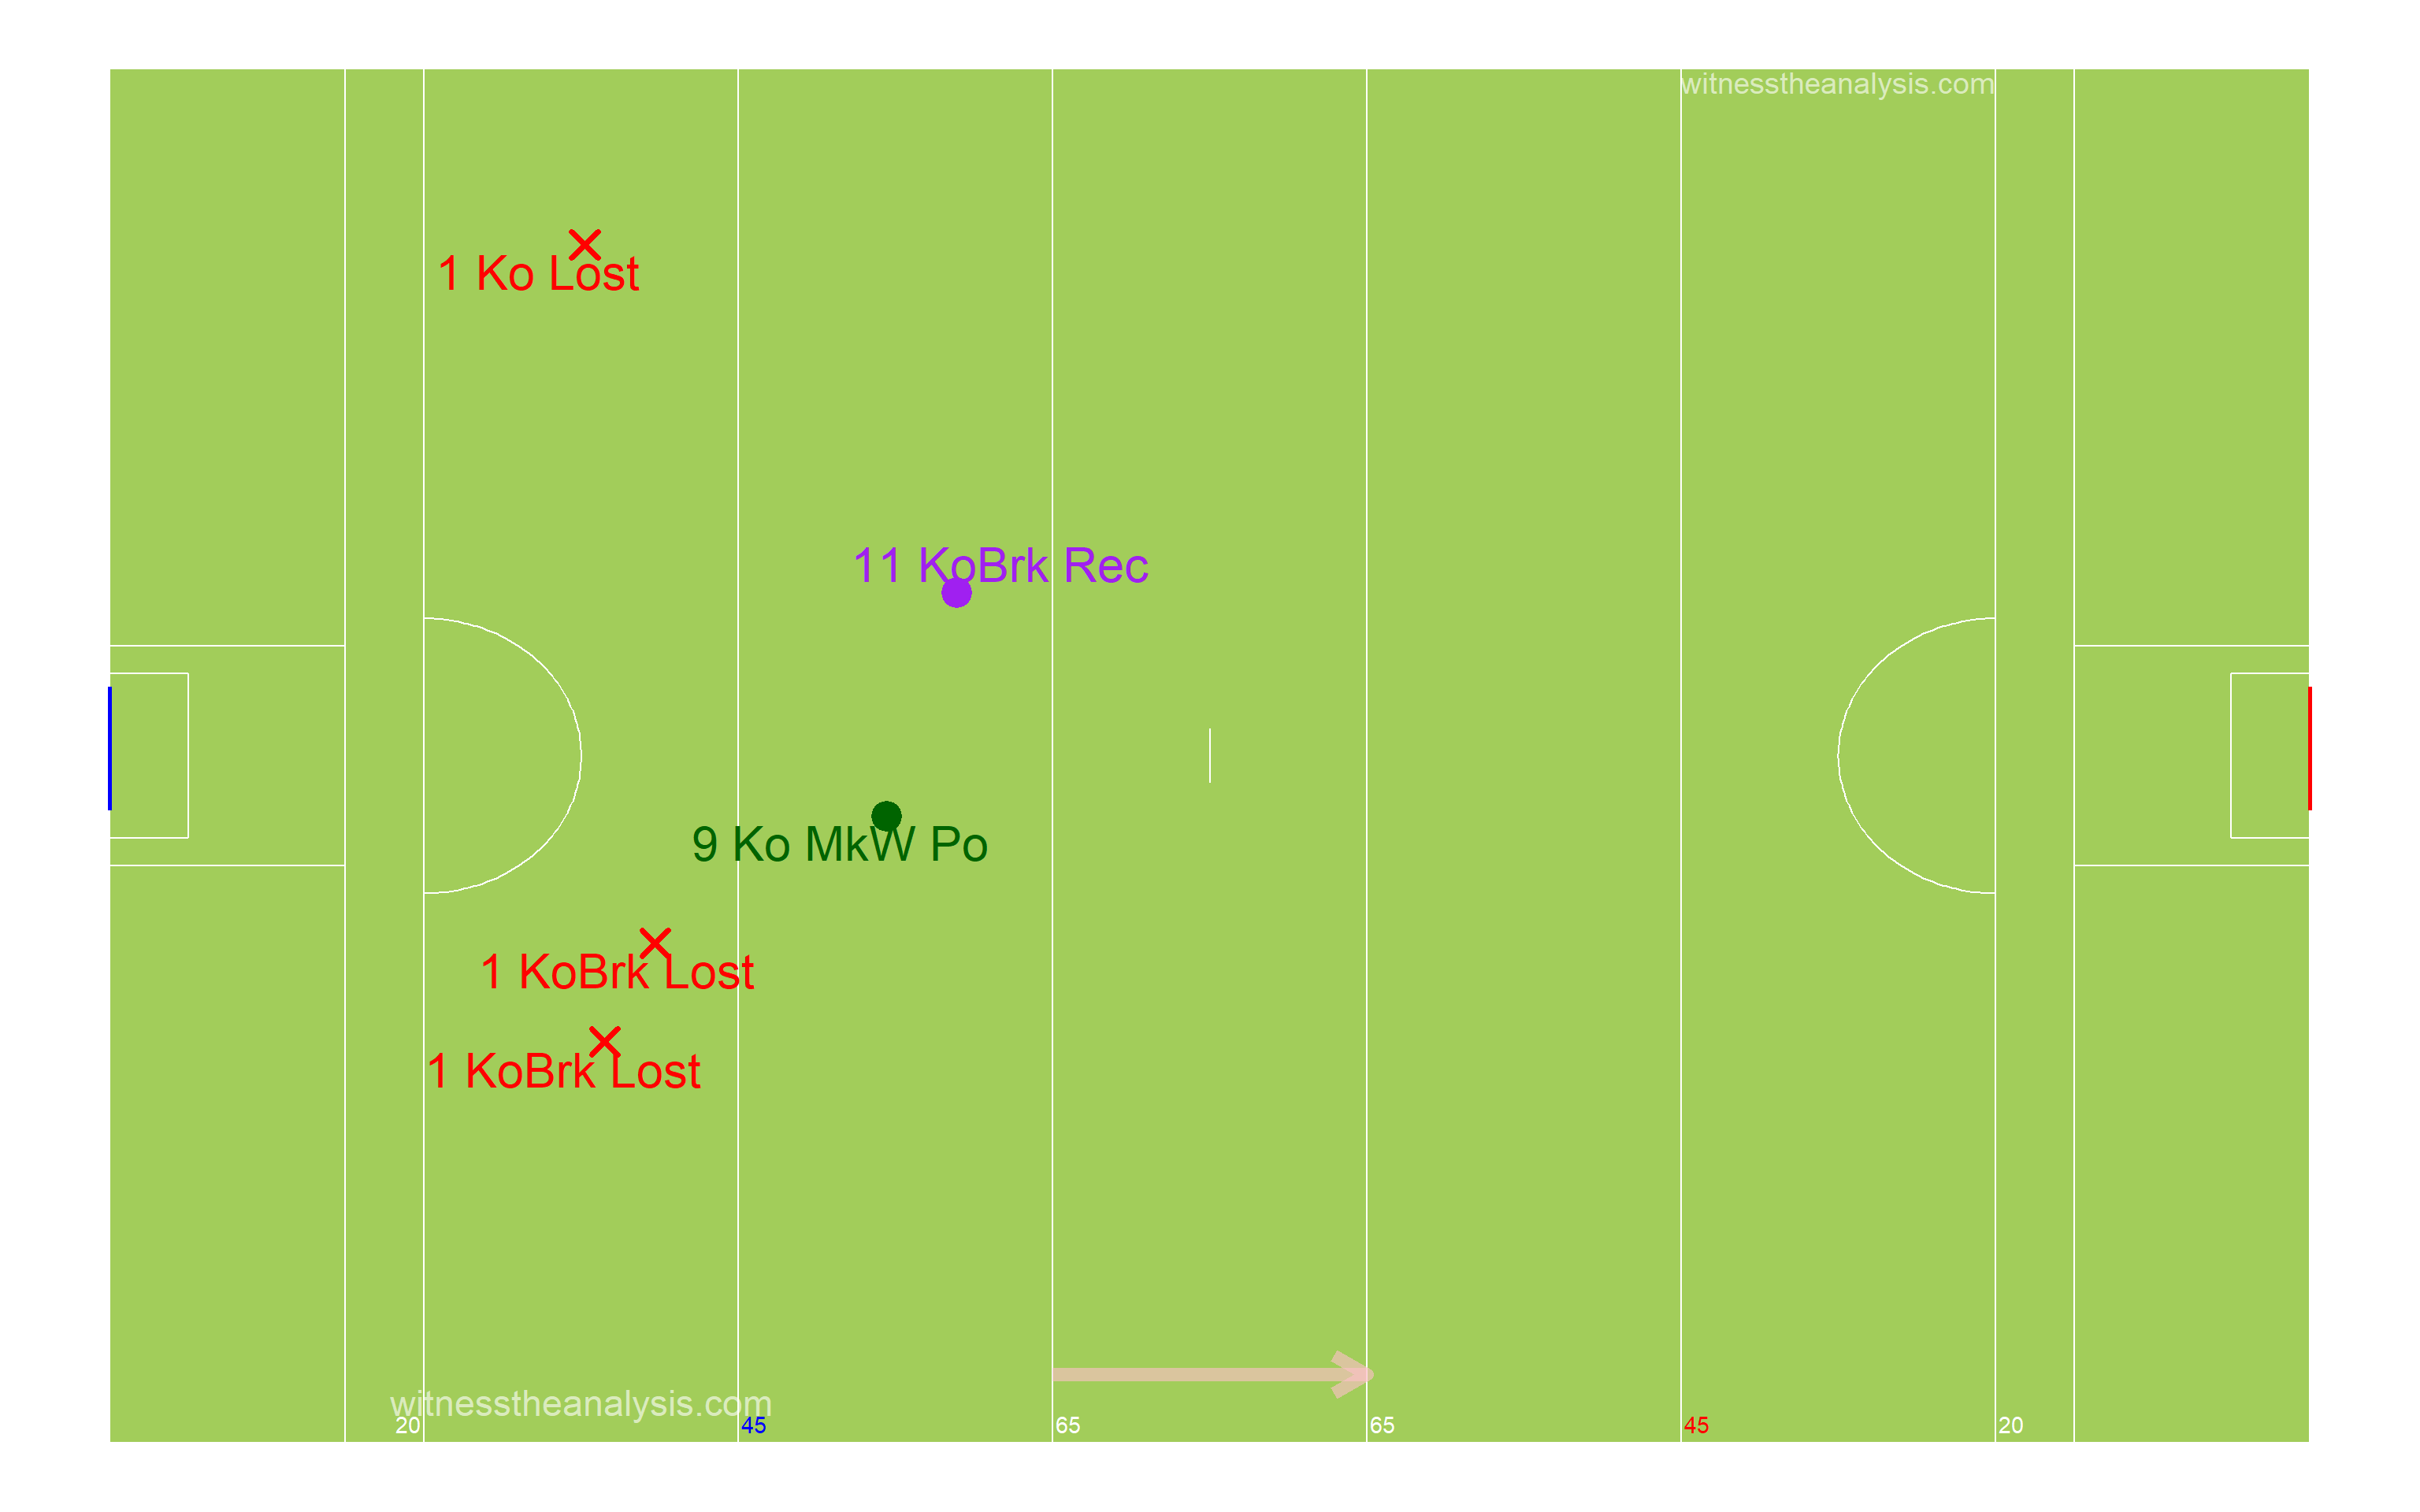
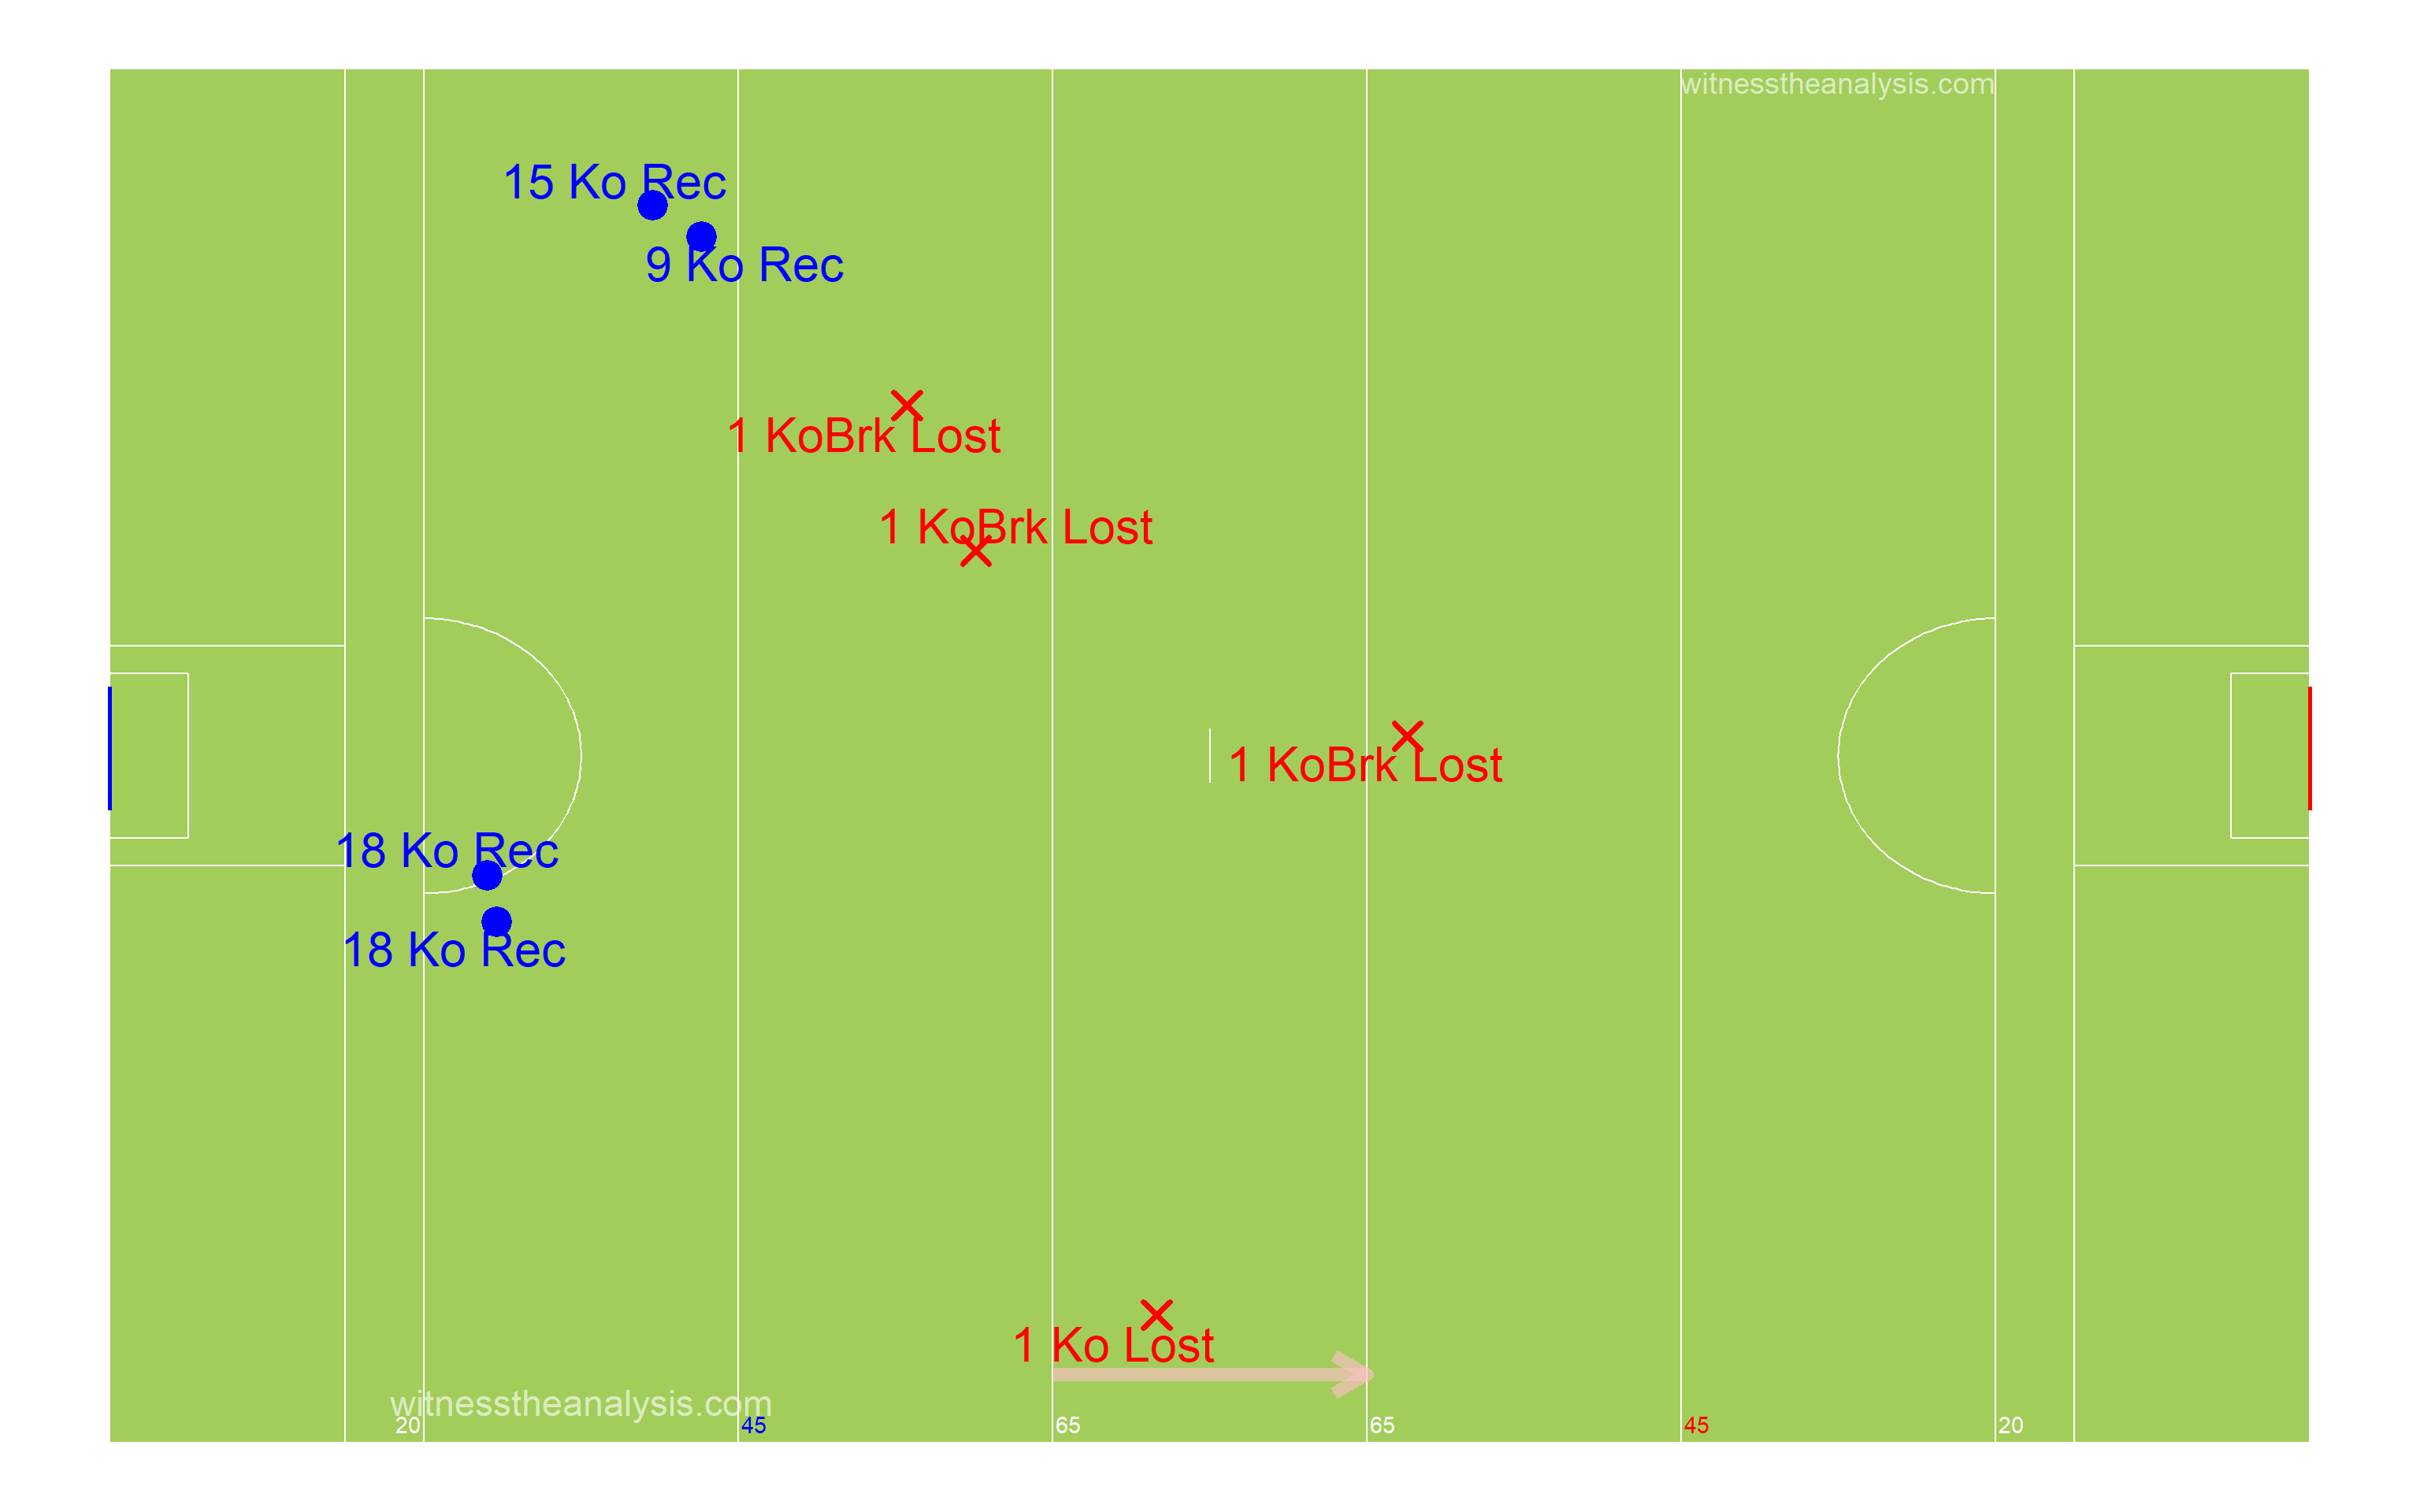
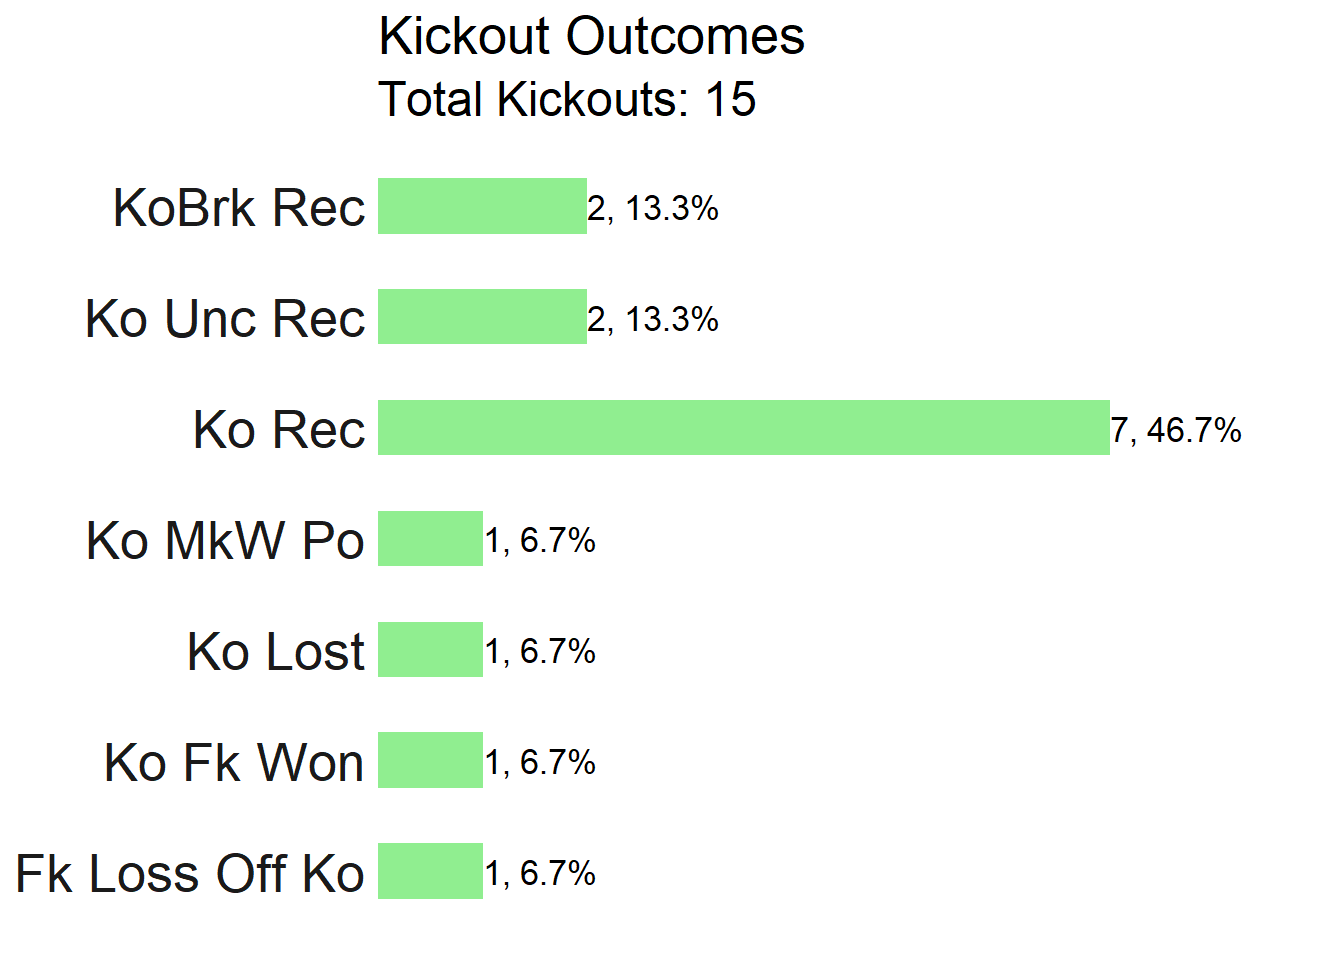
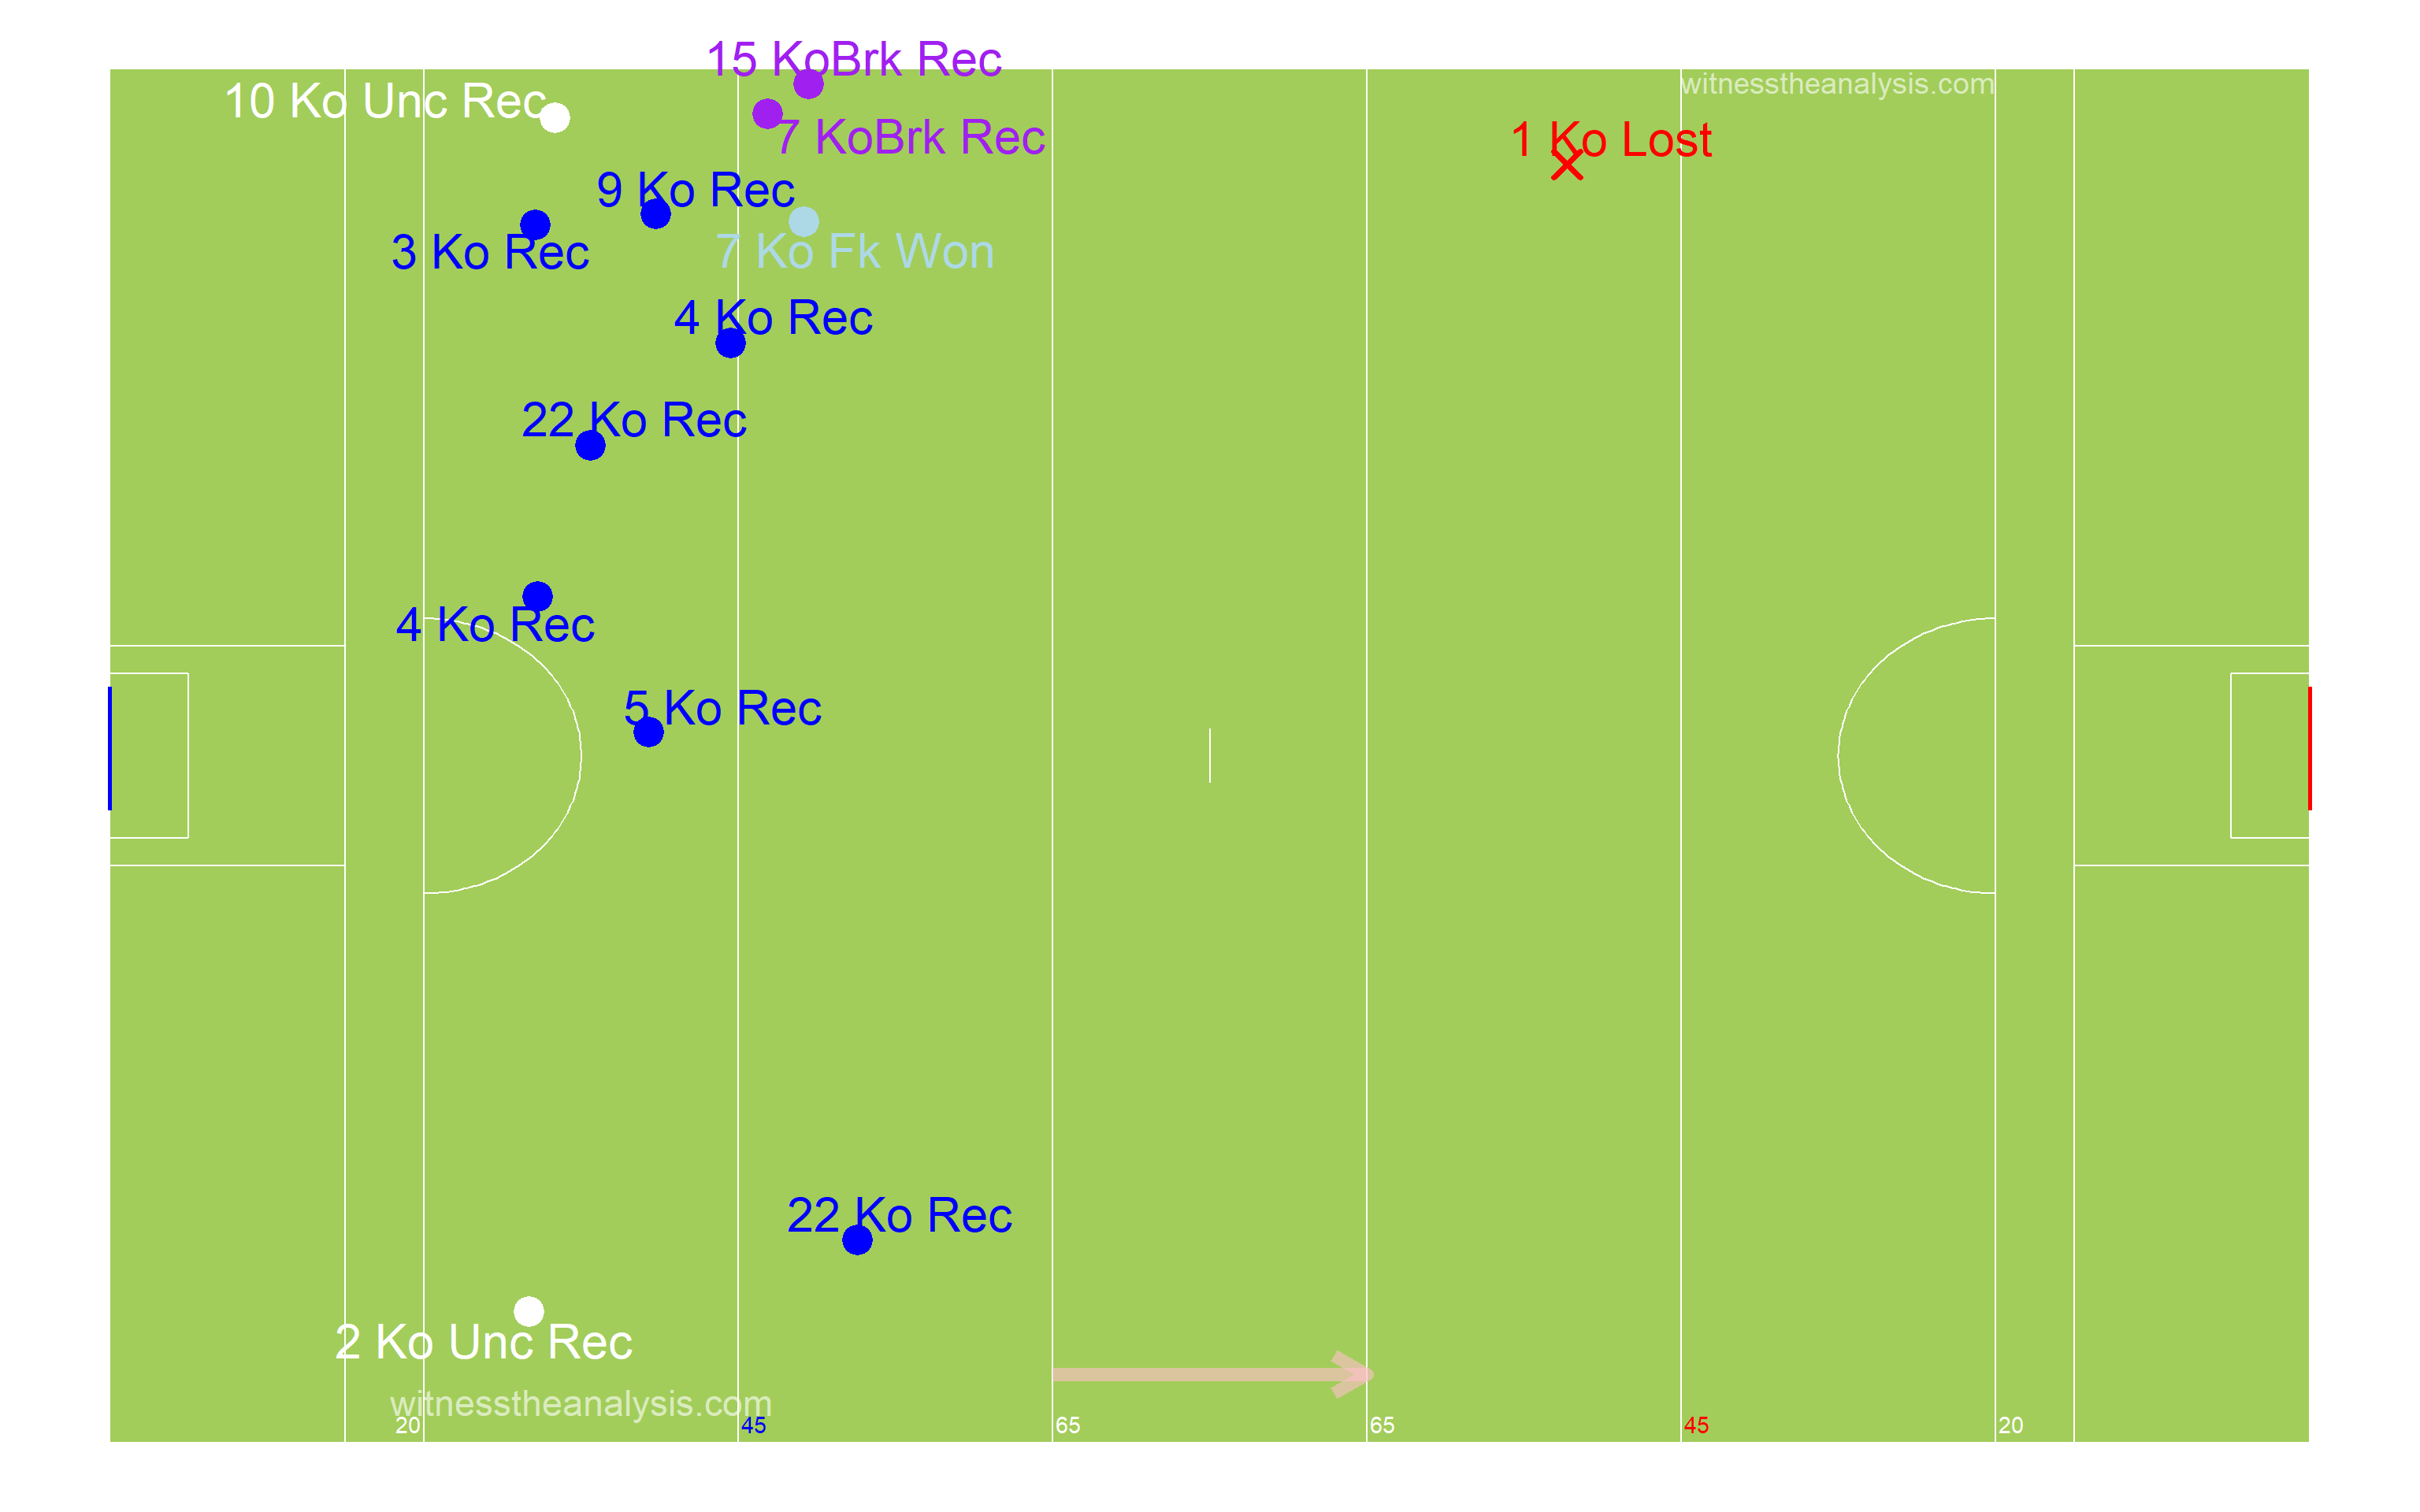
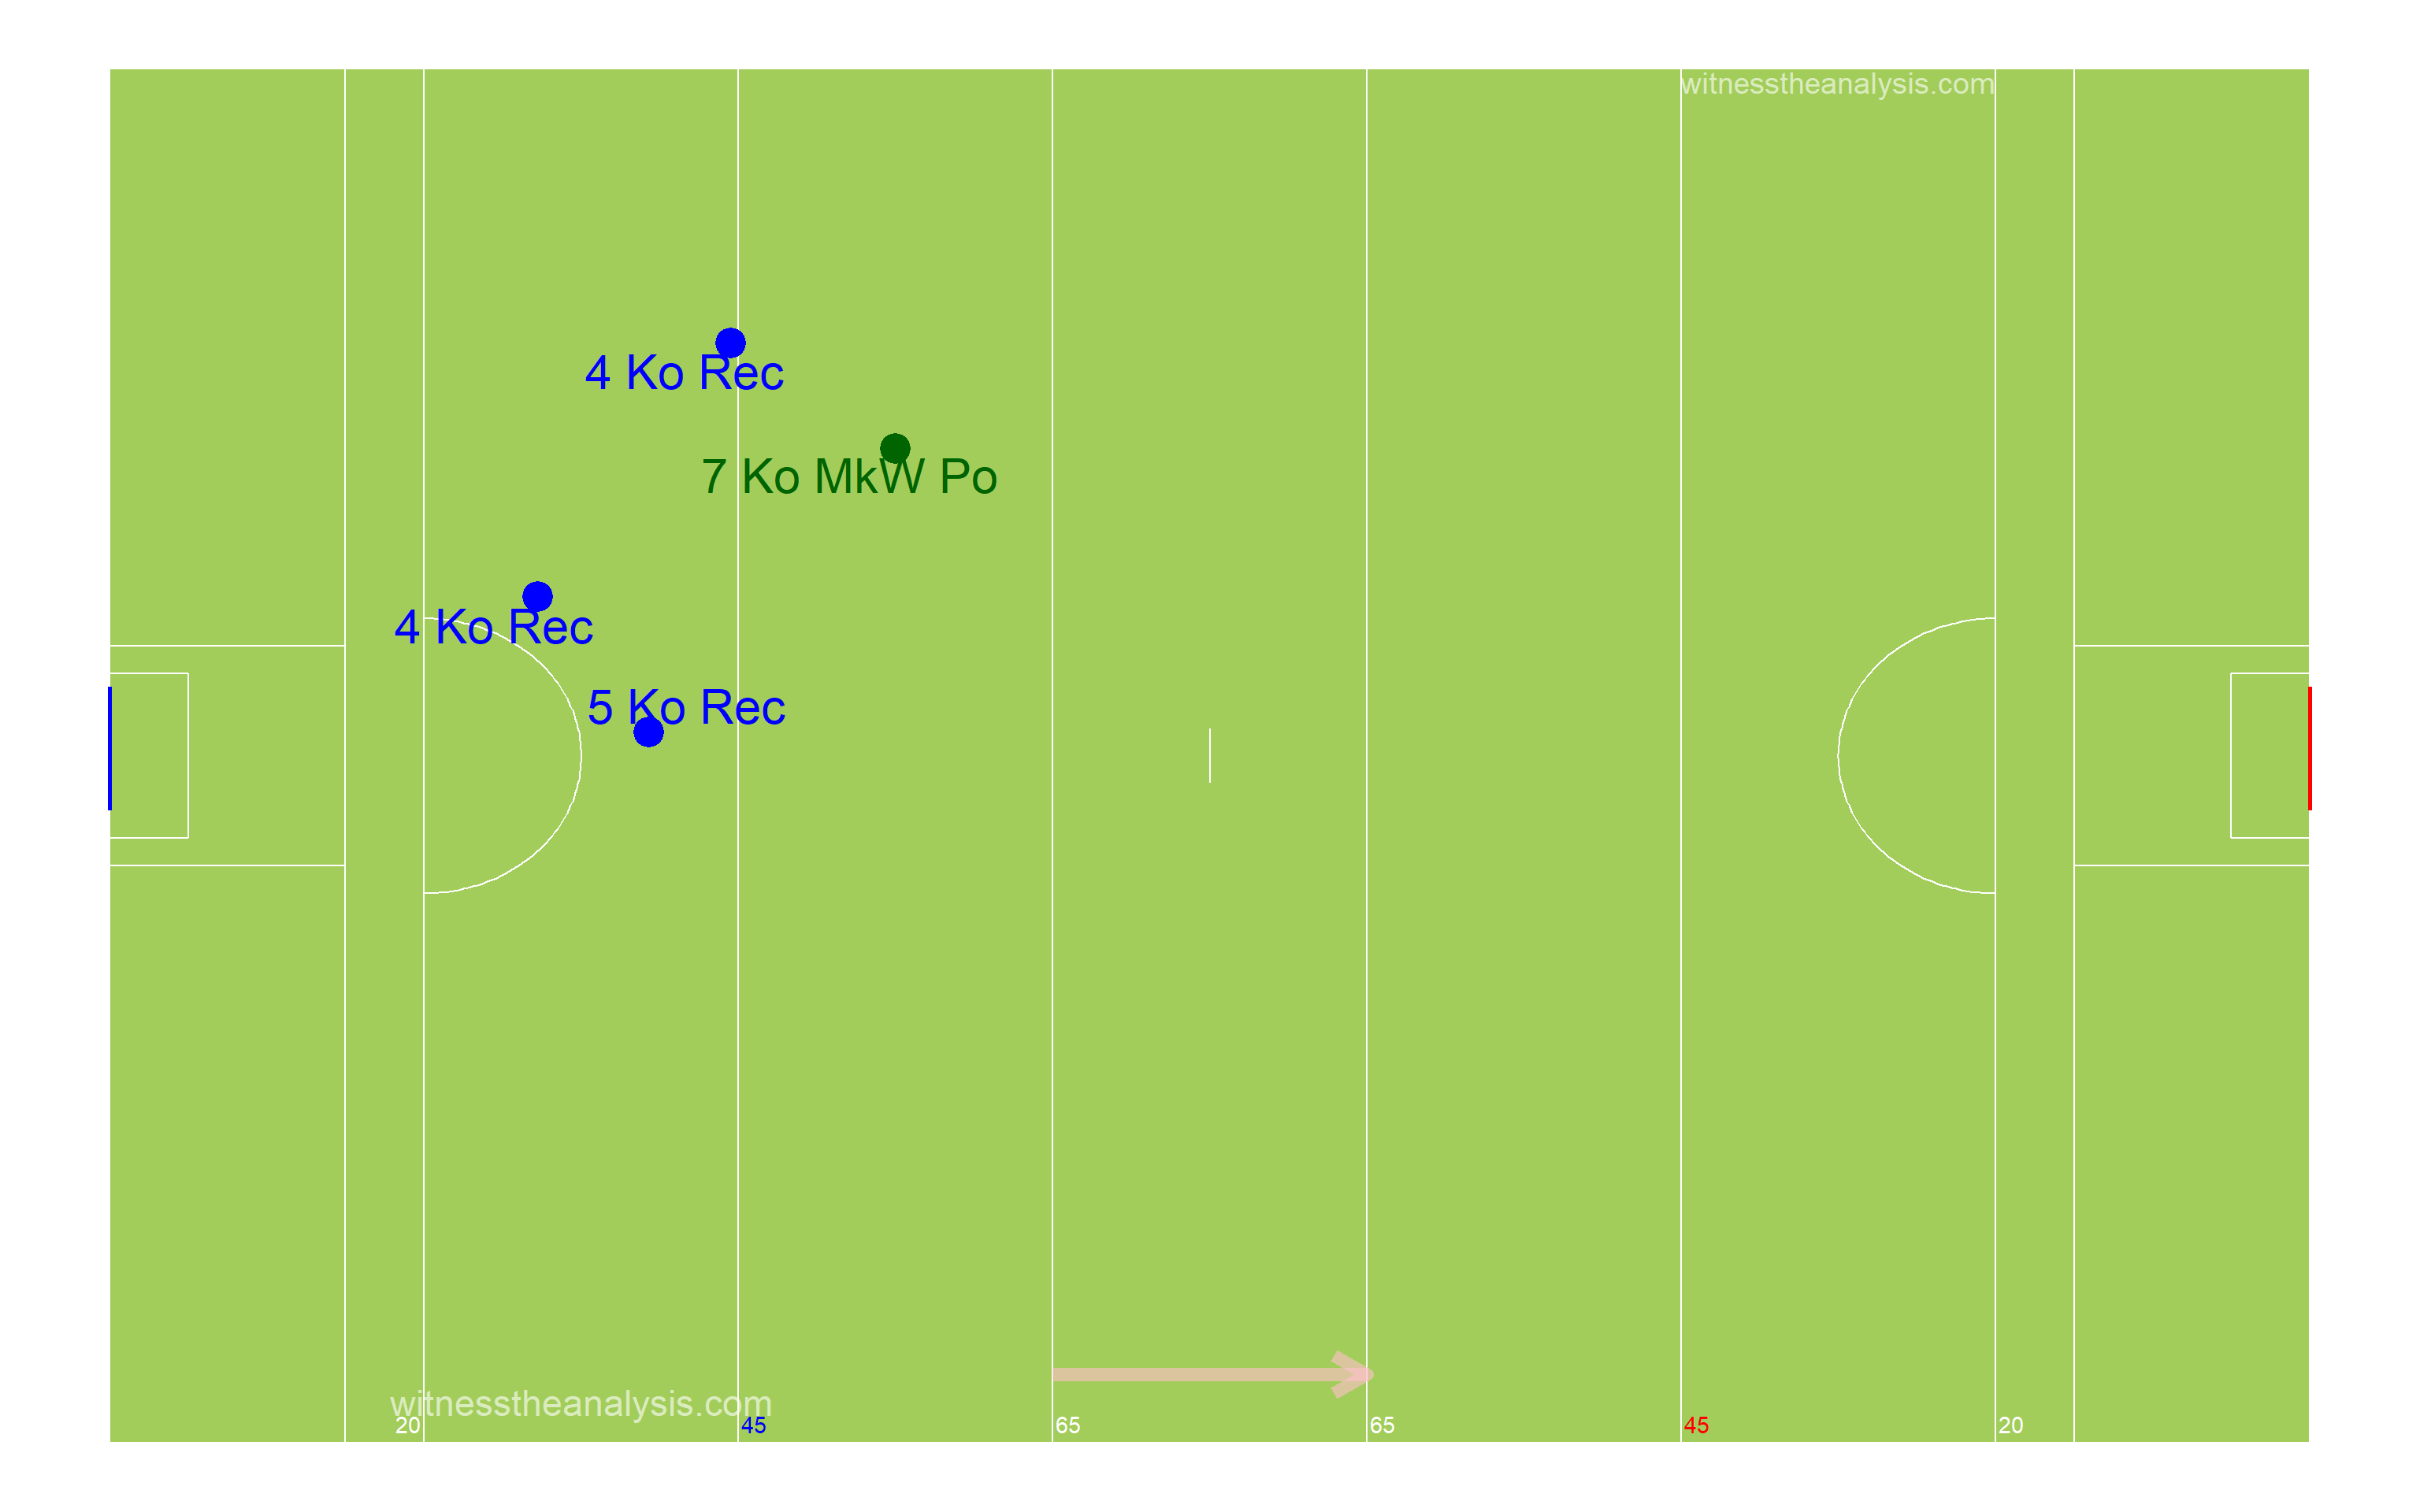
## 1 3#General ##Kick Outs ###Thomas Davis
###Period 1 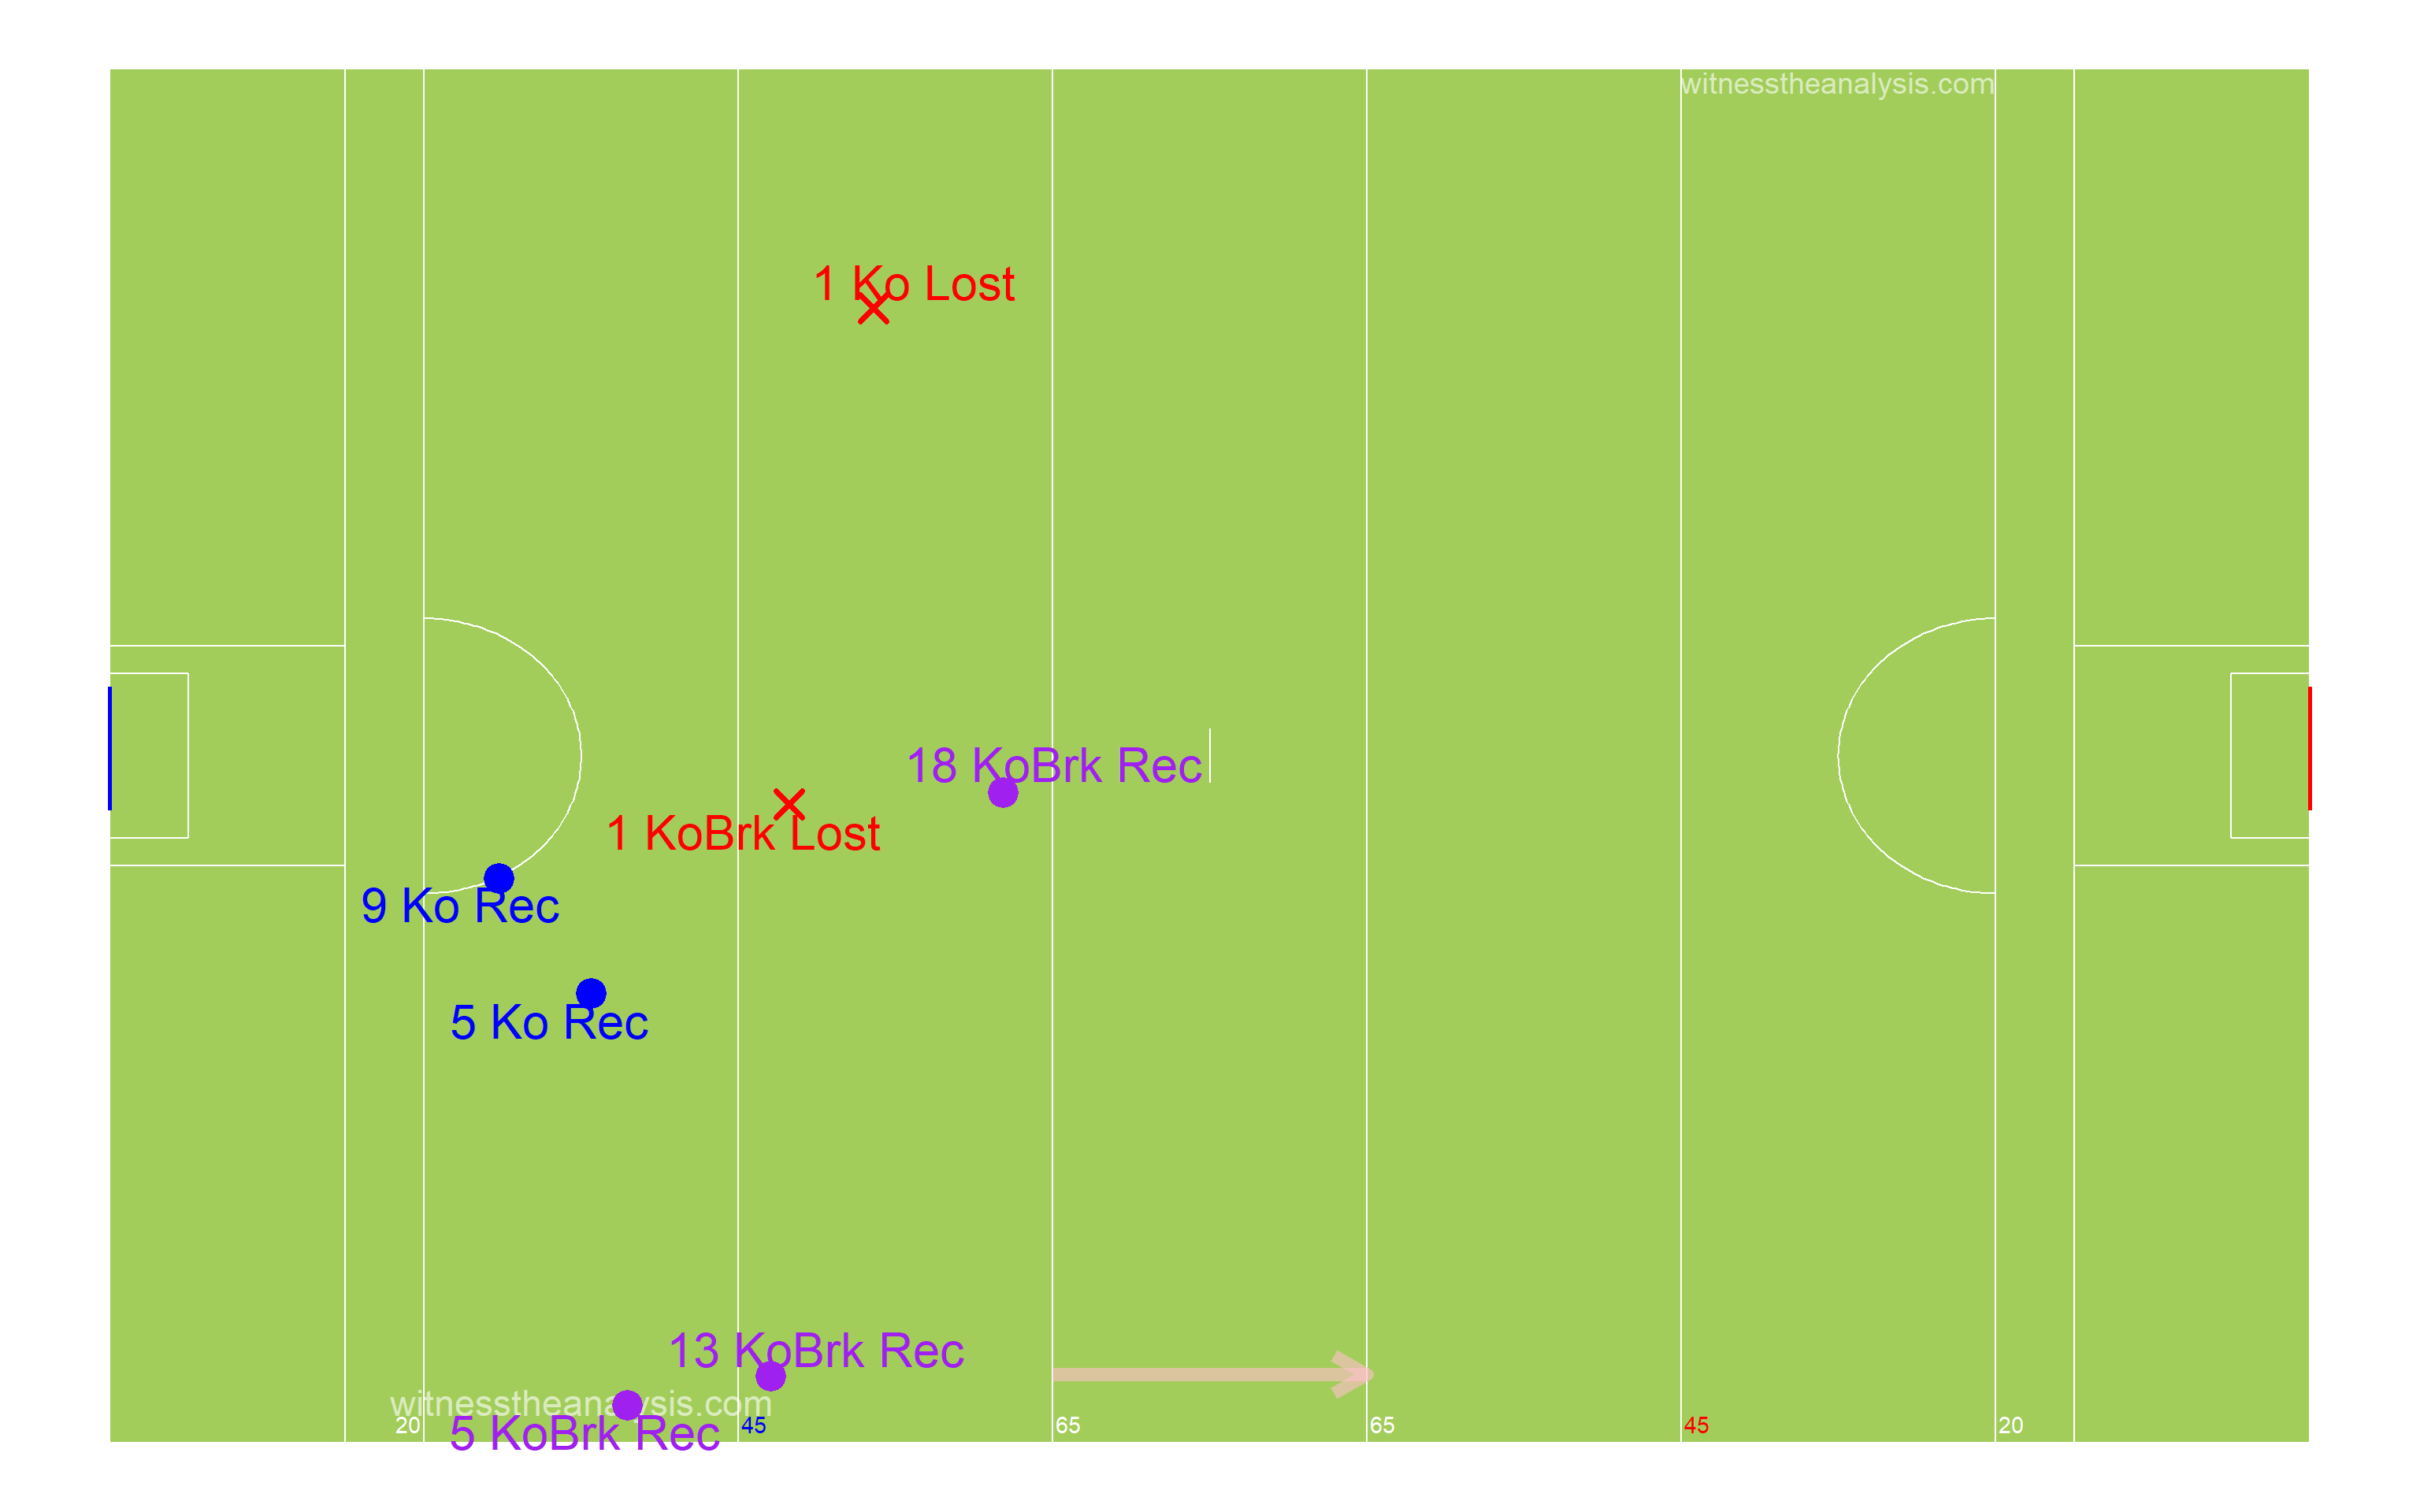
###Period 2 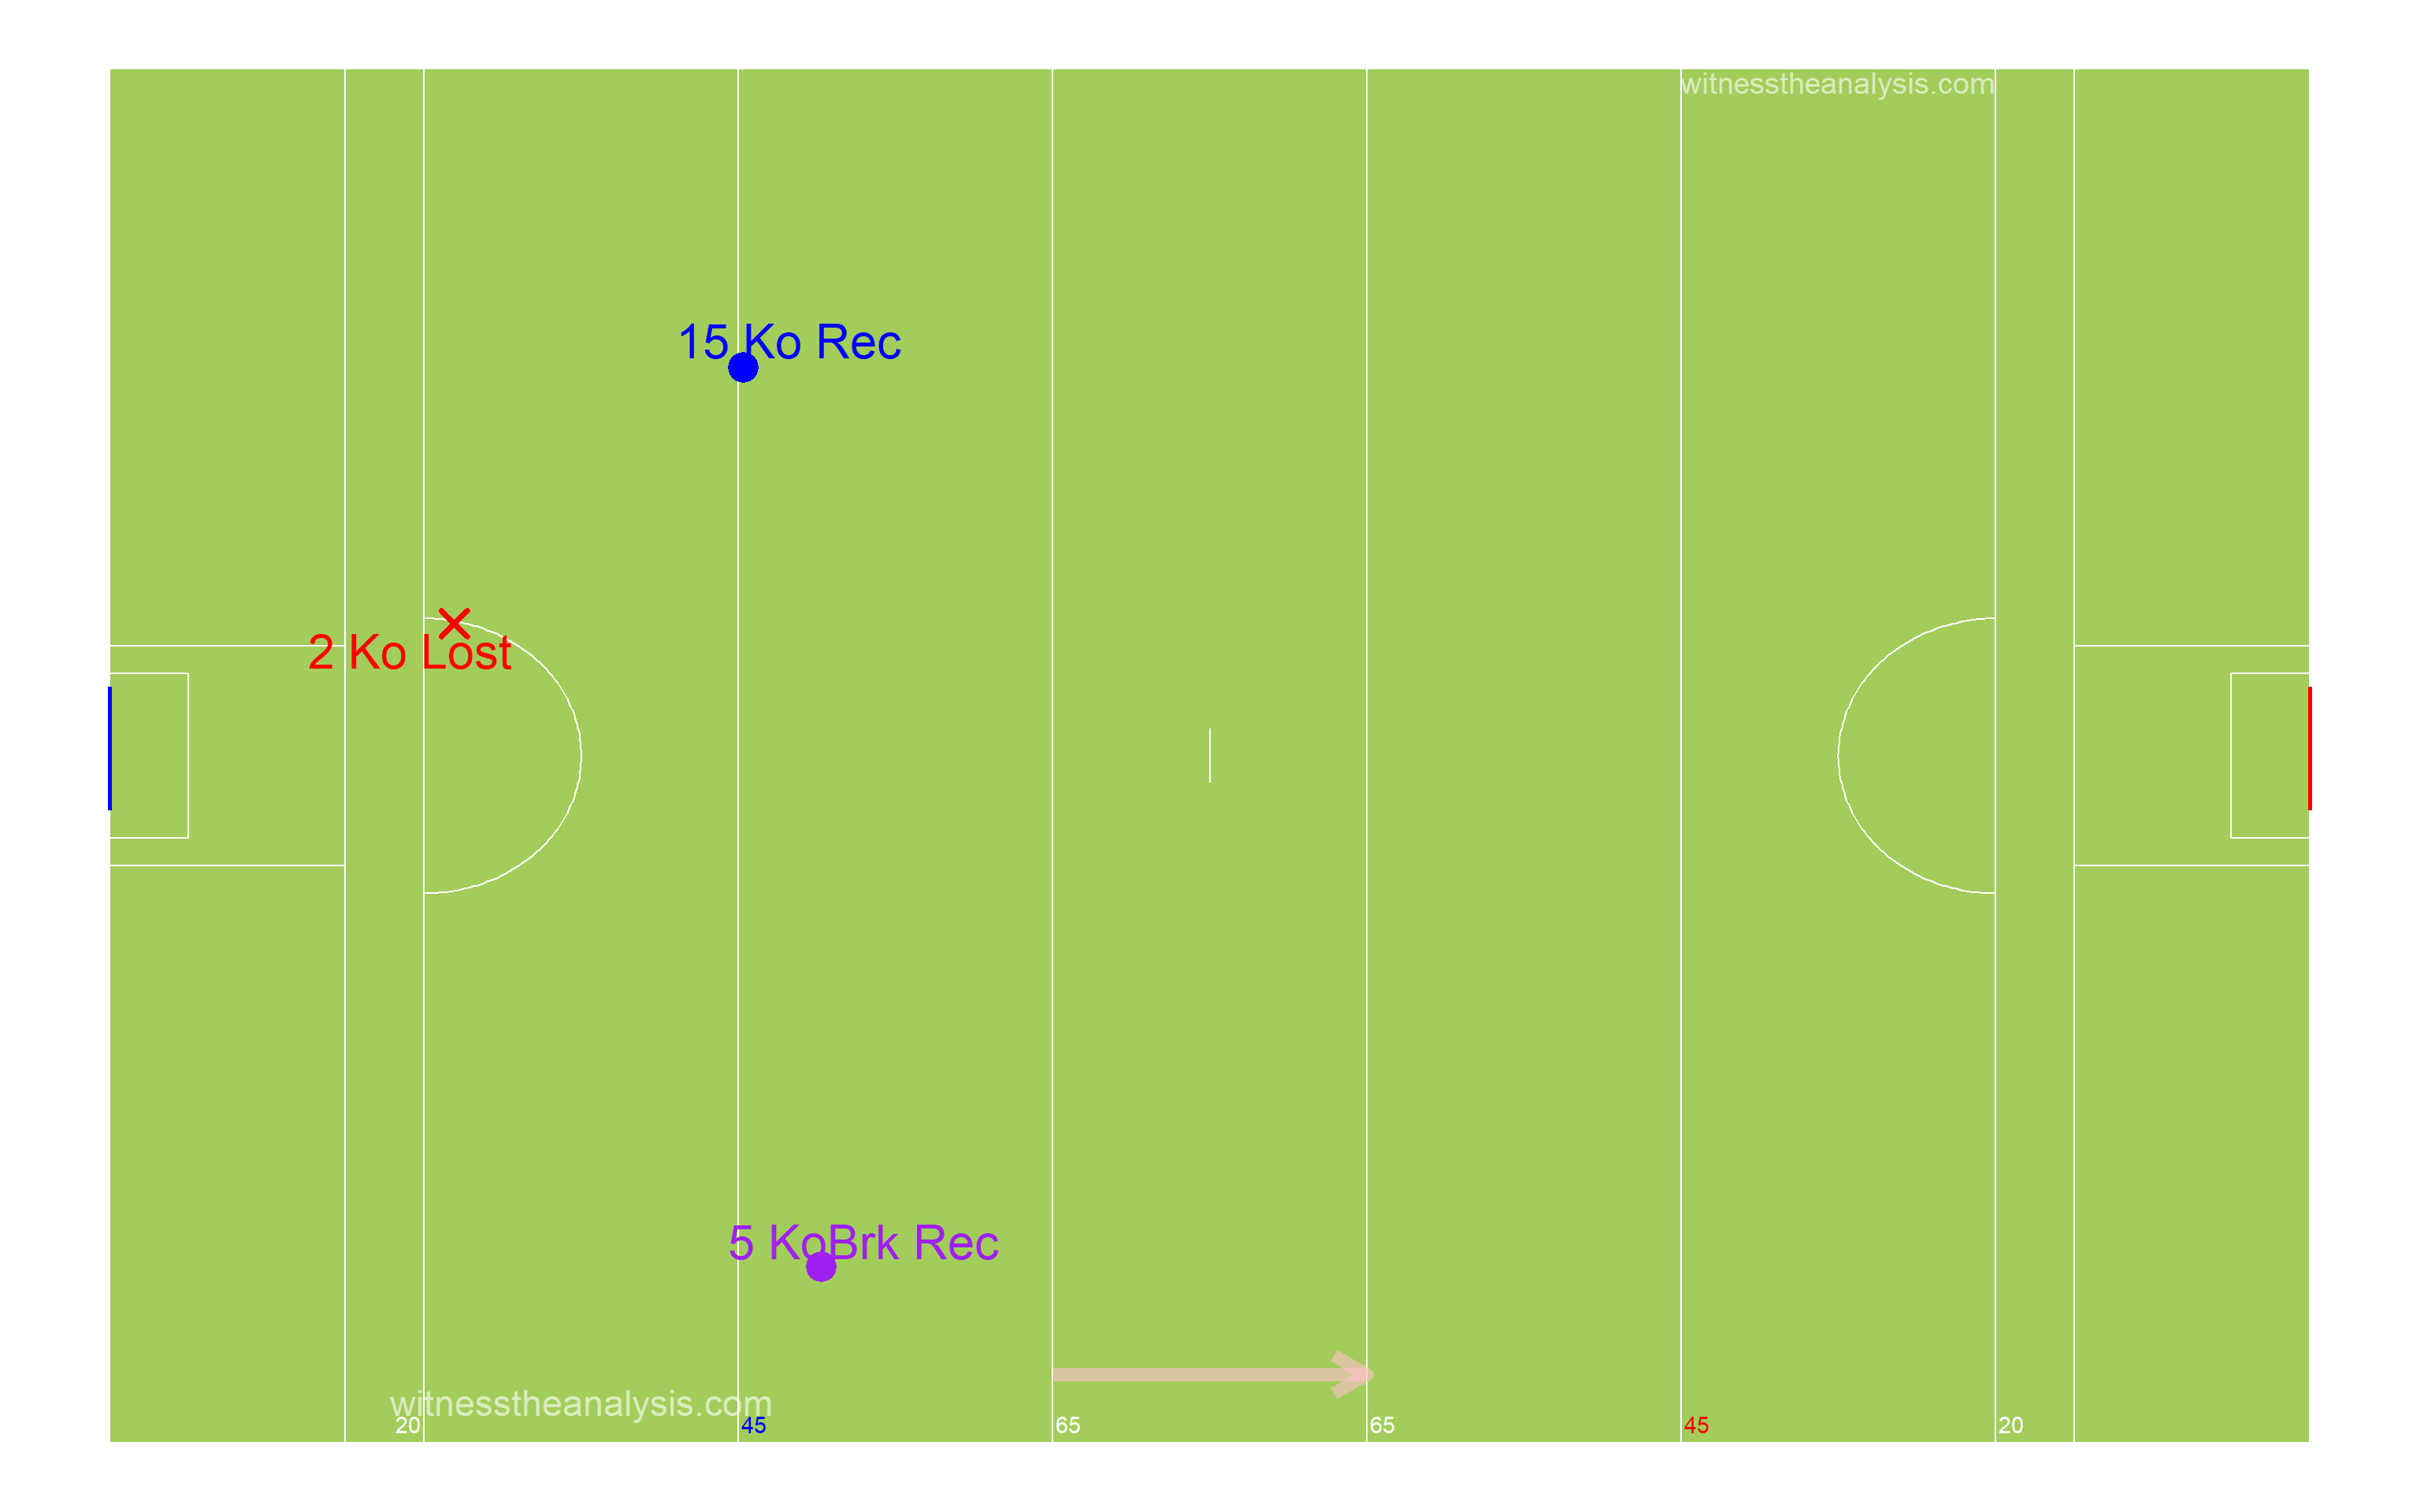
###Period 3
###Period 4
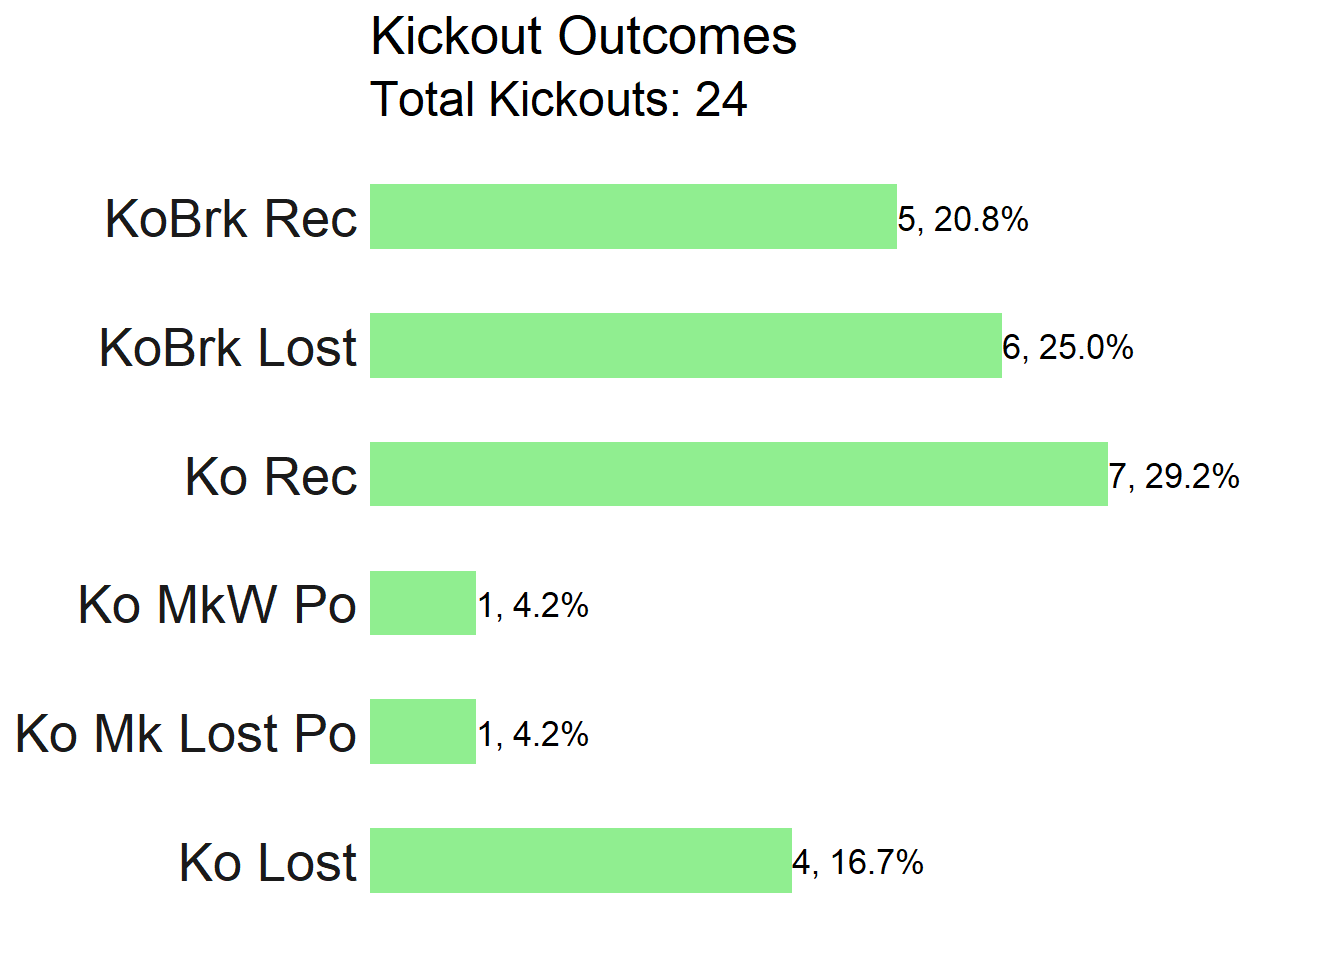
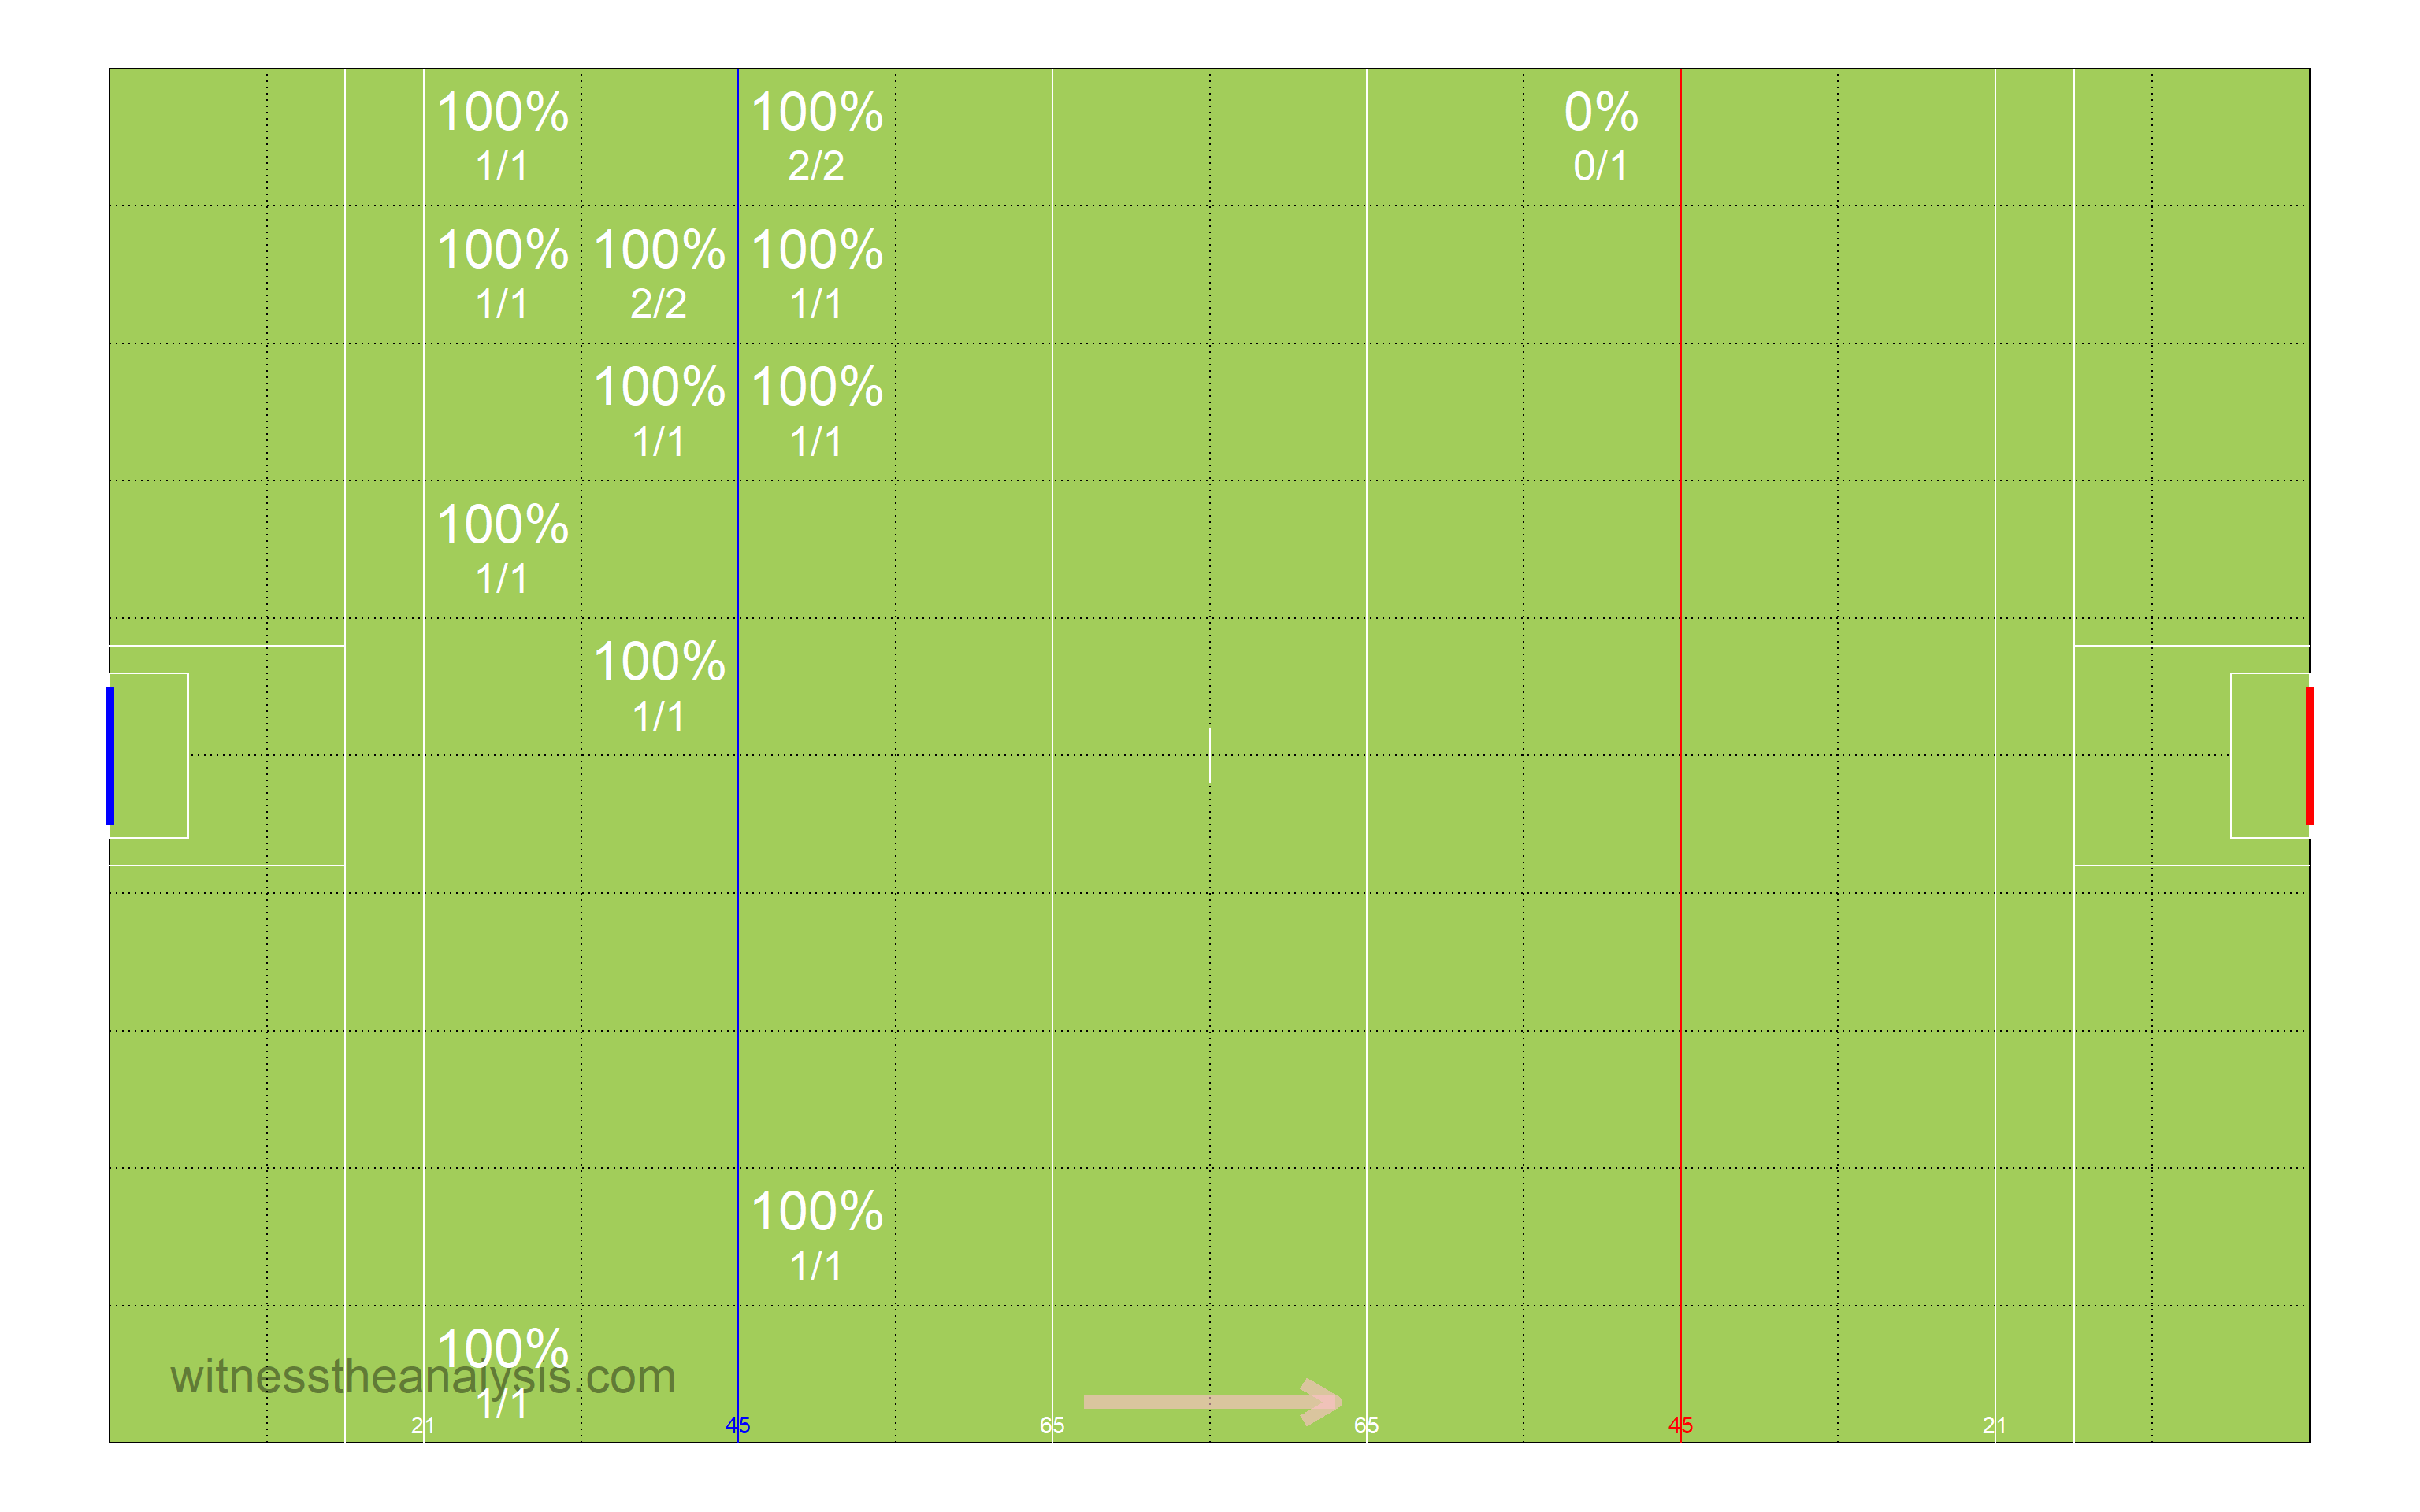
###Kickout Efficiency 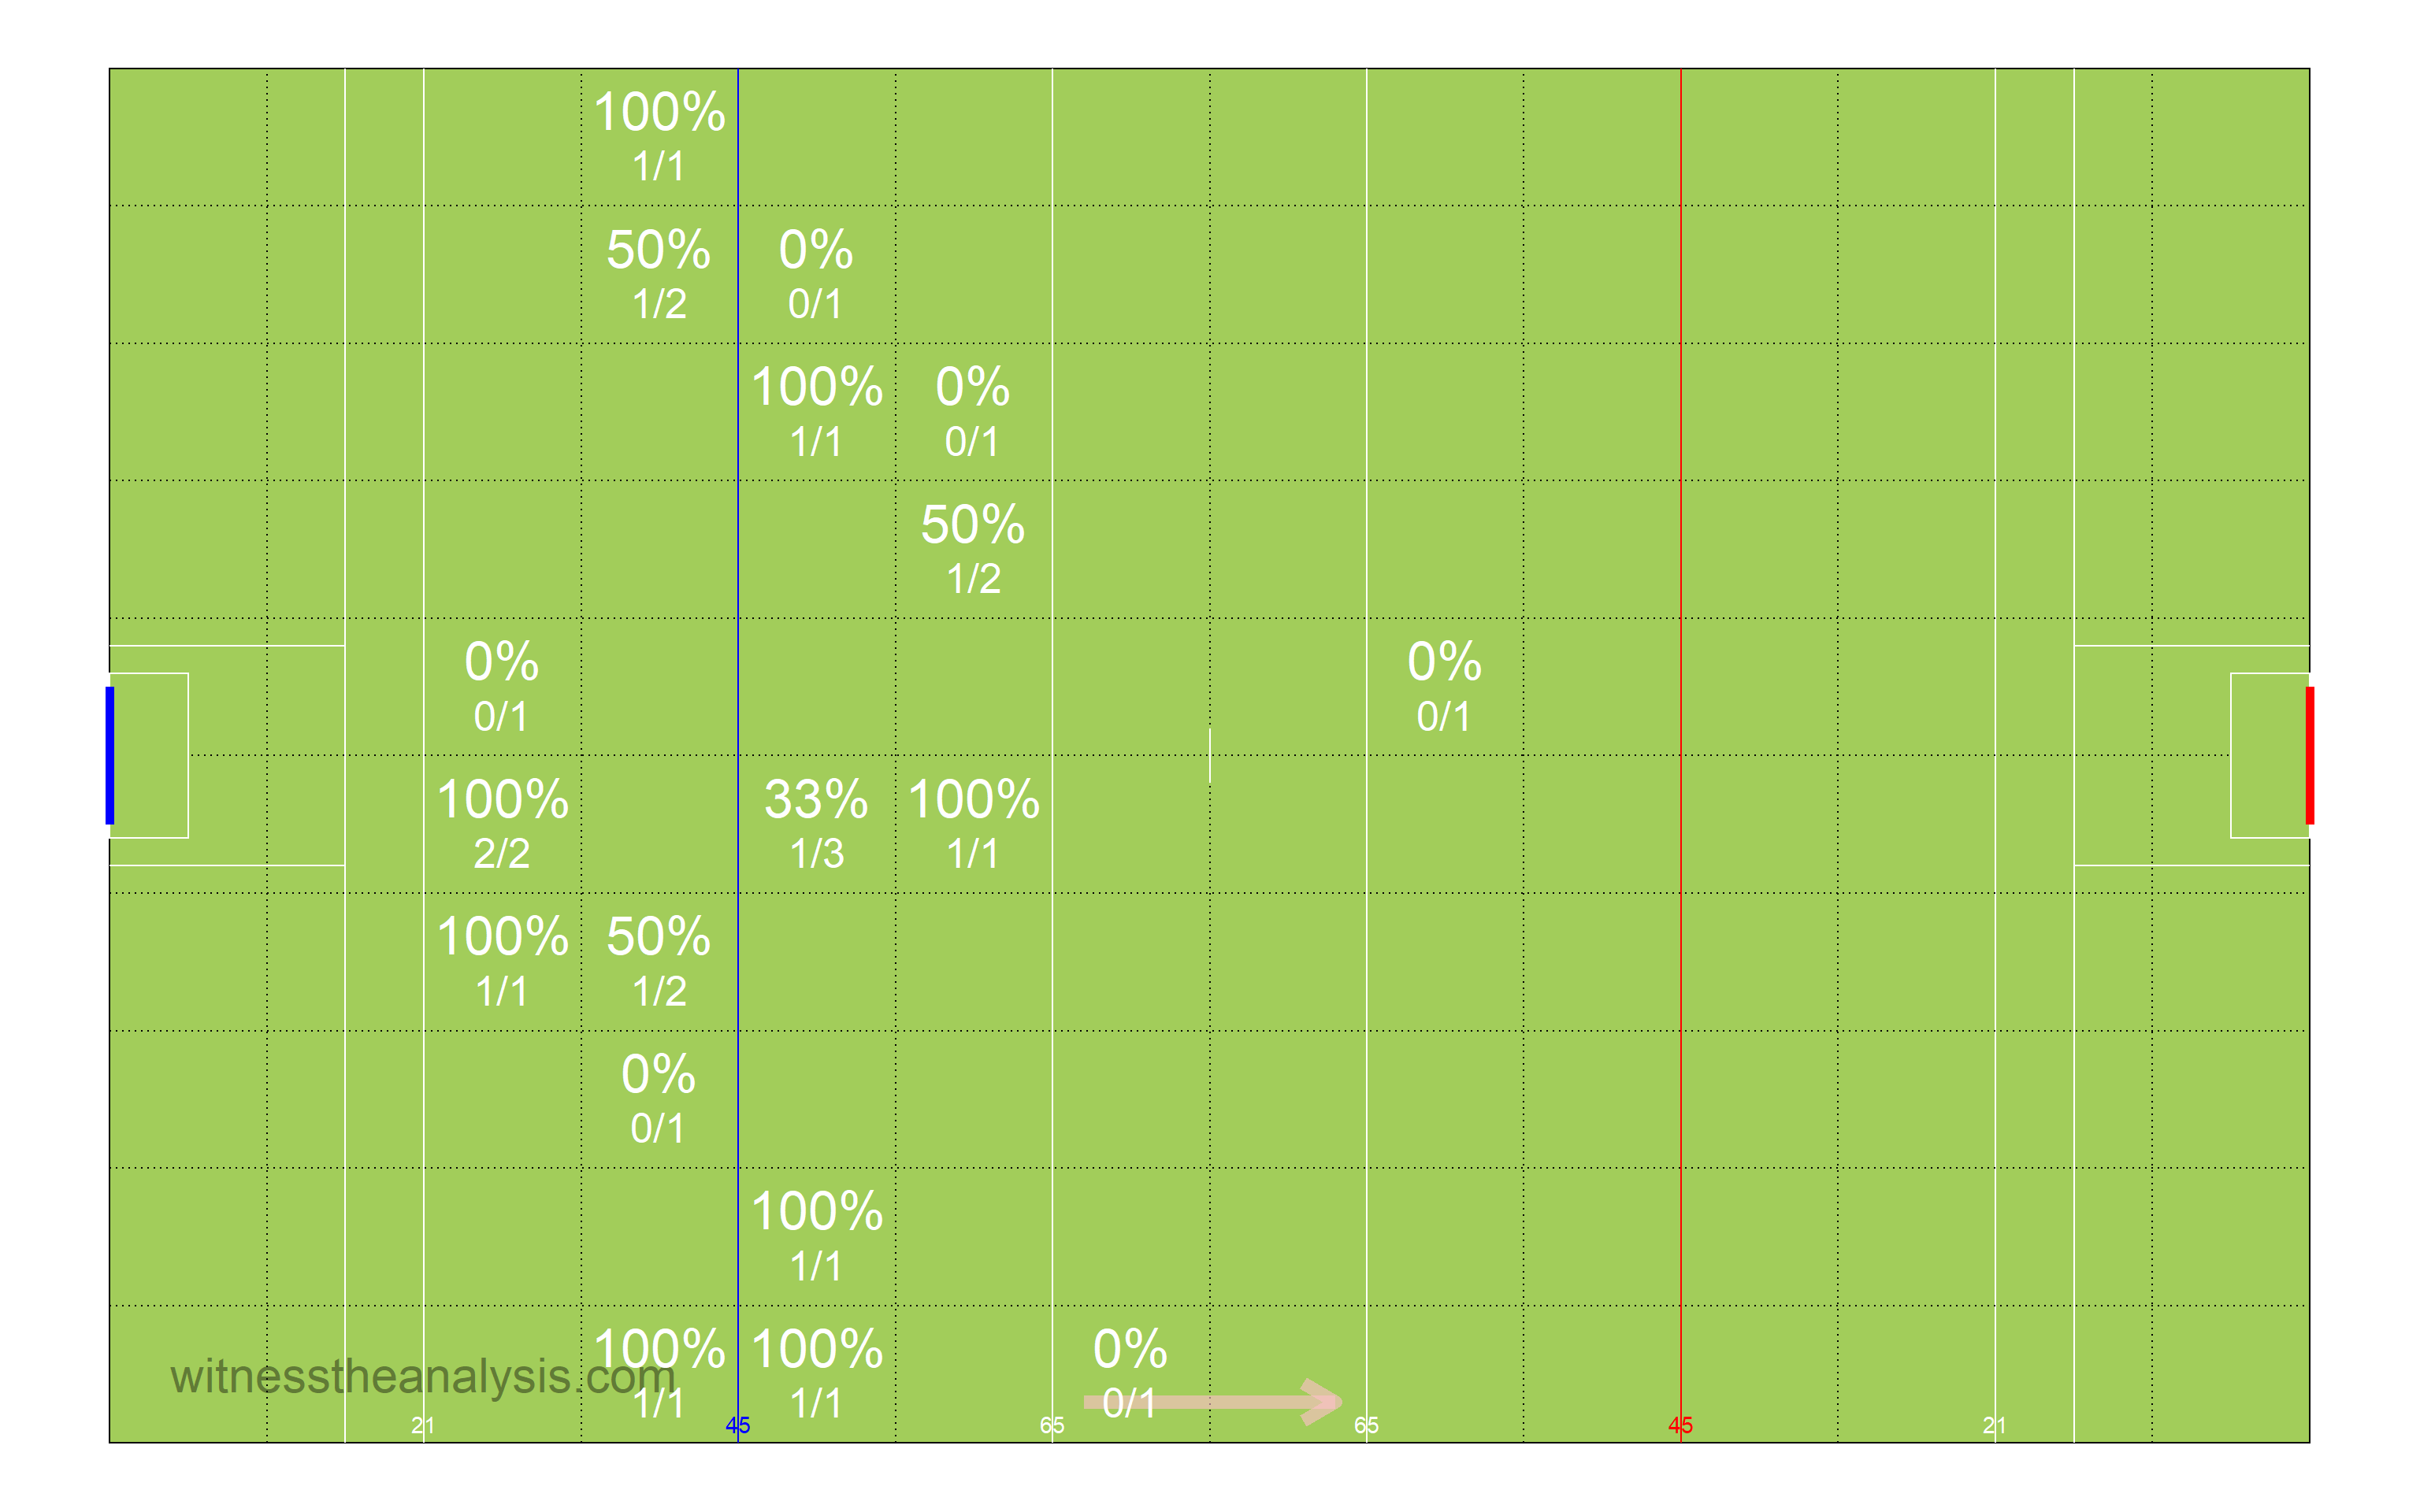
###Kickout Network - Thomas Davis 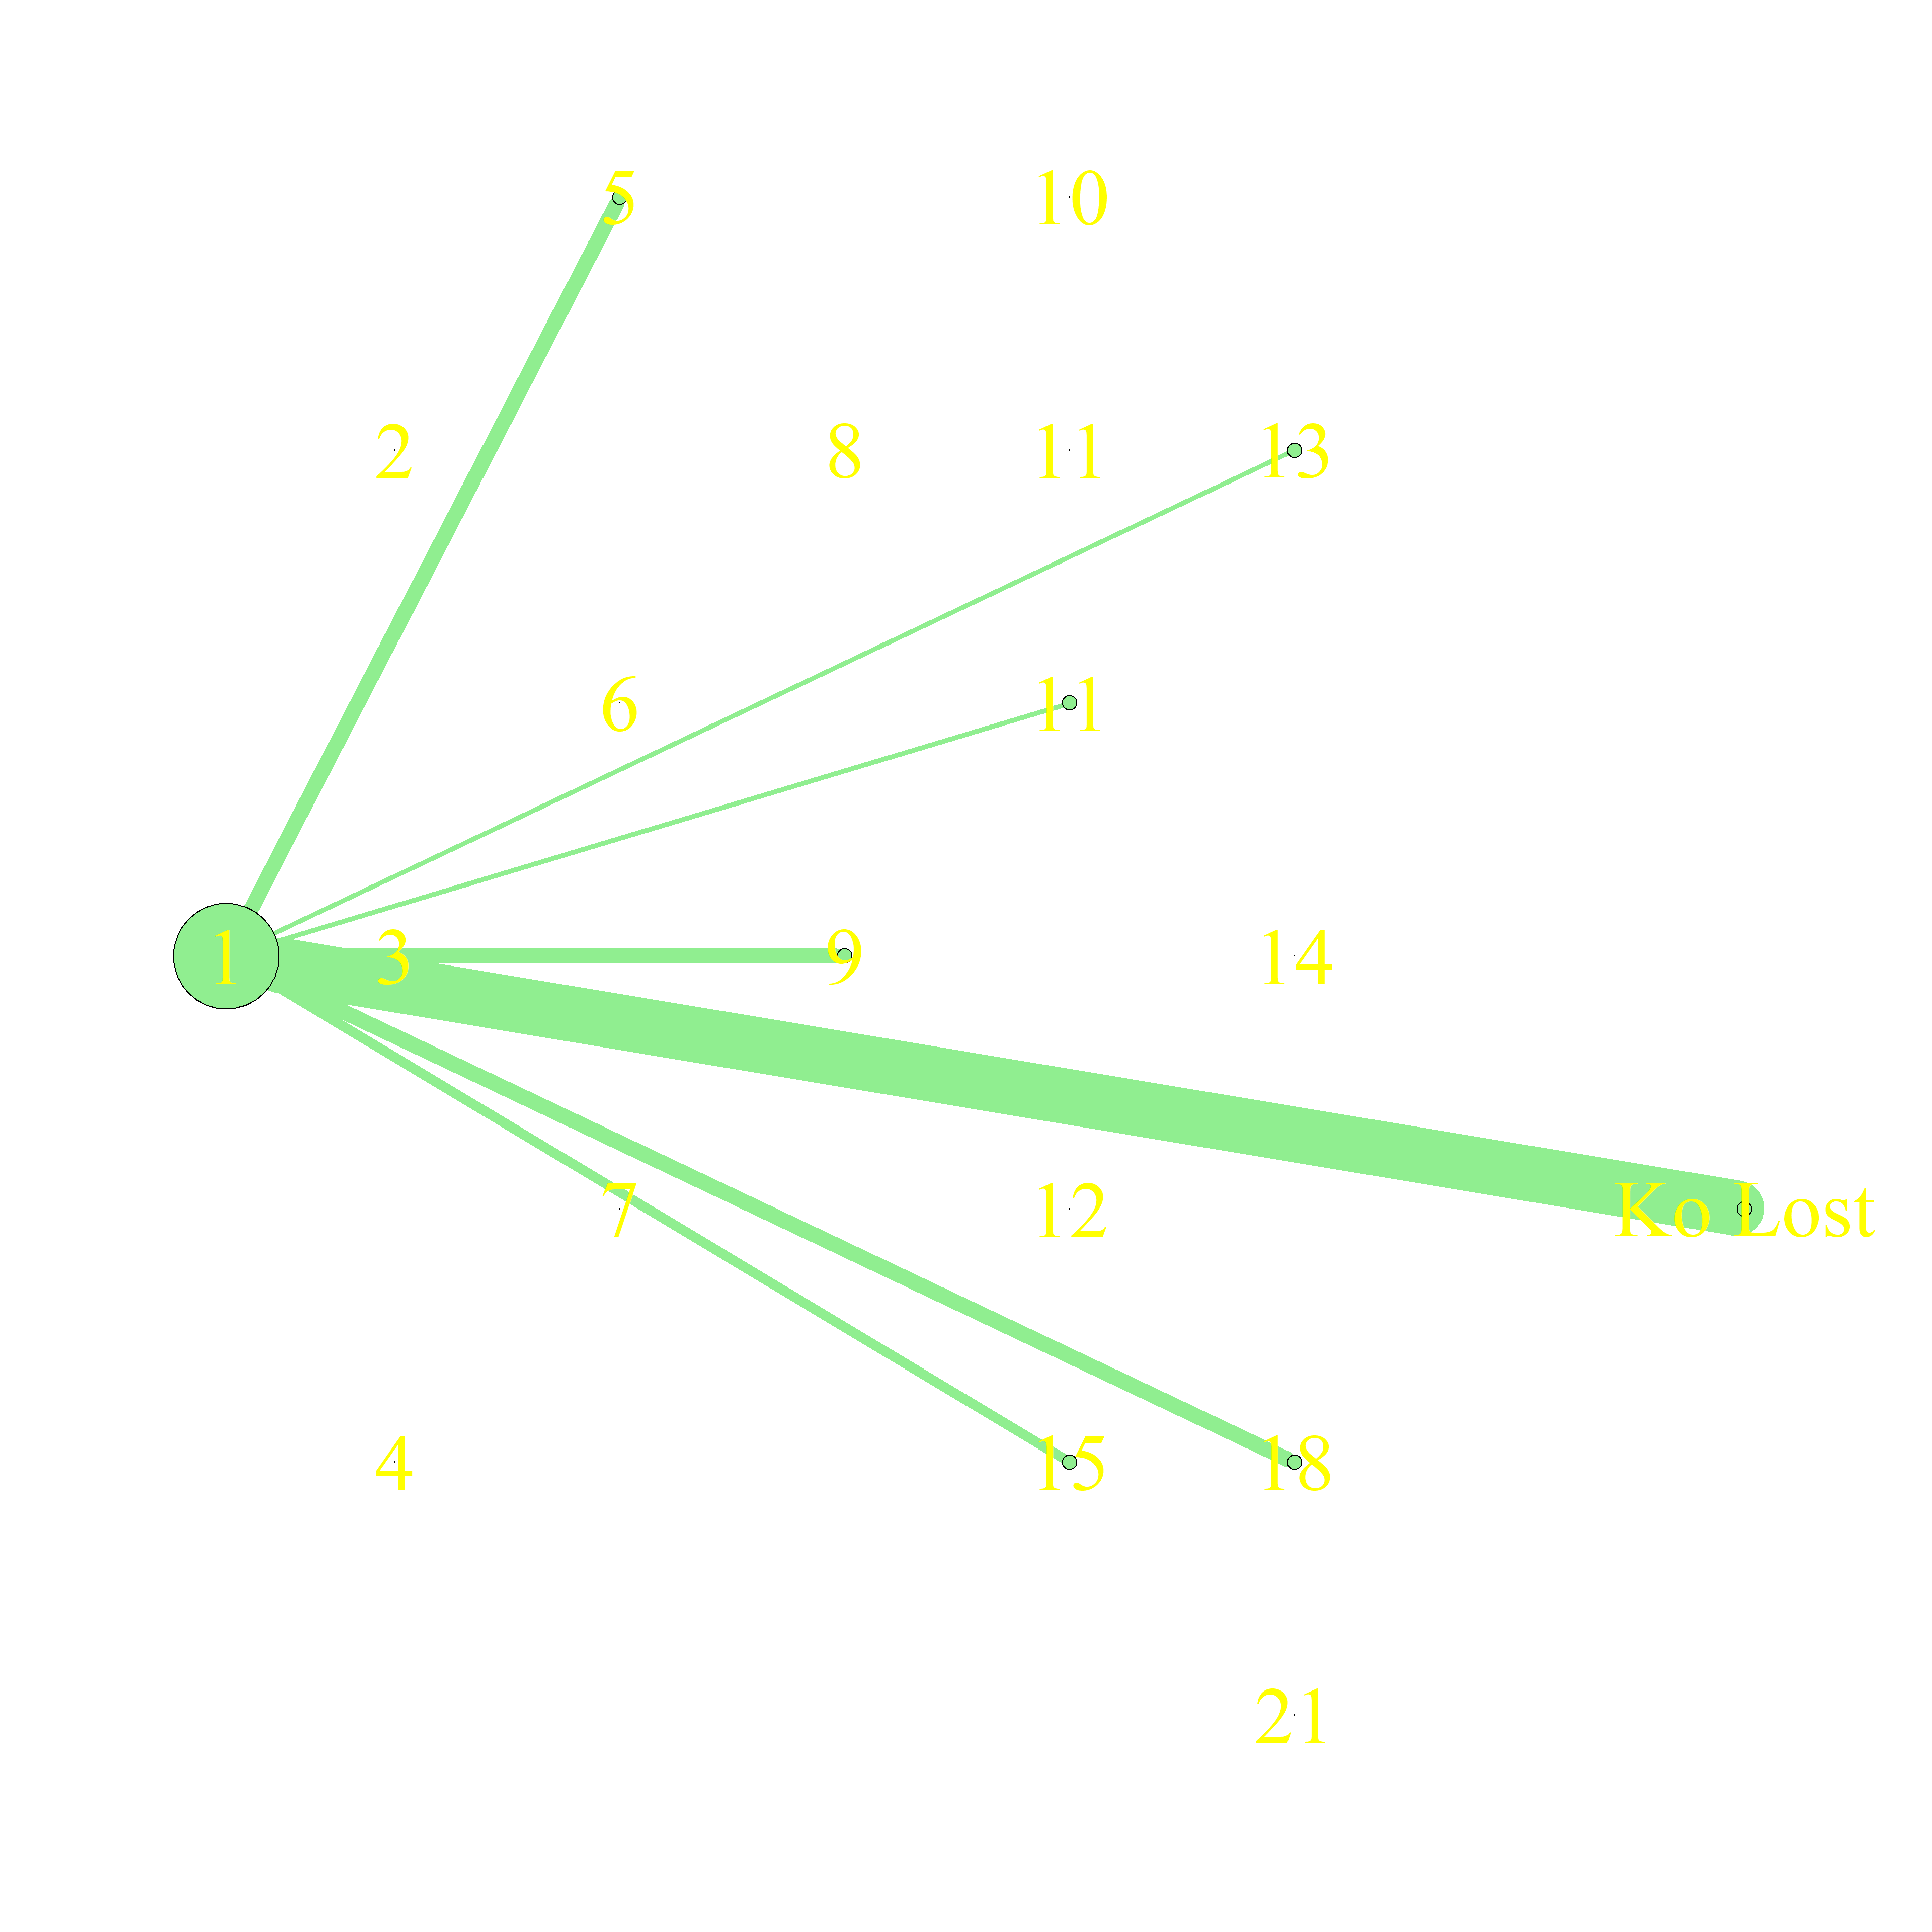
###Kickout Density 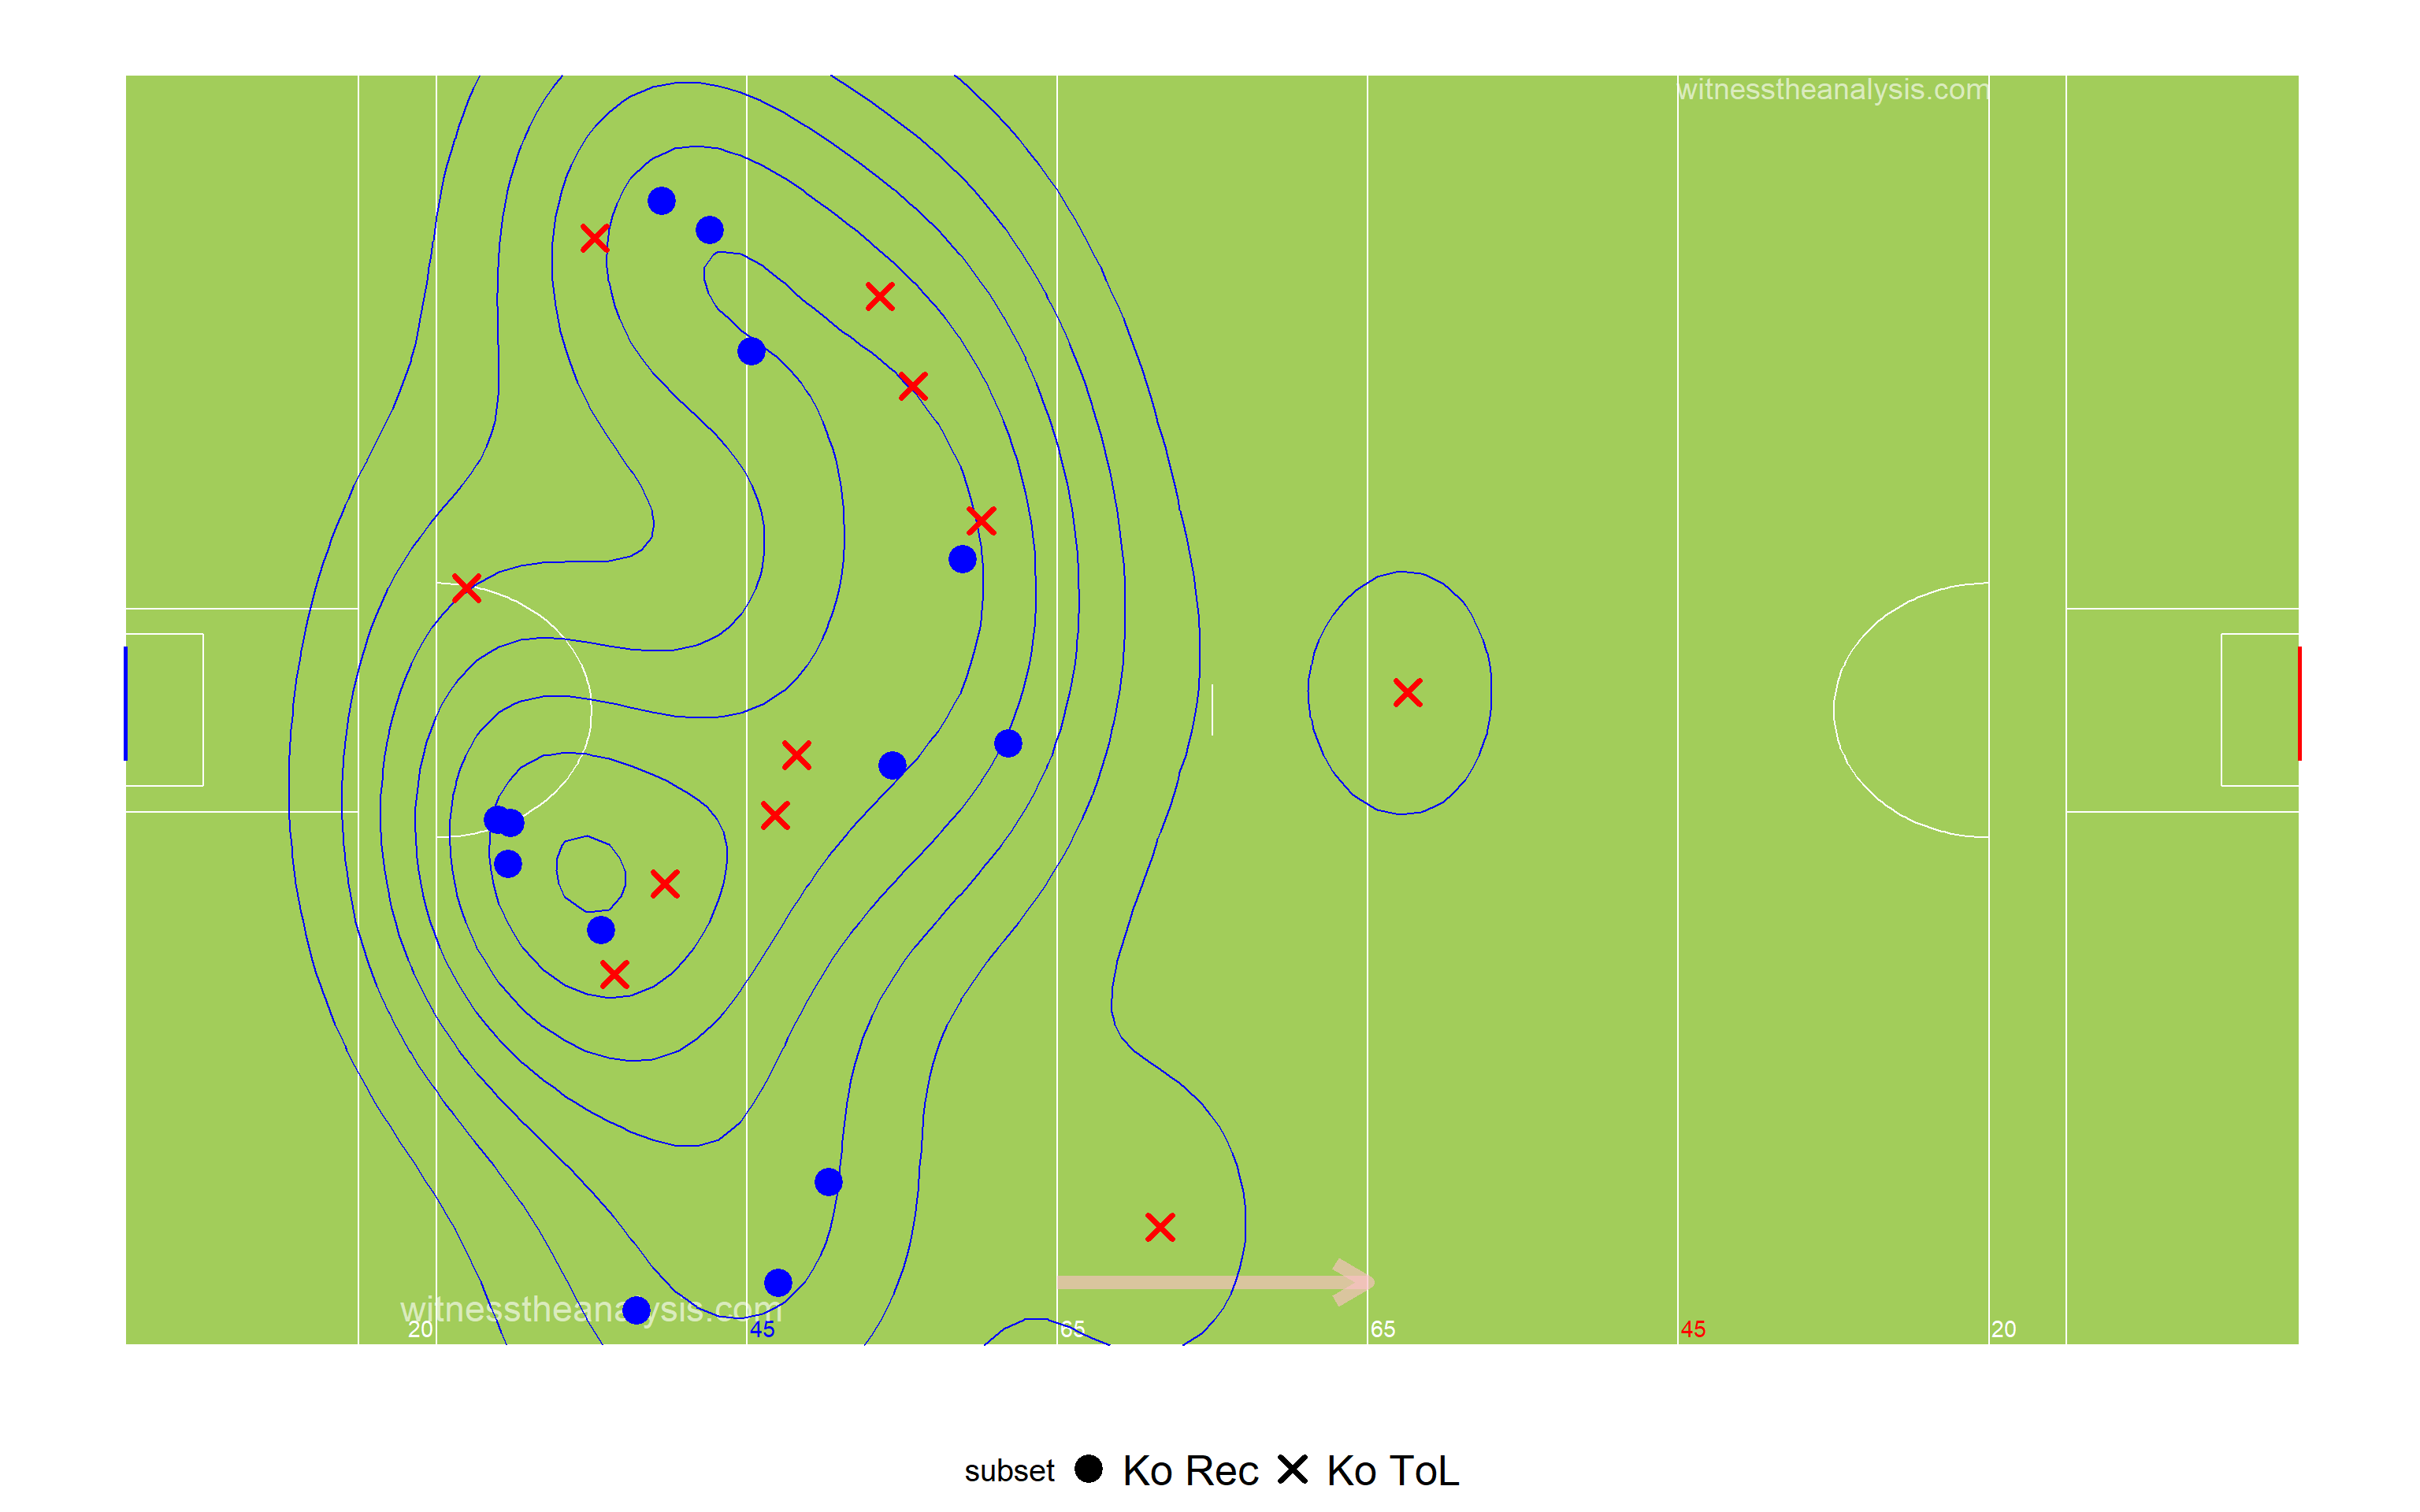
###Ballyboden
###Period 1 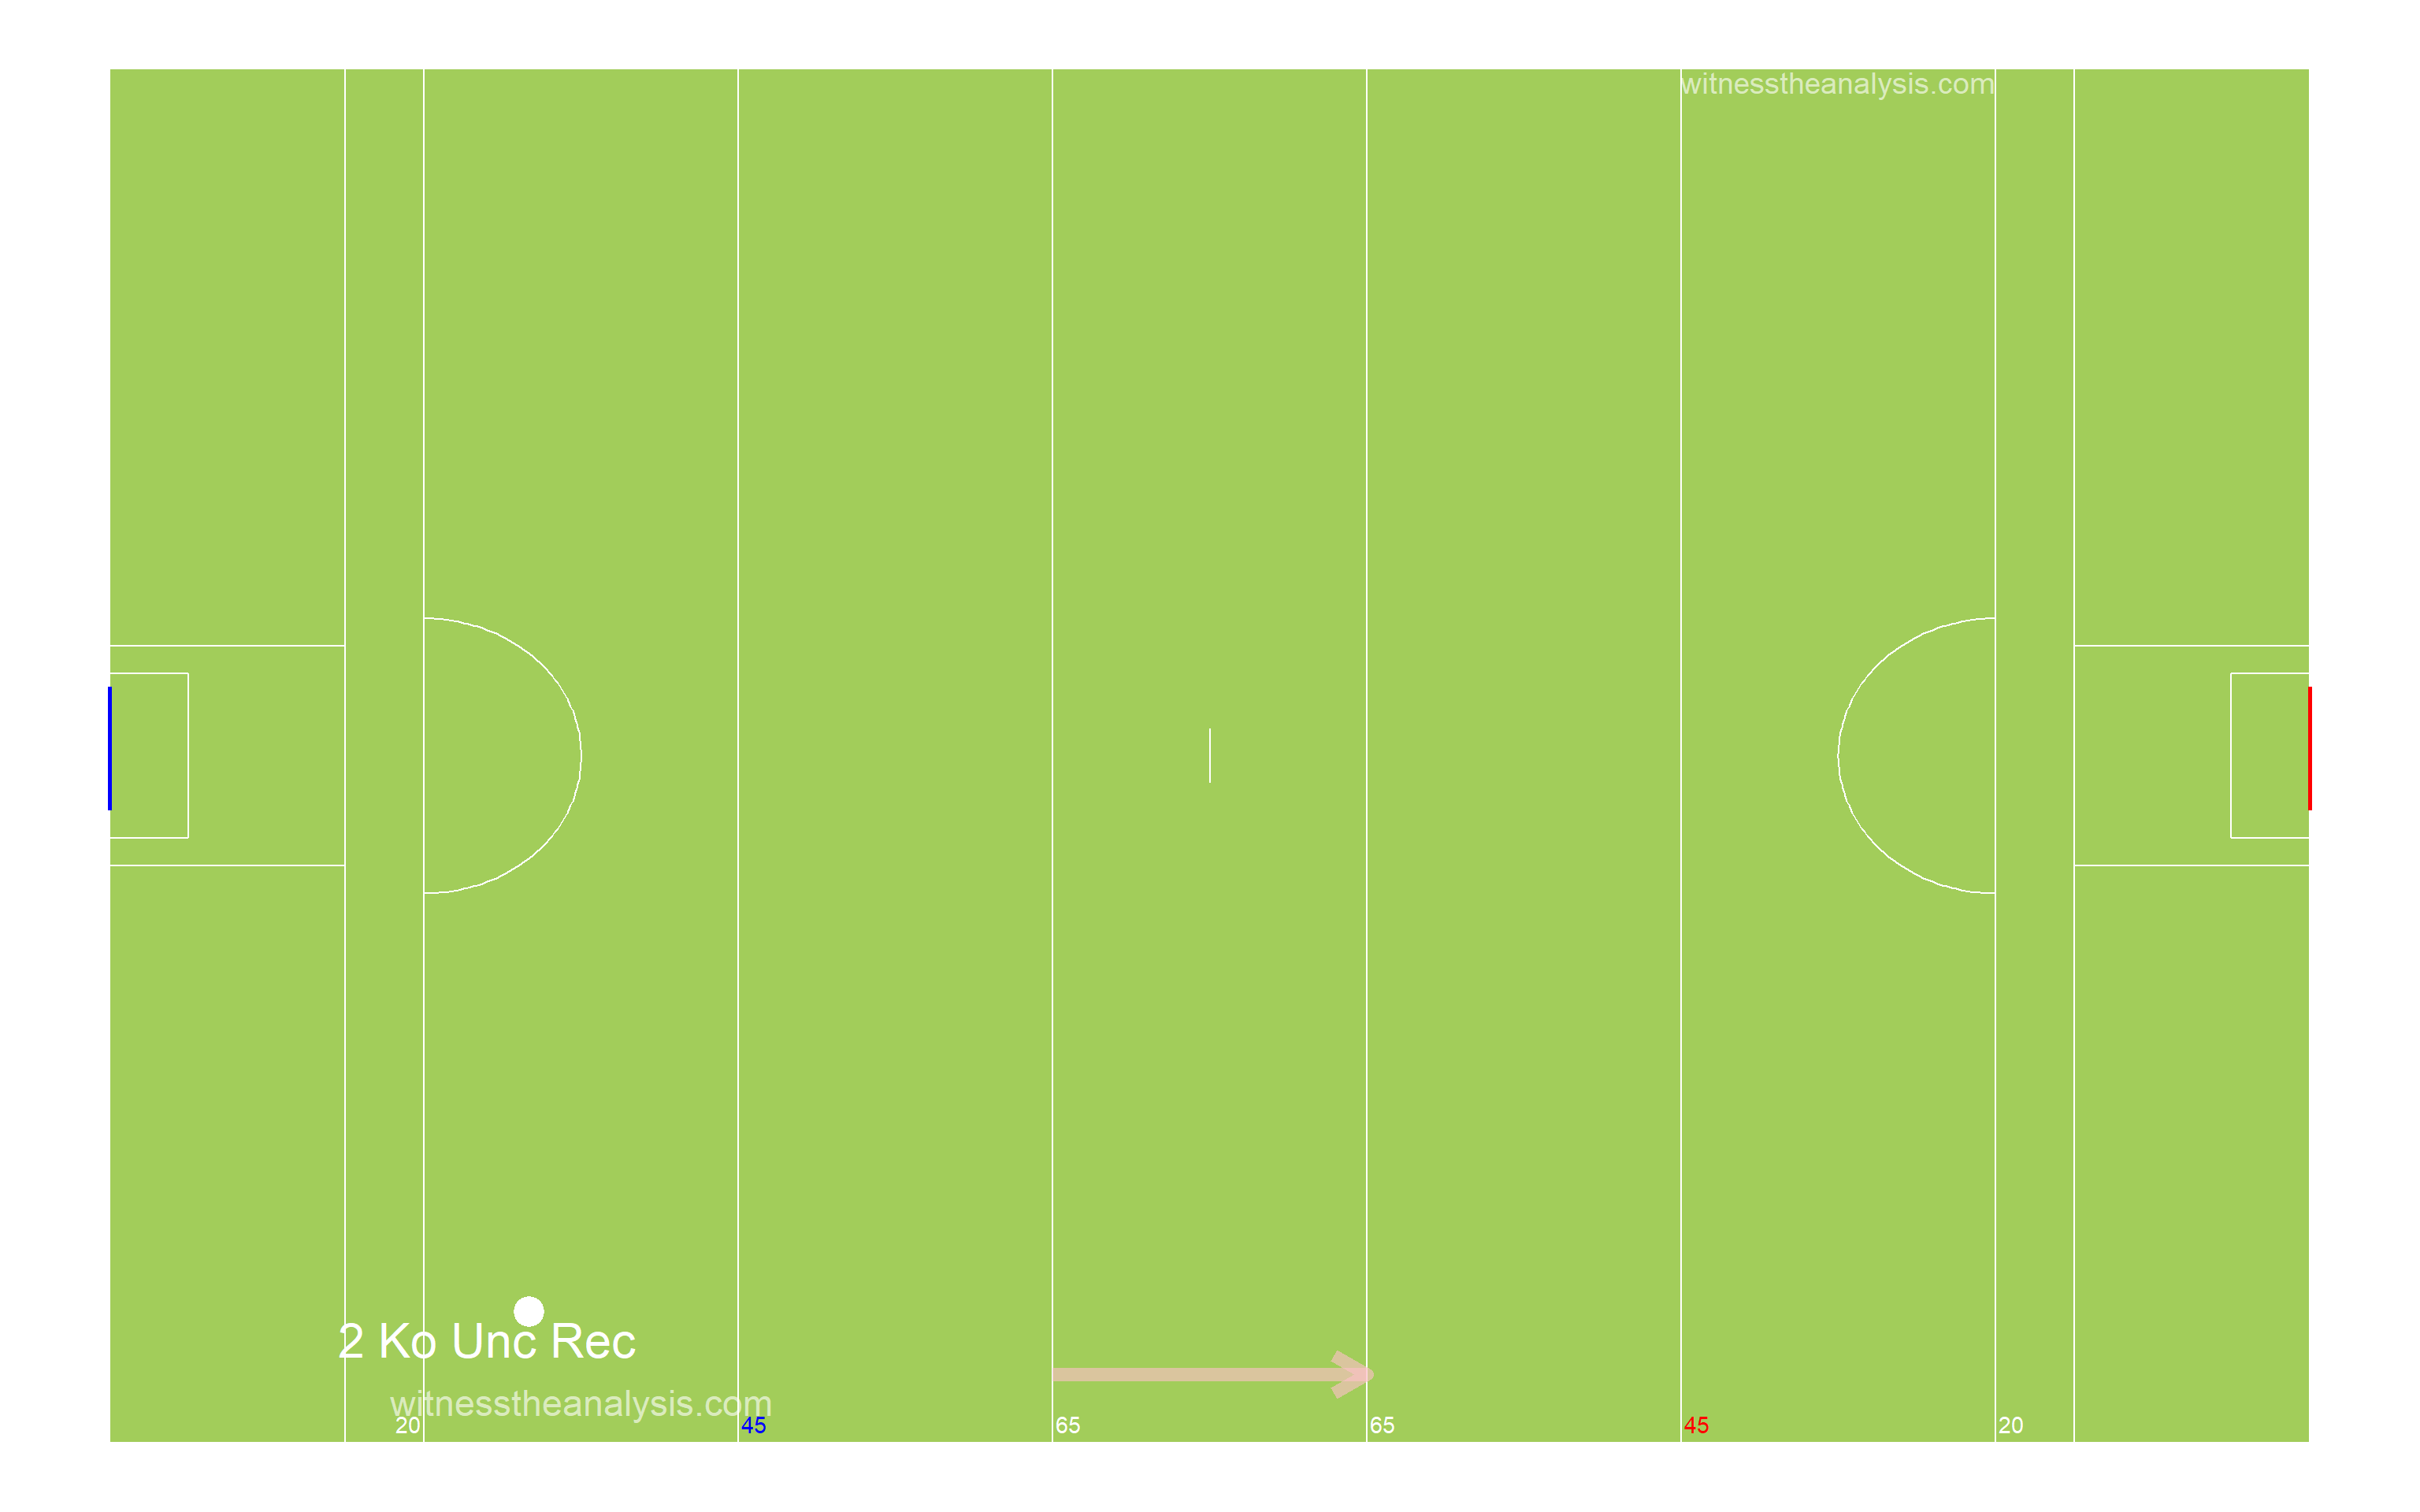
###Period 2 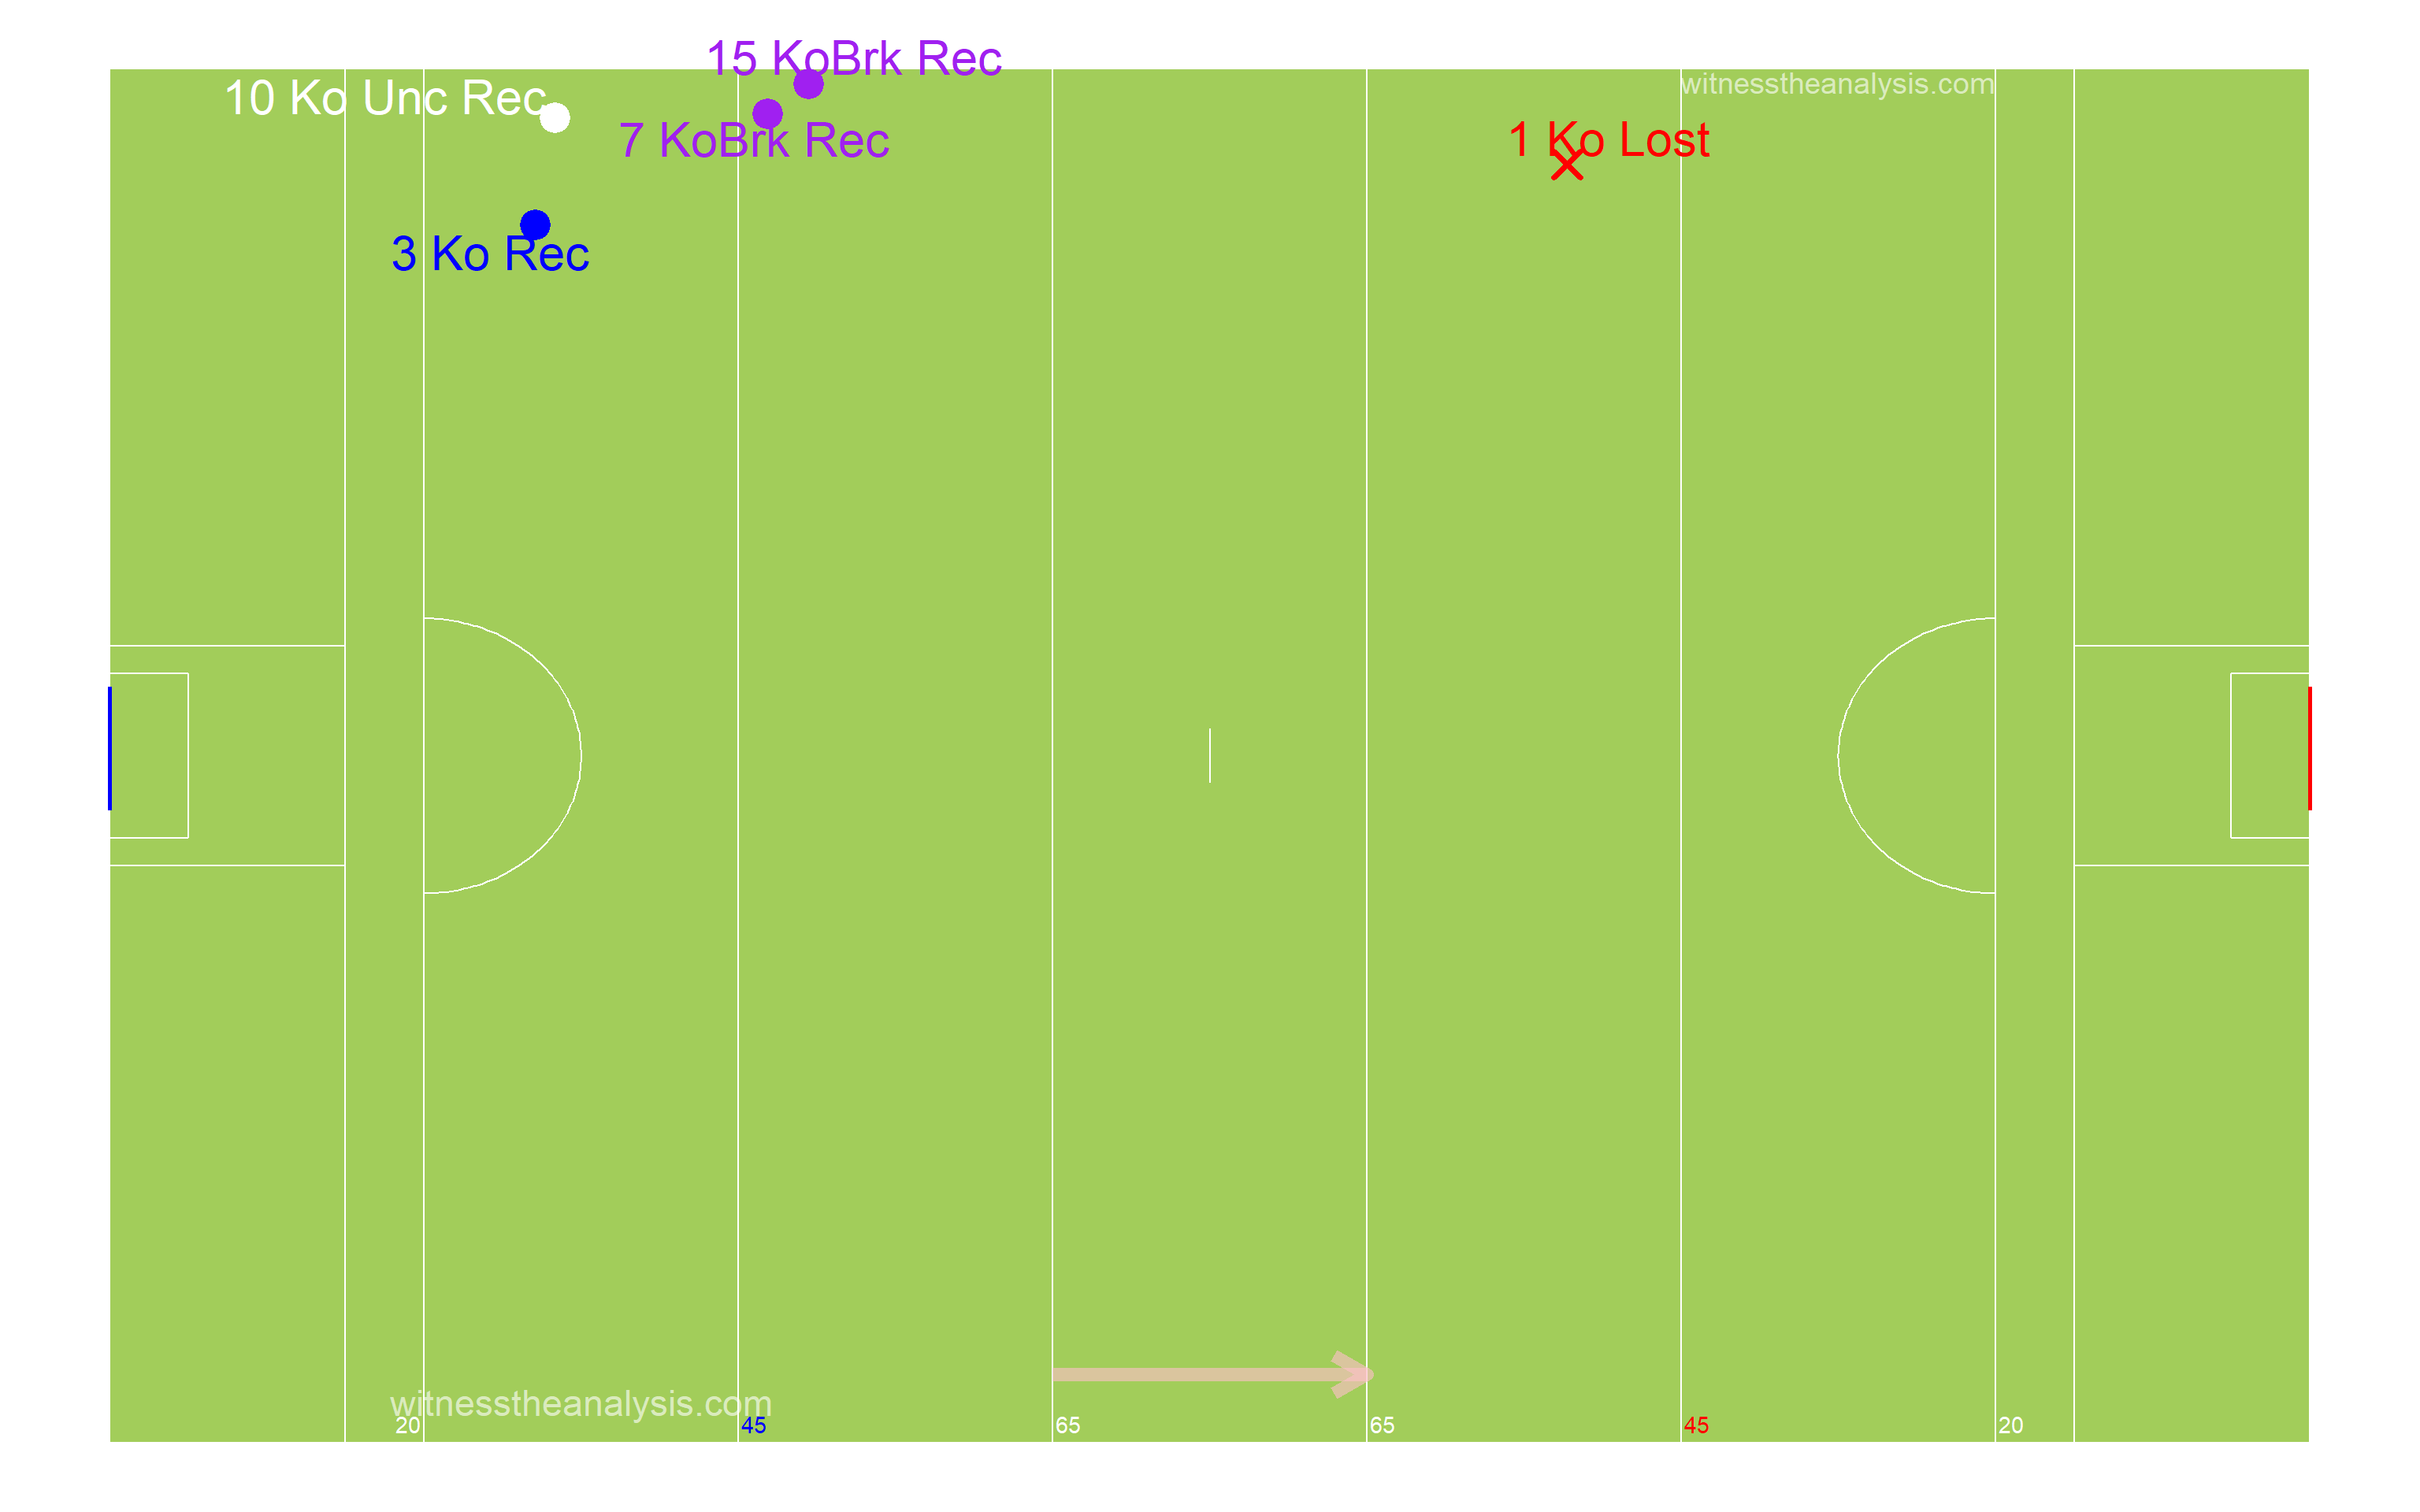
###Period 3
###Period 4
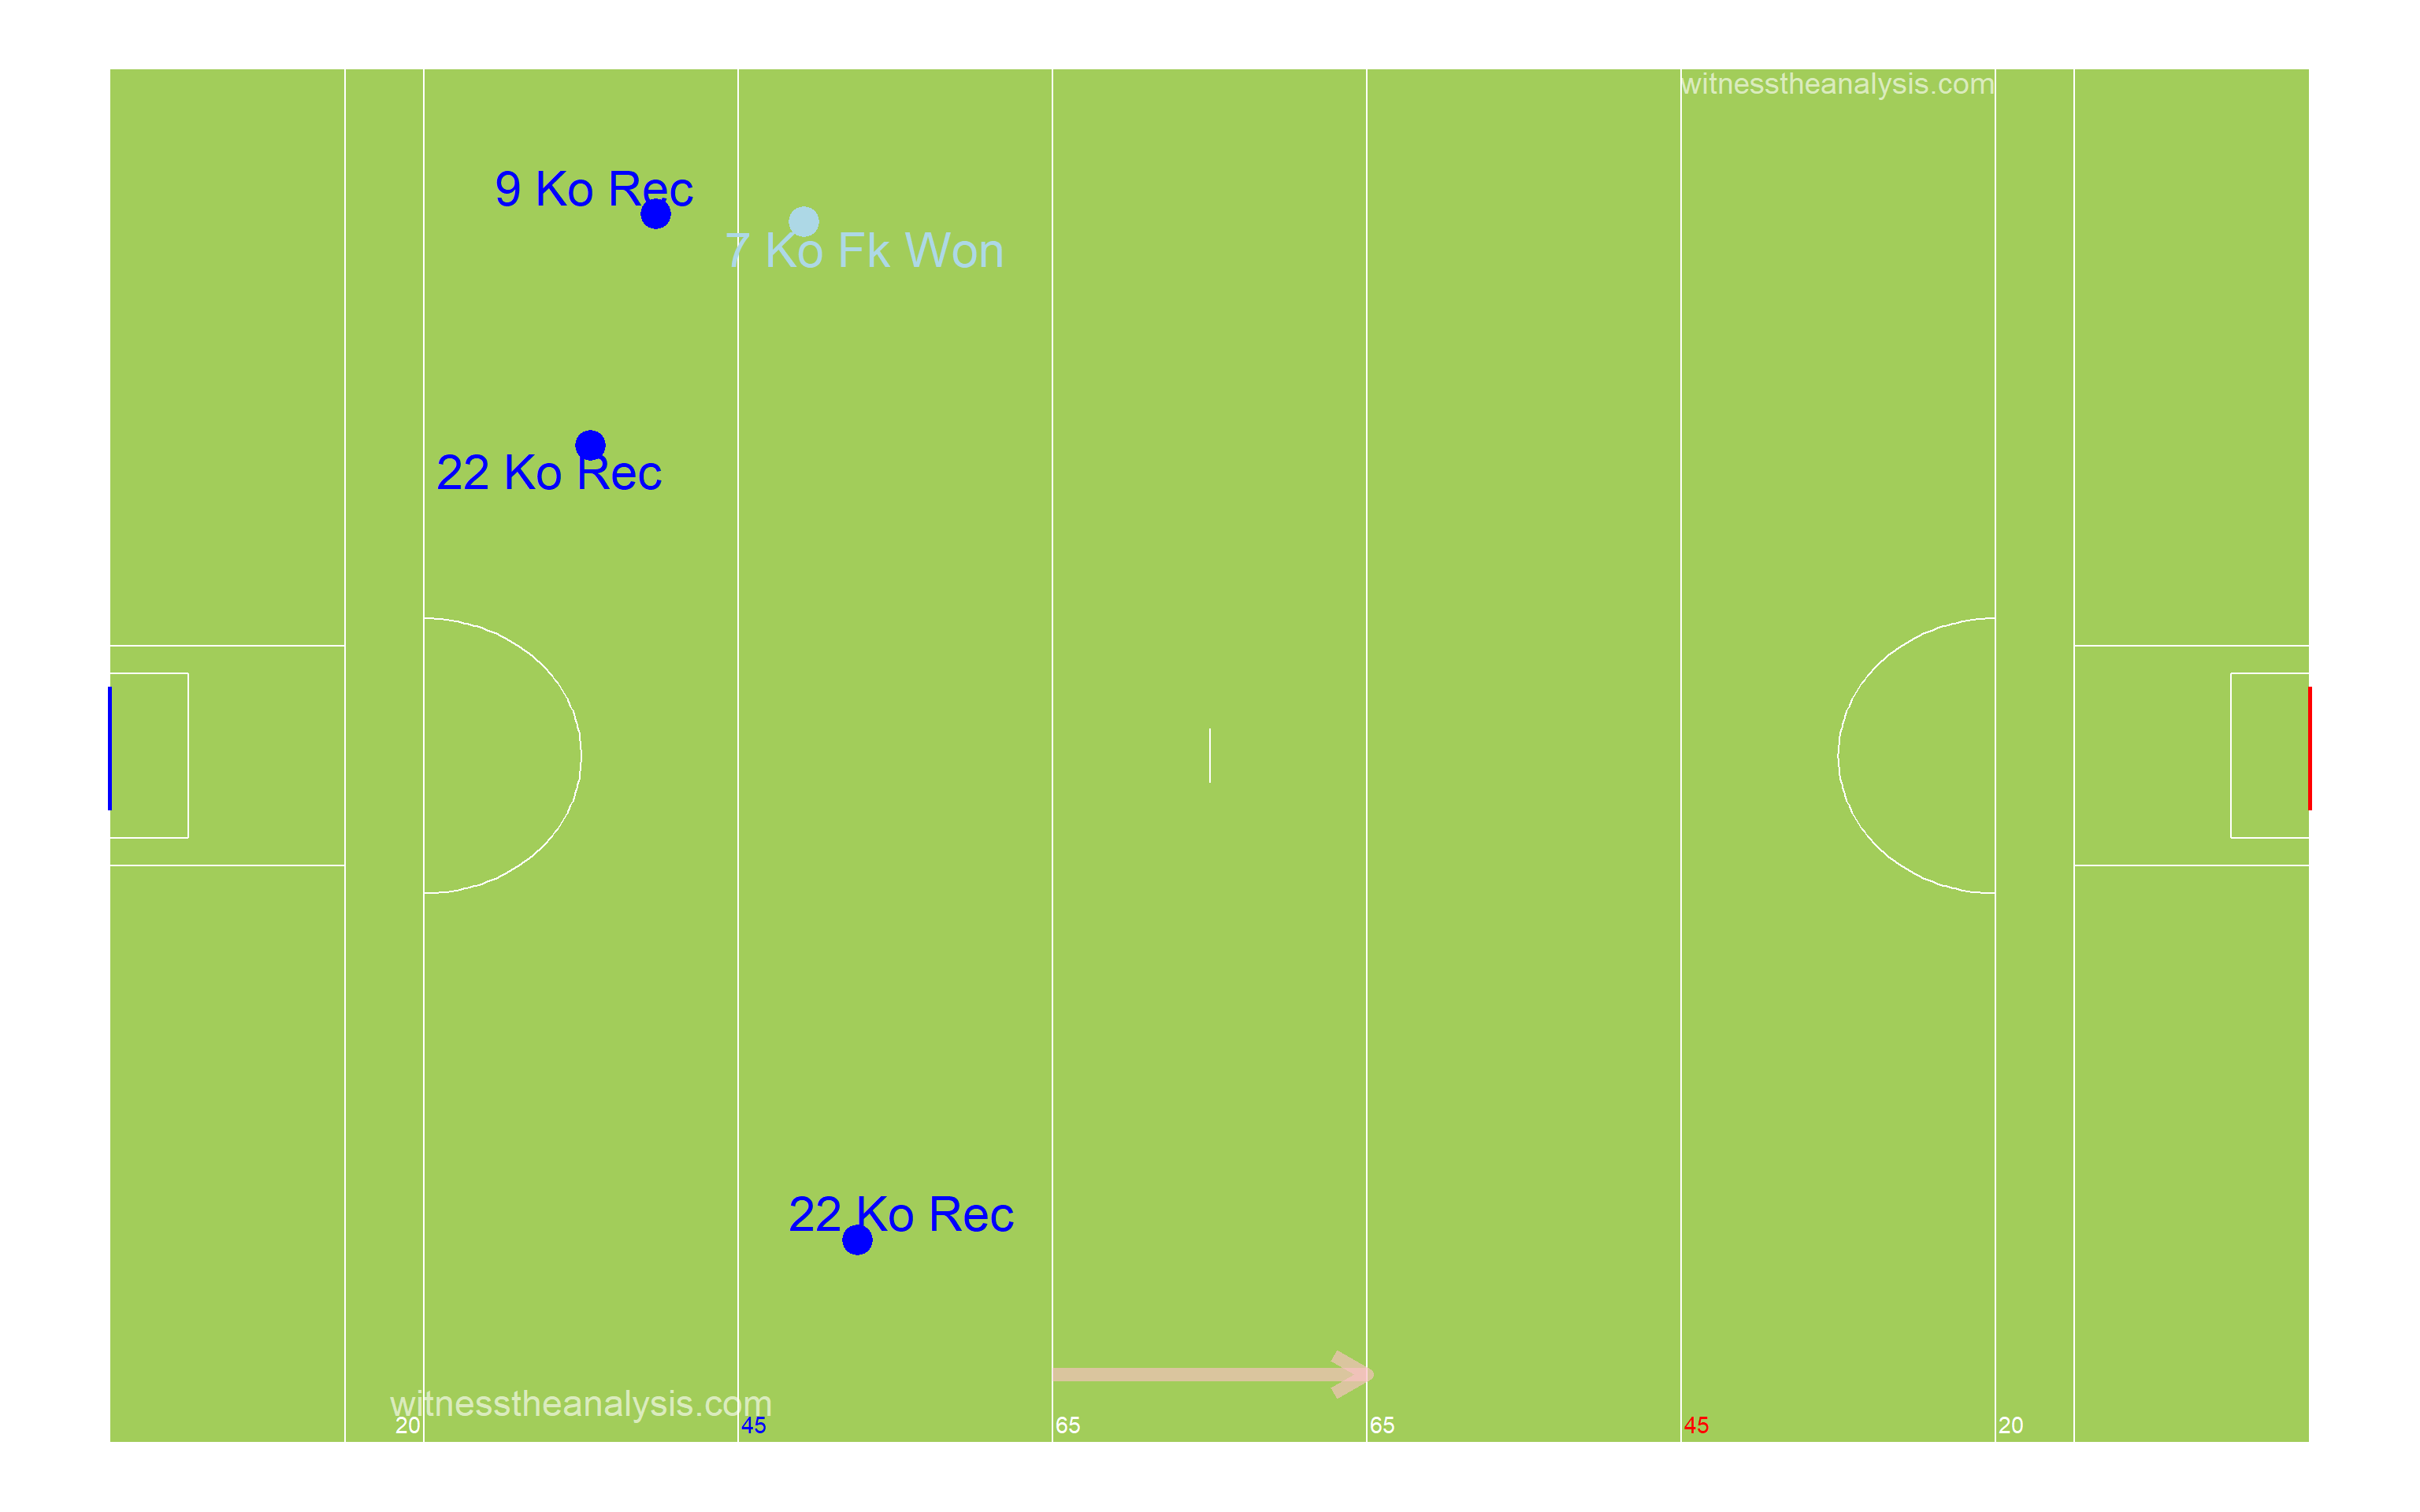
###Kickout Efficiency
###Kickout Network - Ballyboden 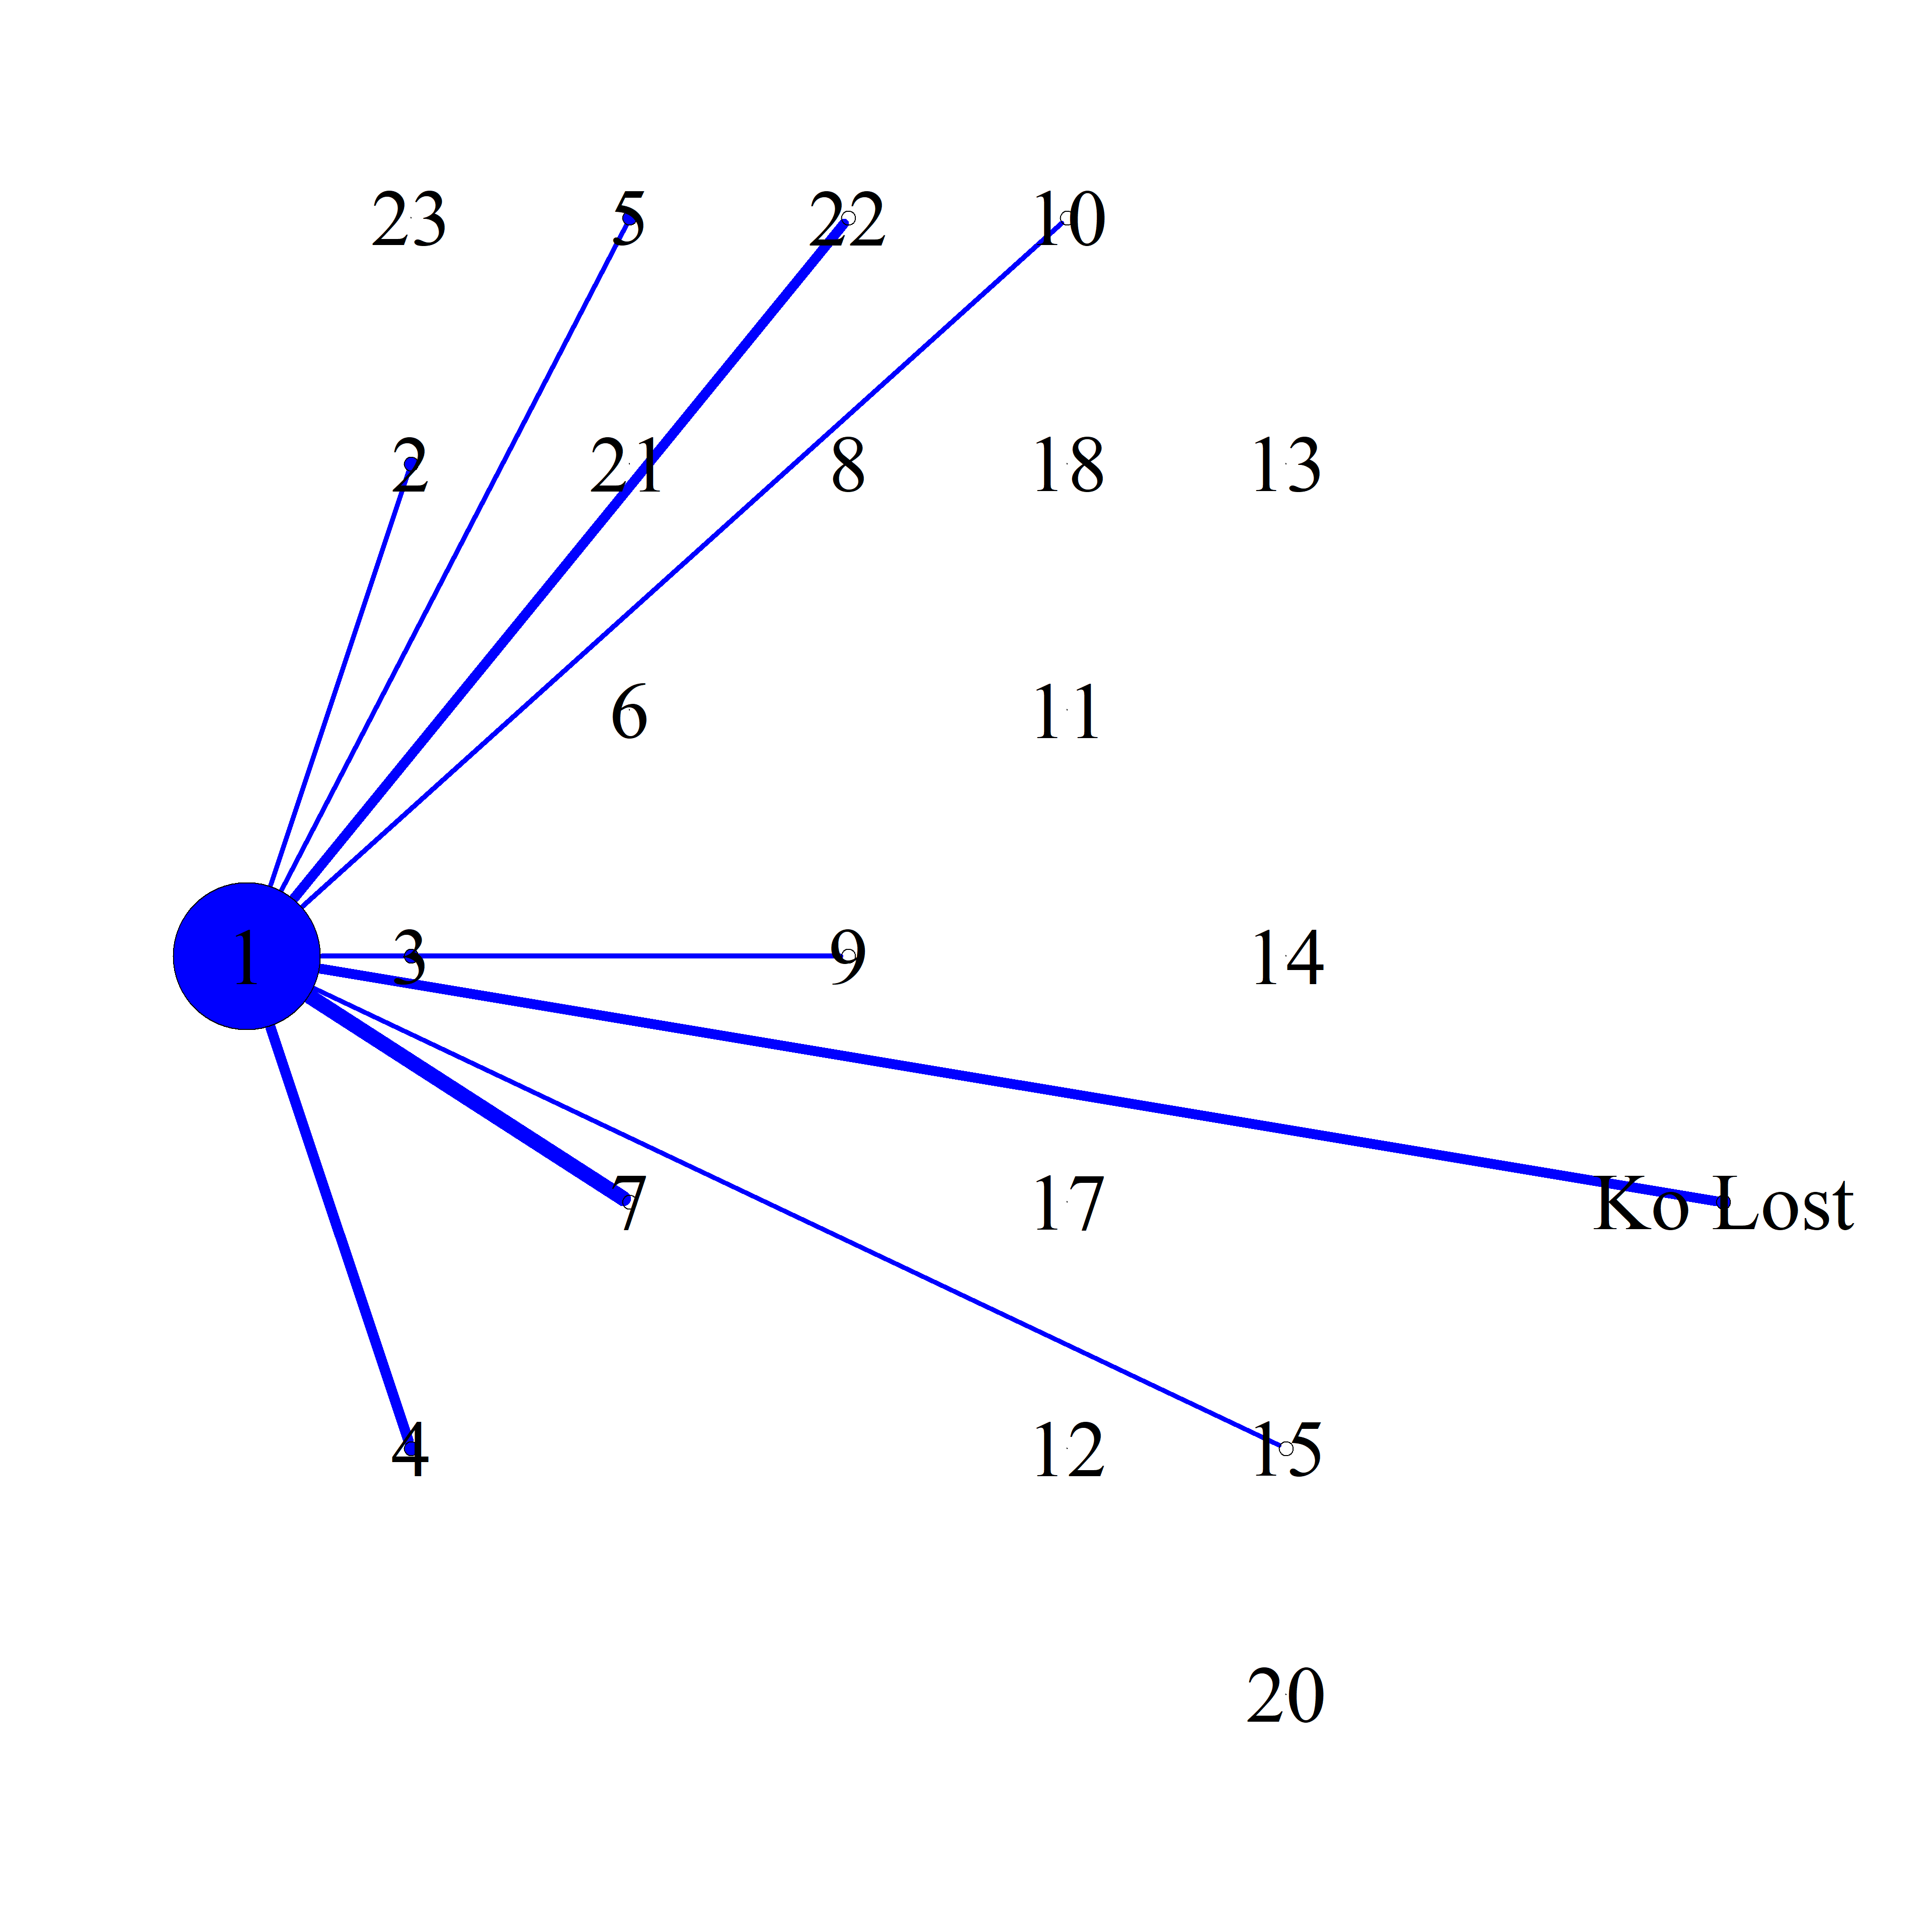
###Kickout Density 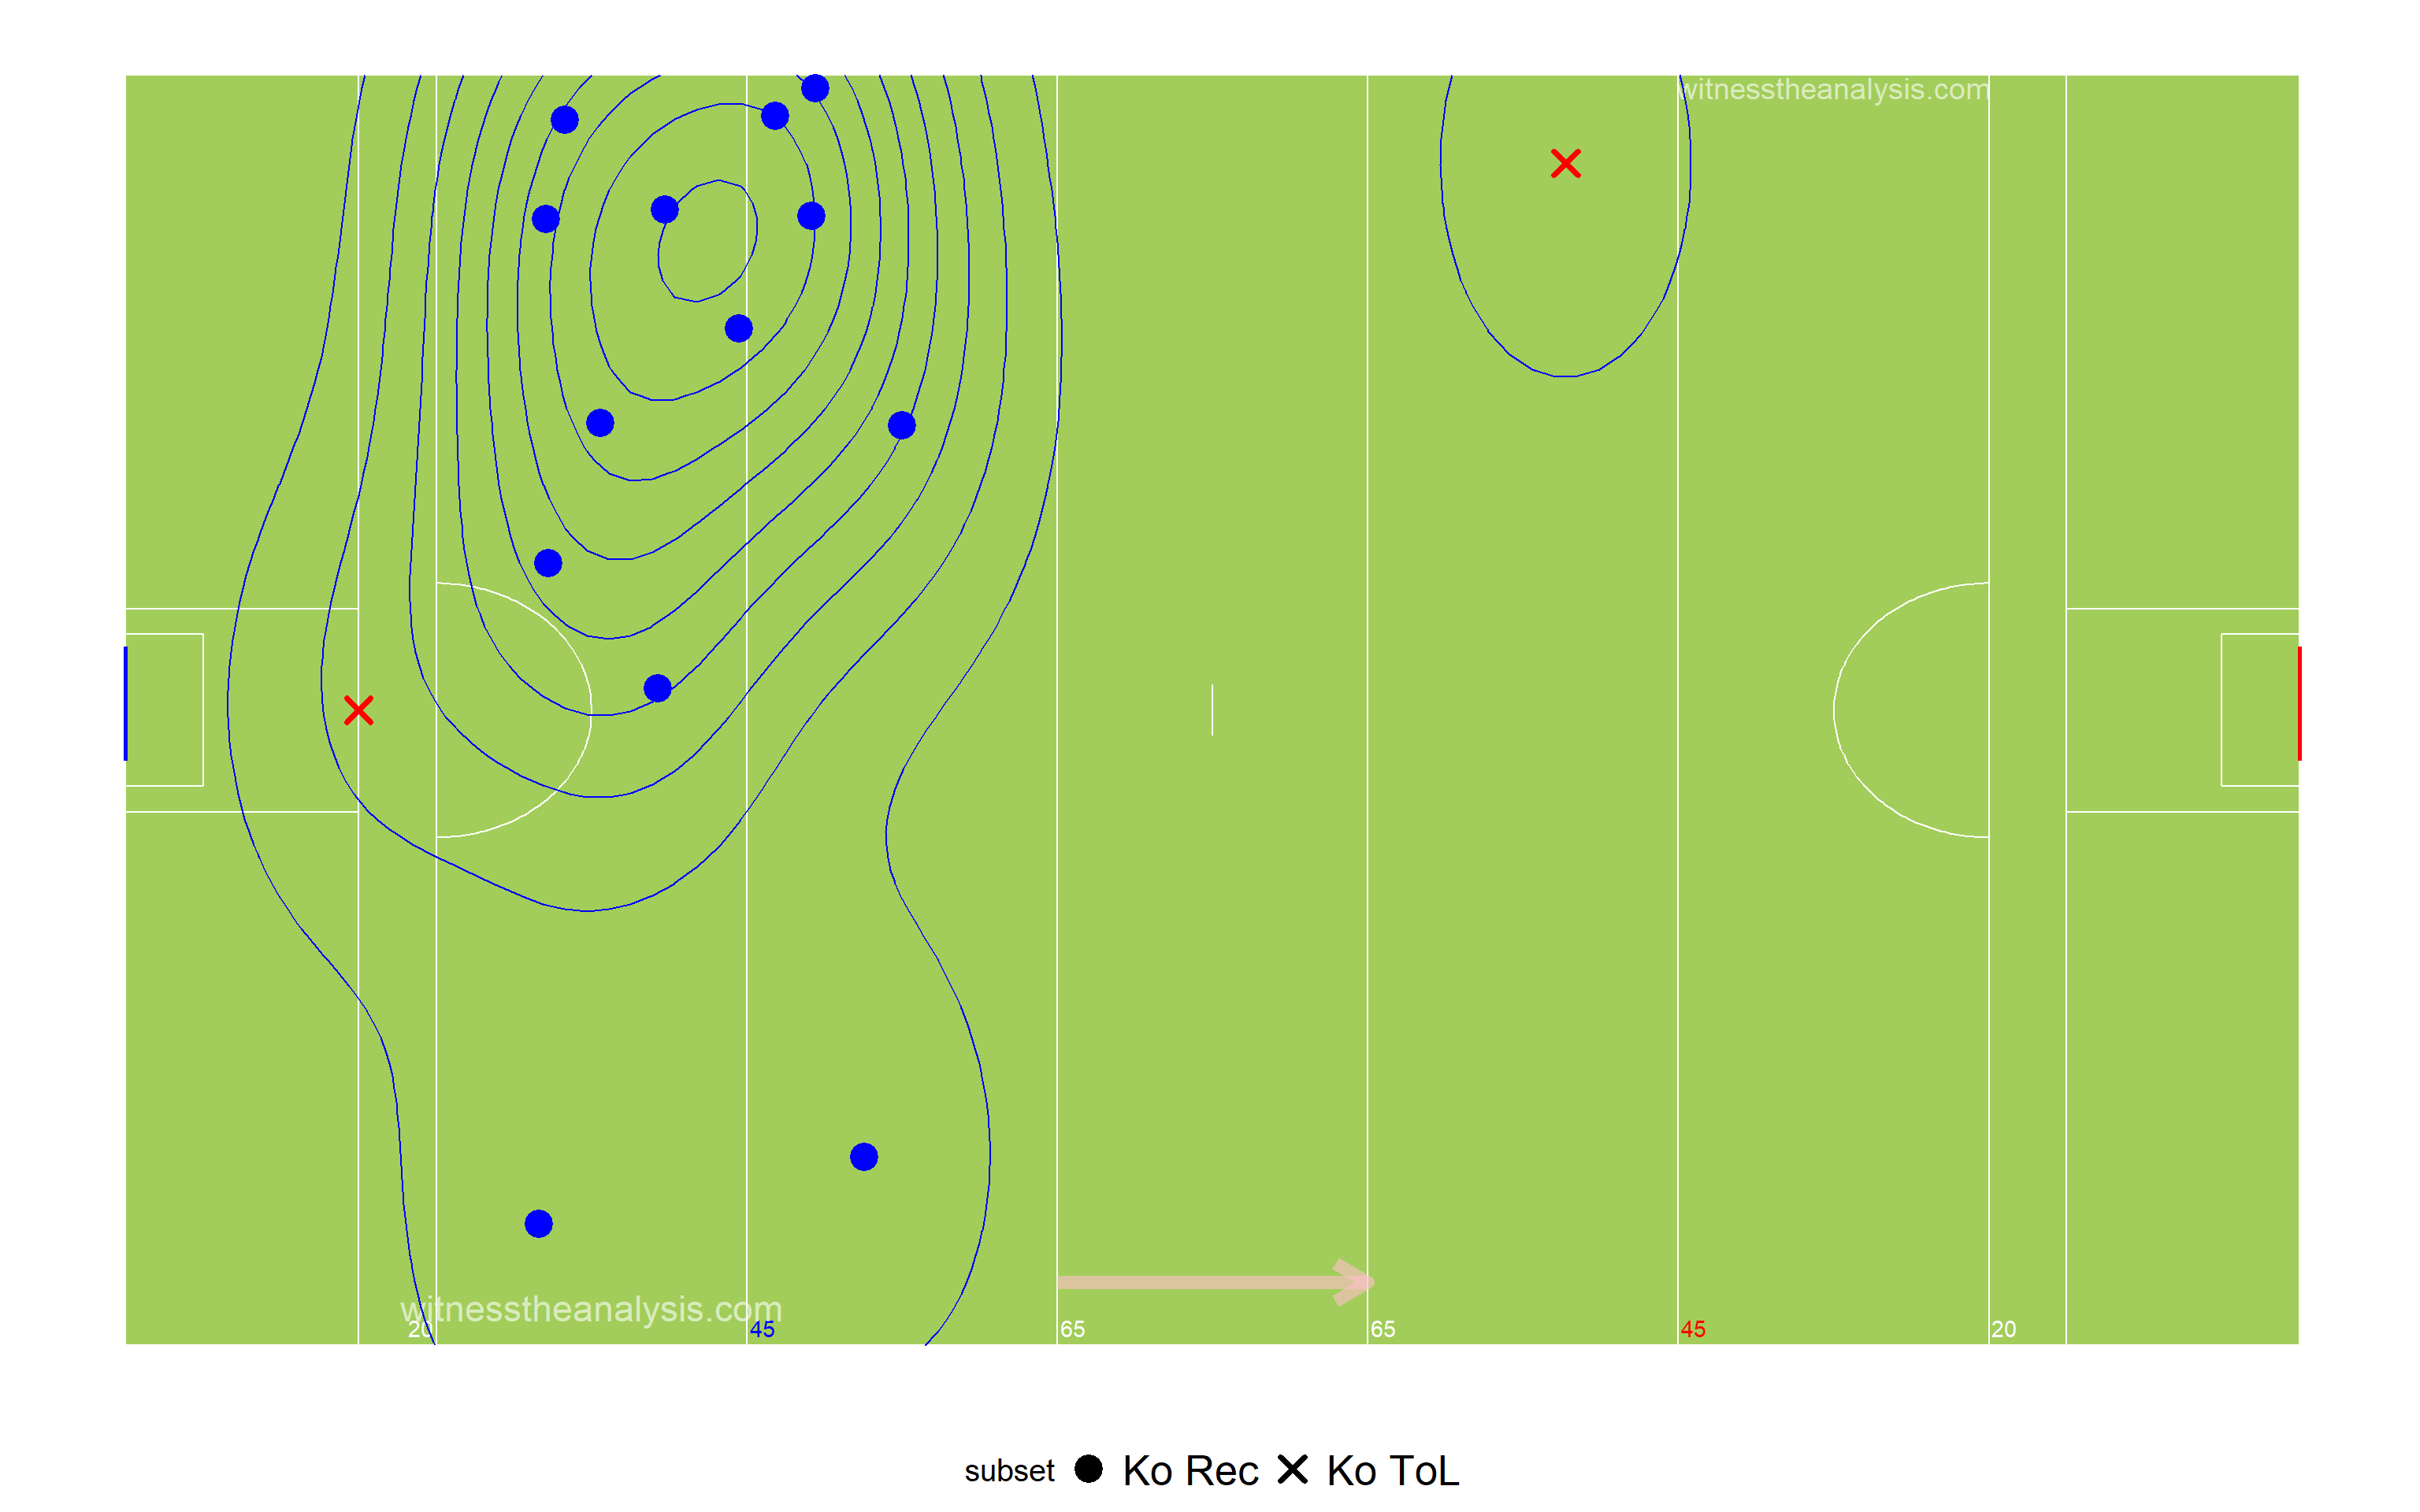
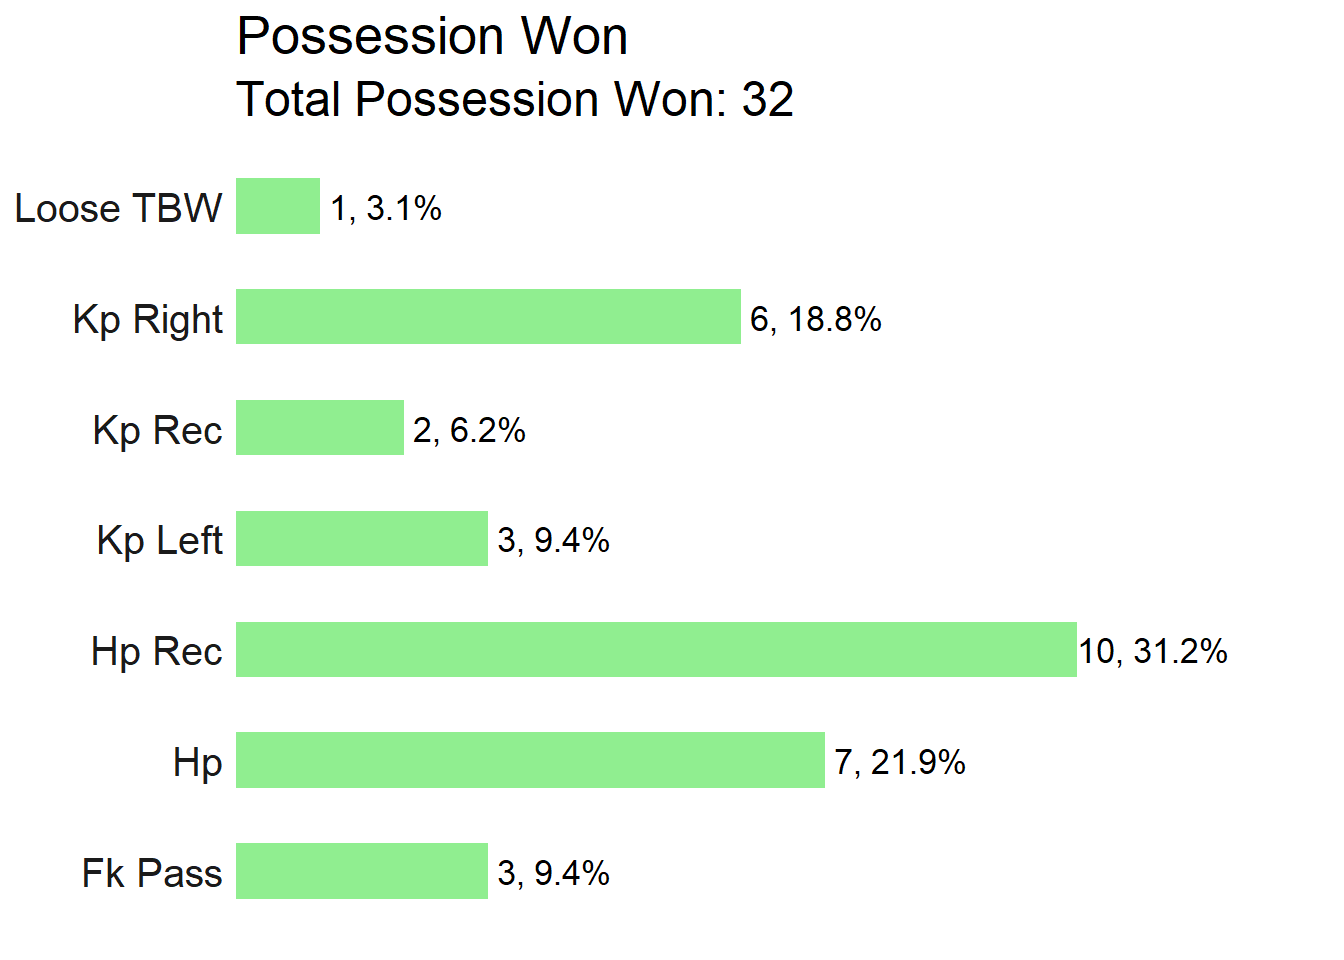
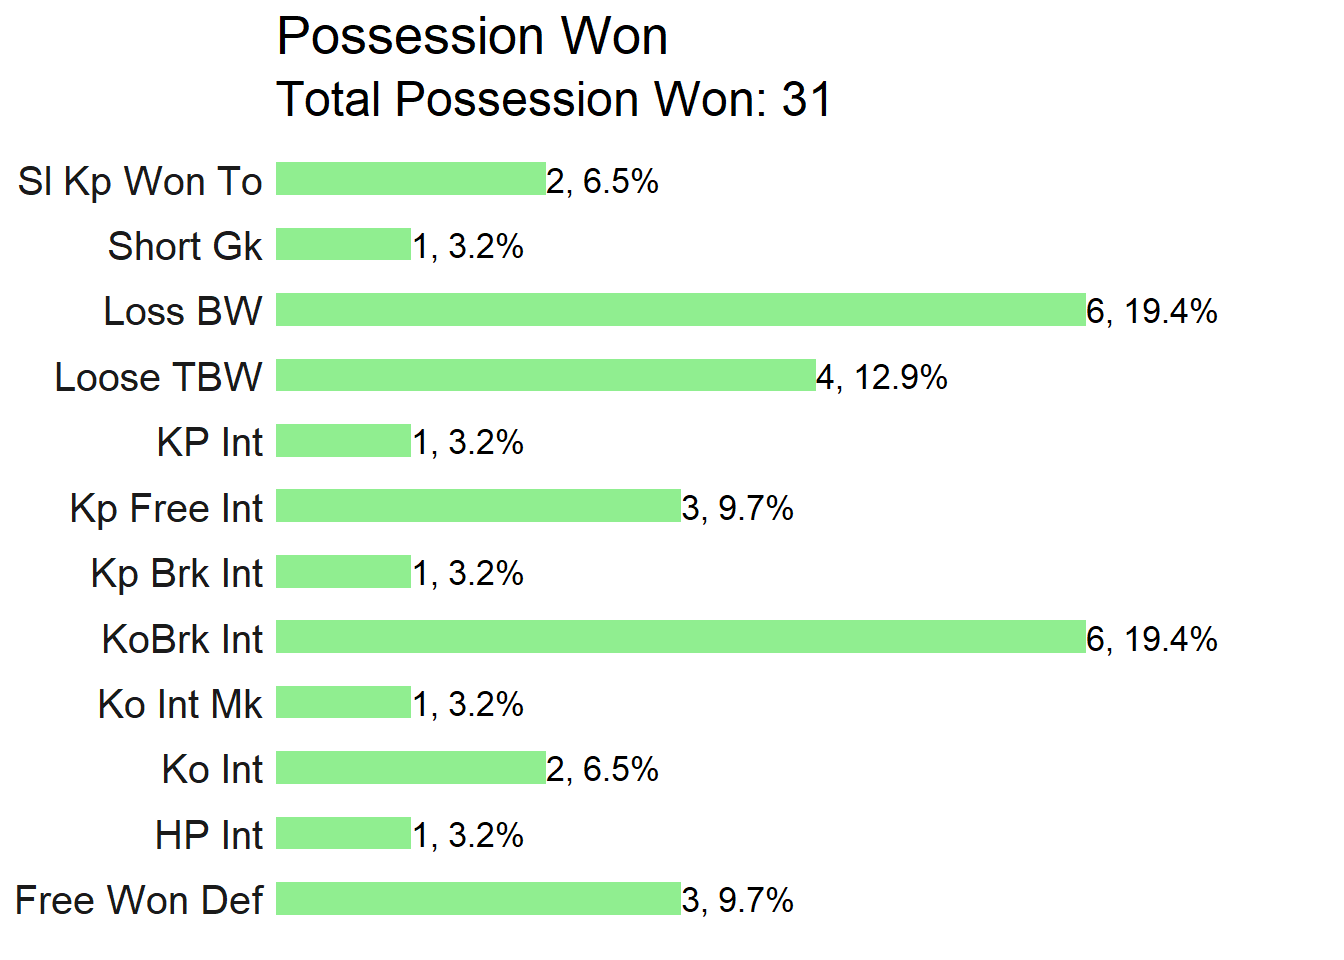
##Turn overs/Possession Won
###Thomas Davis
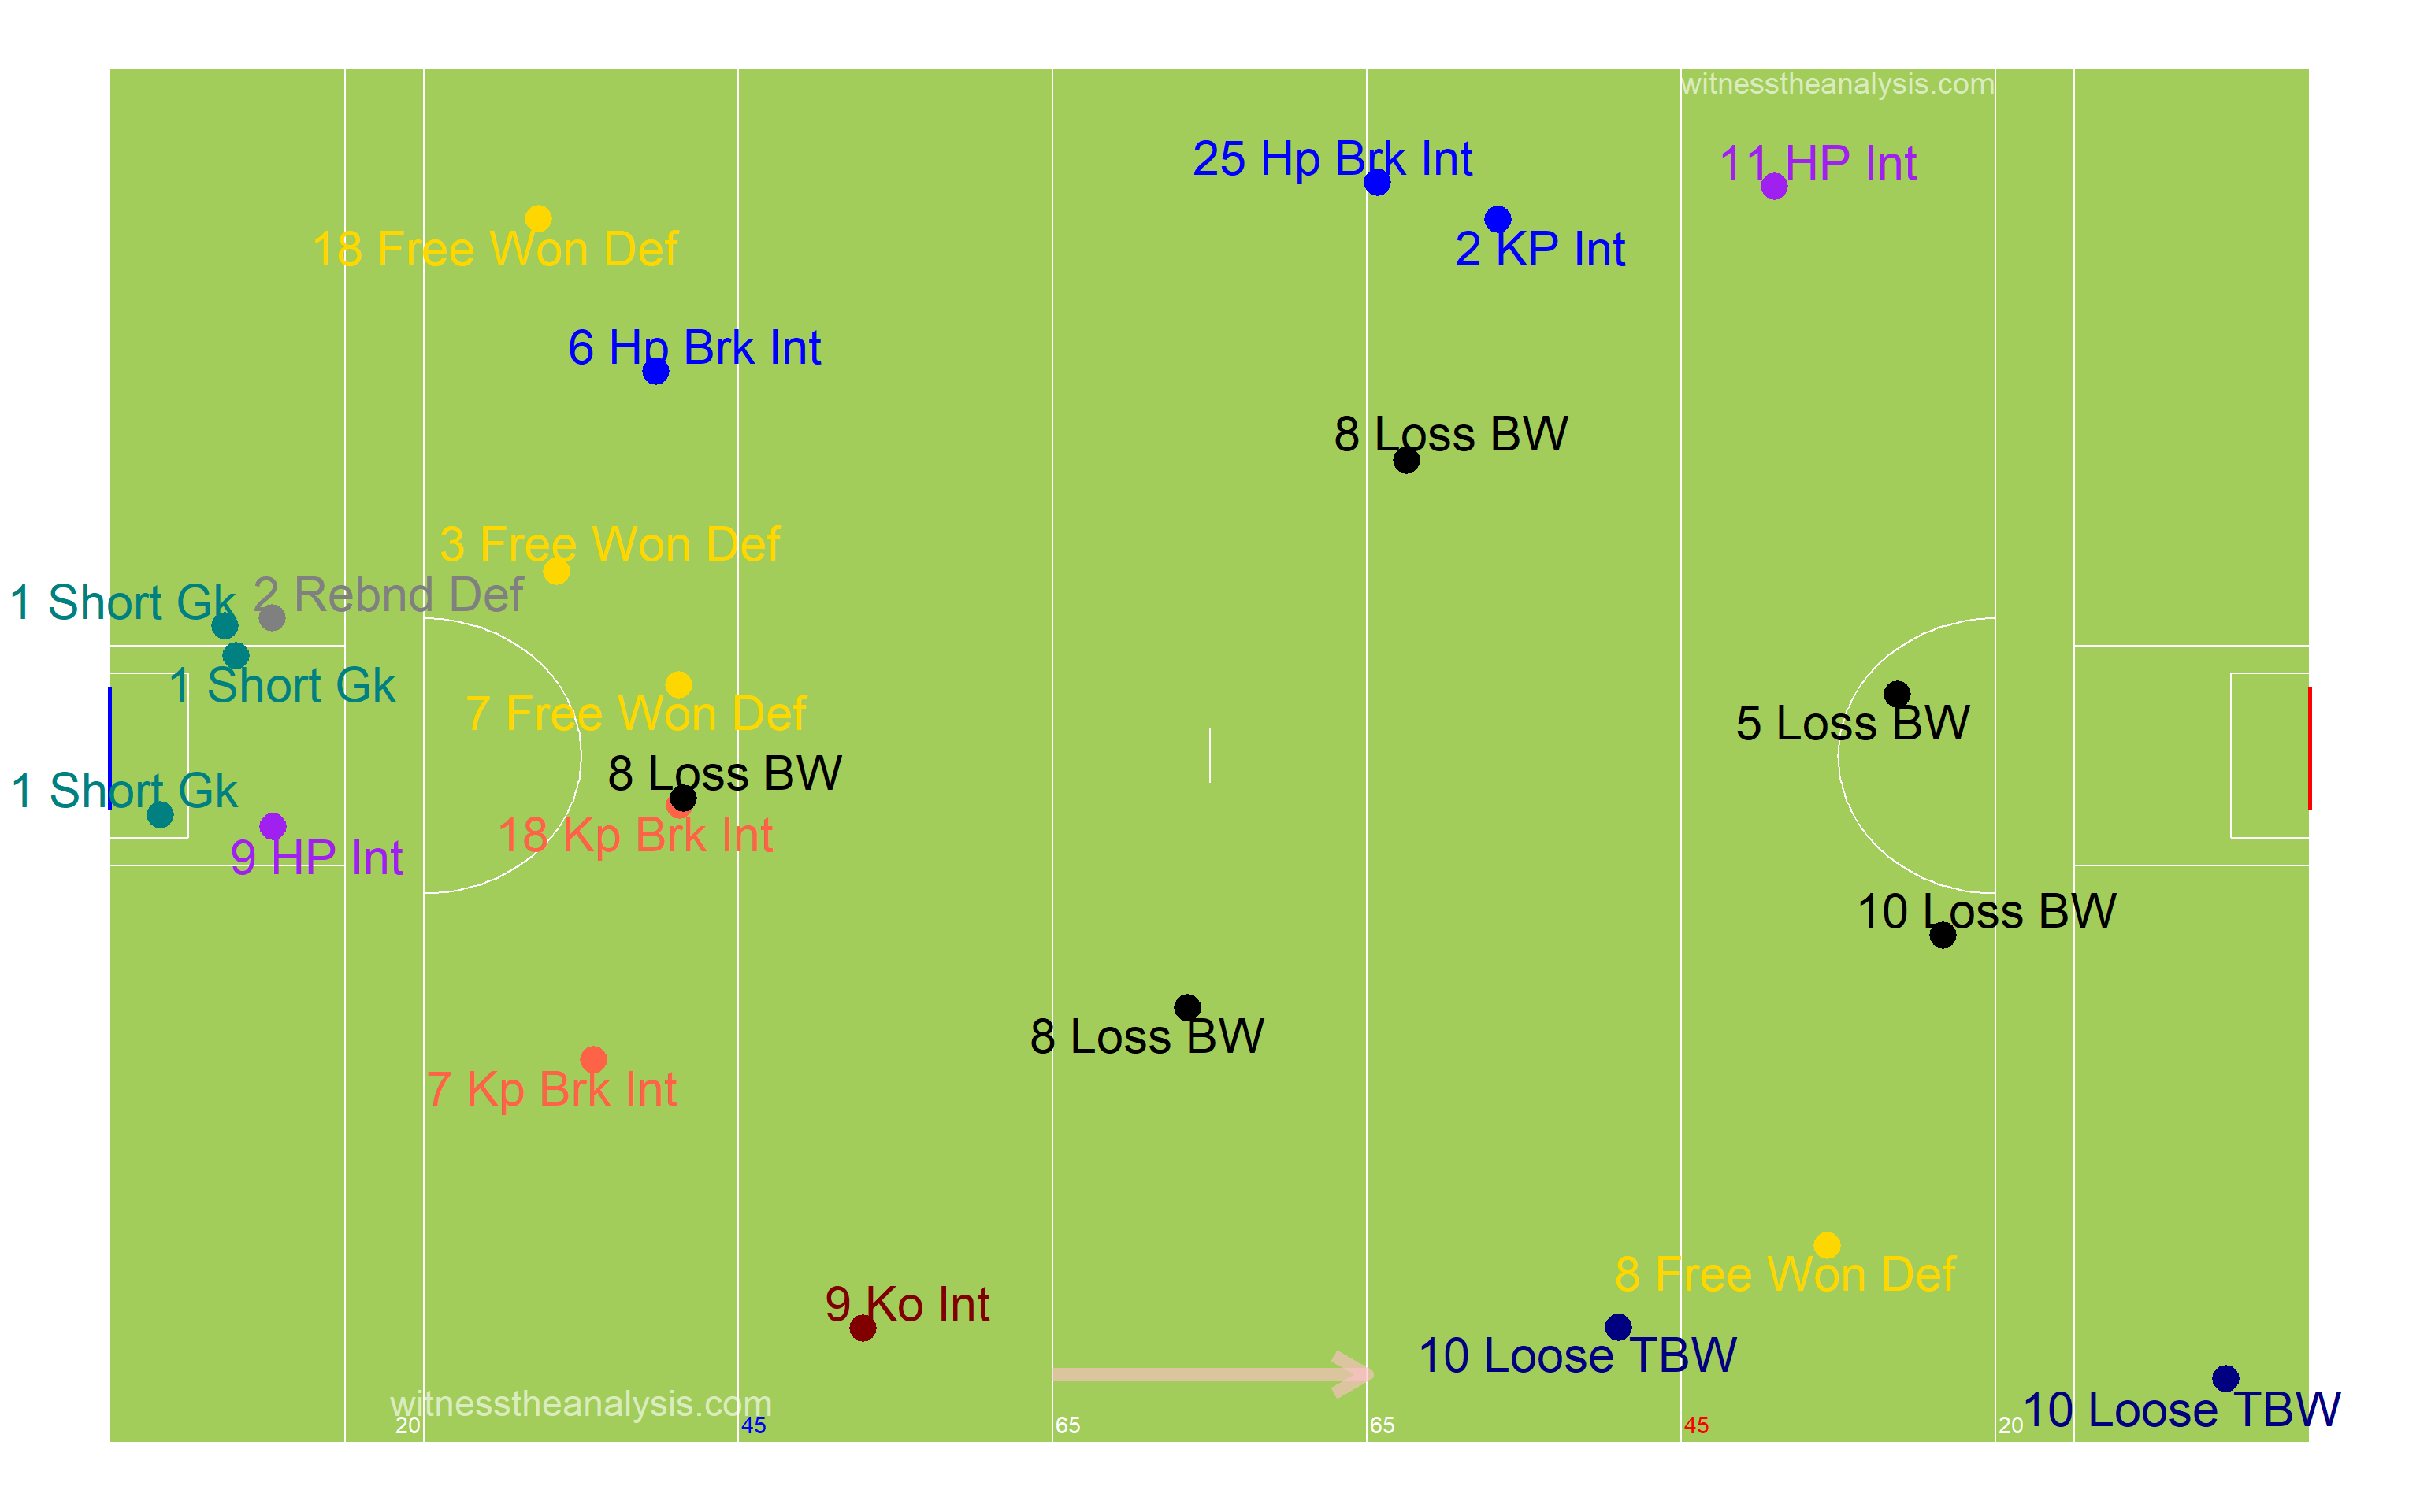
###Ballyboden
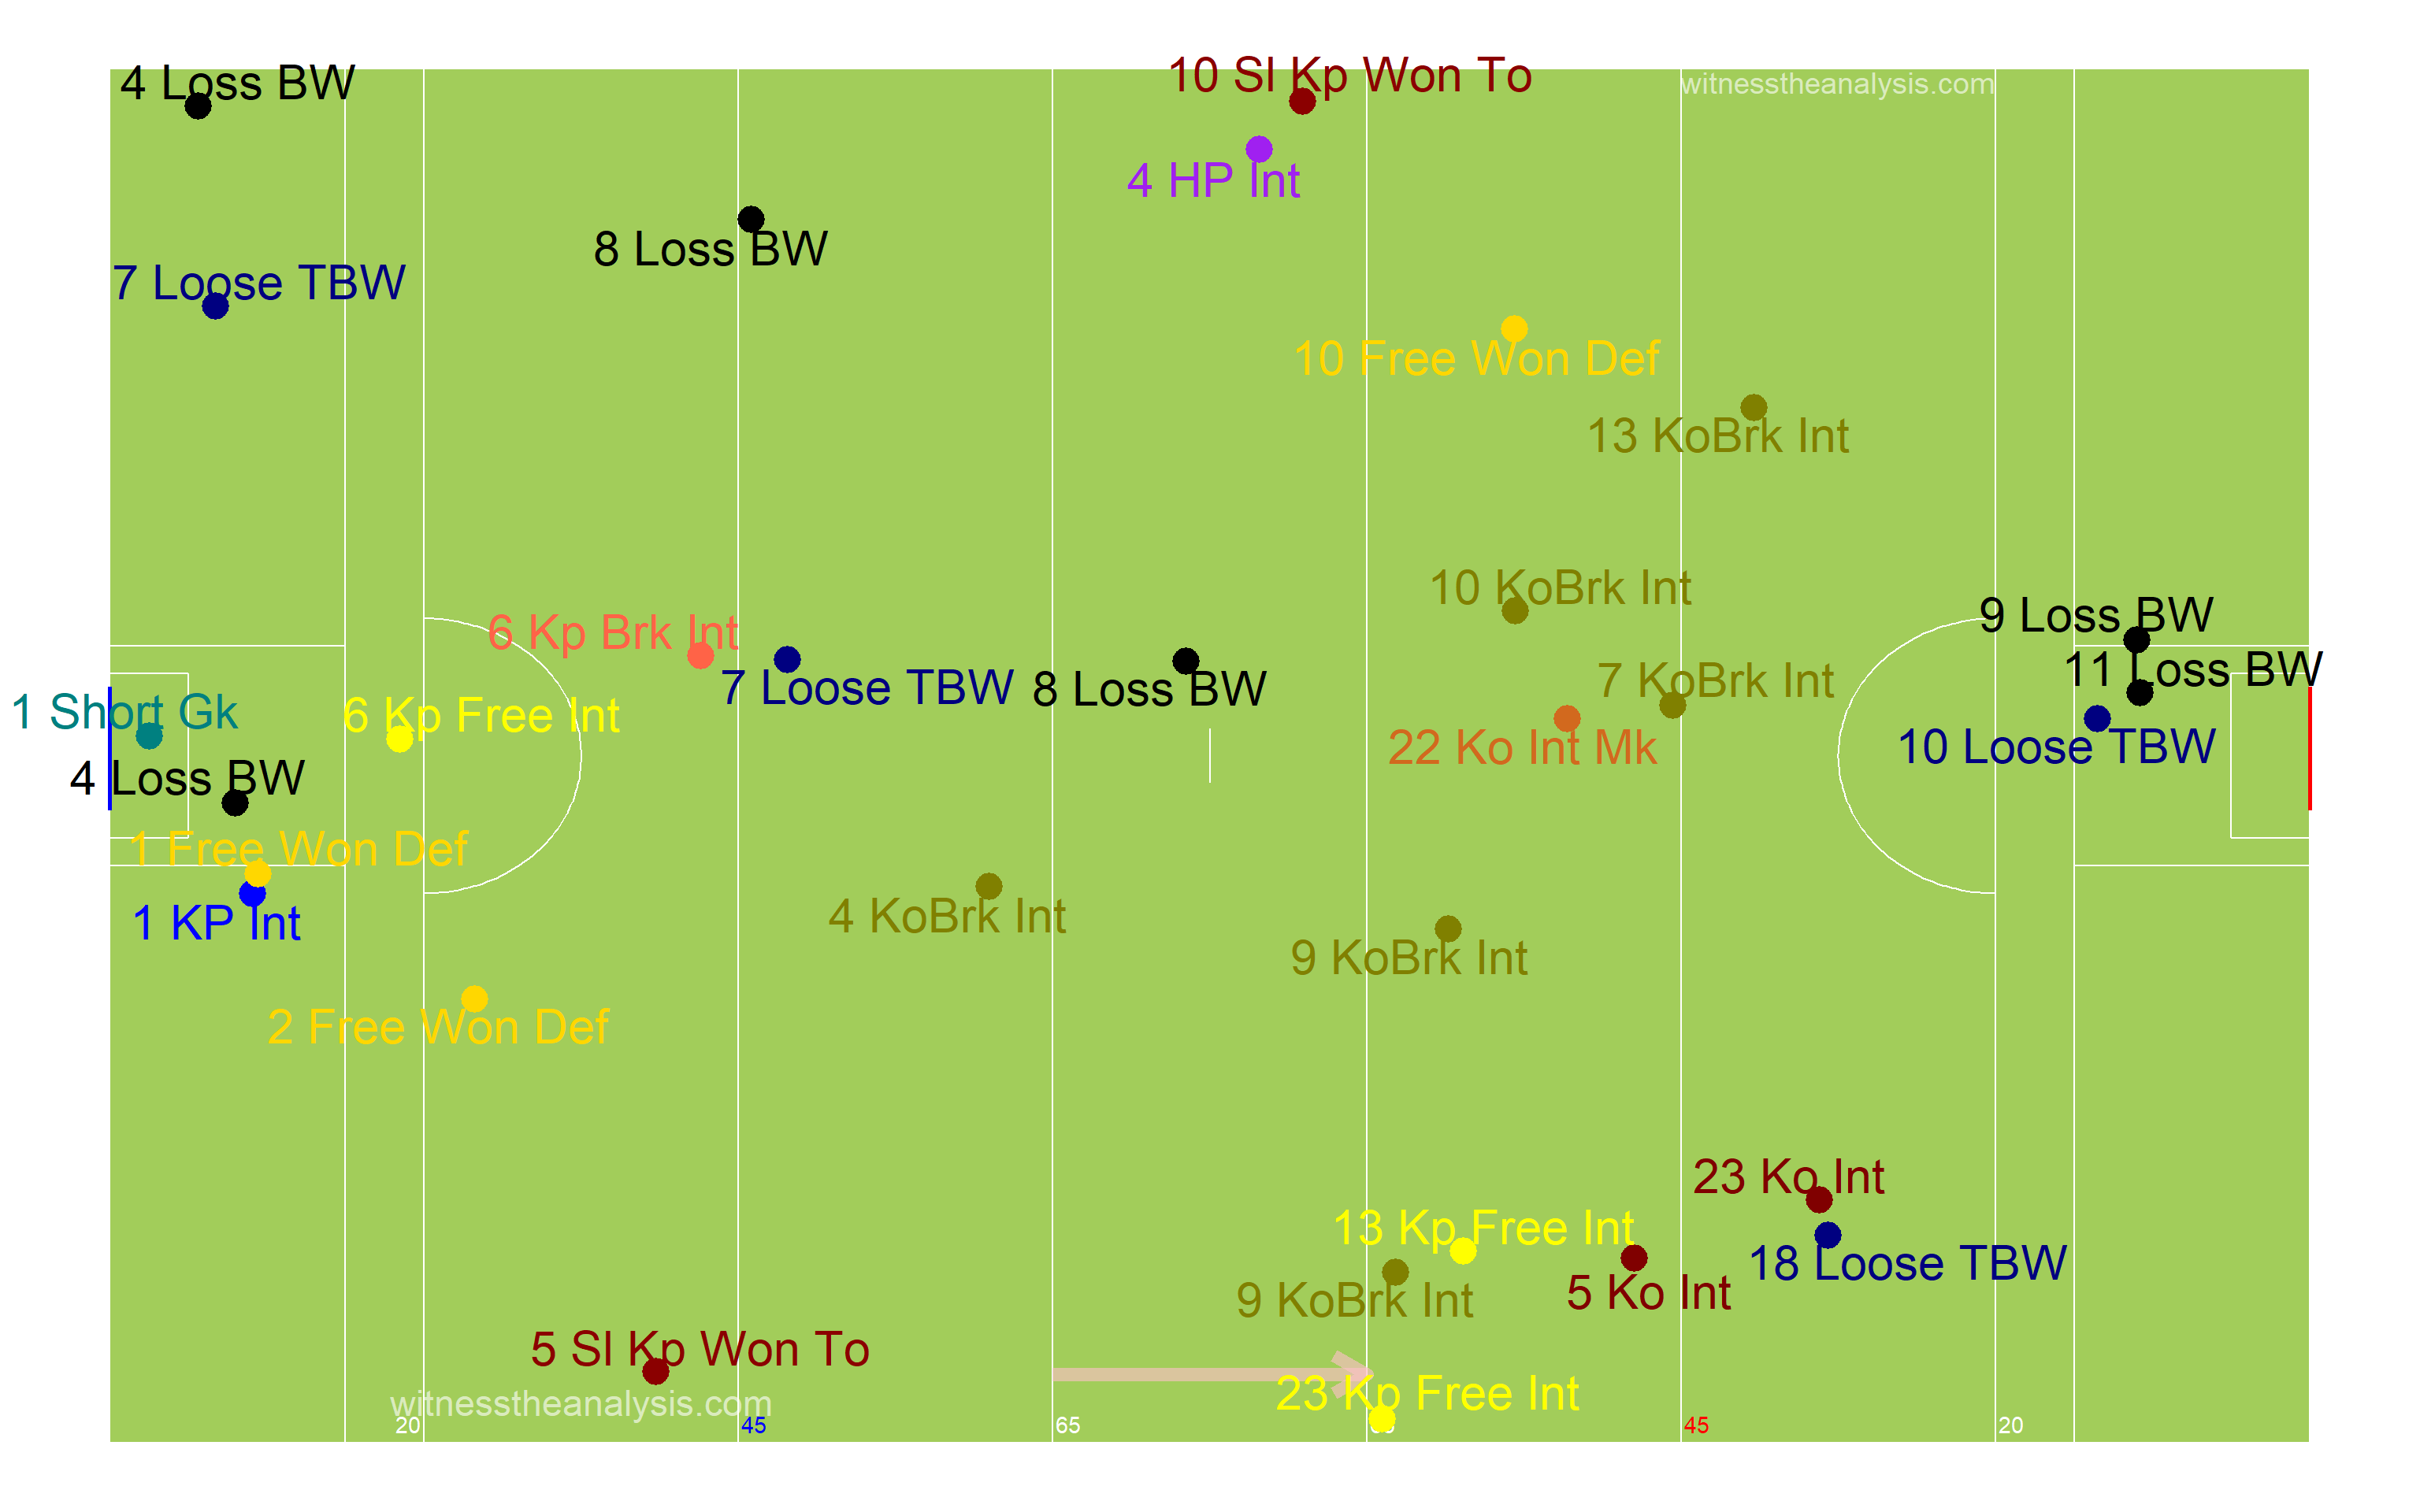
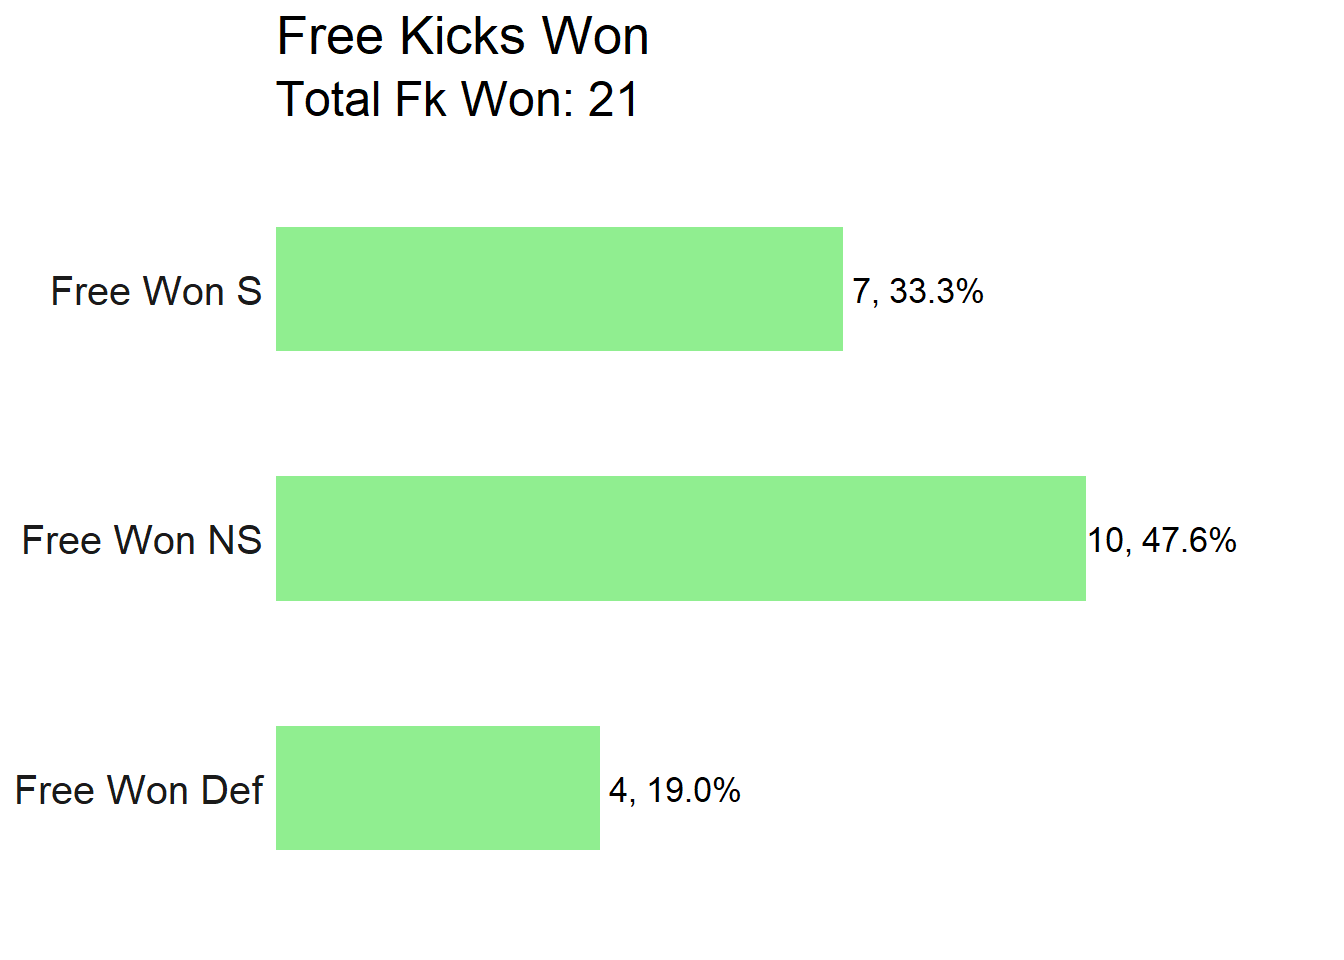
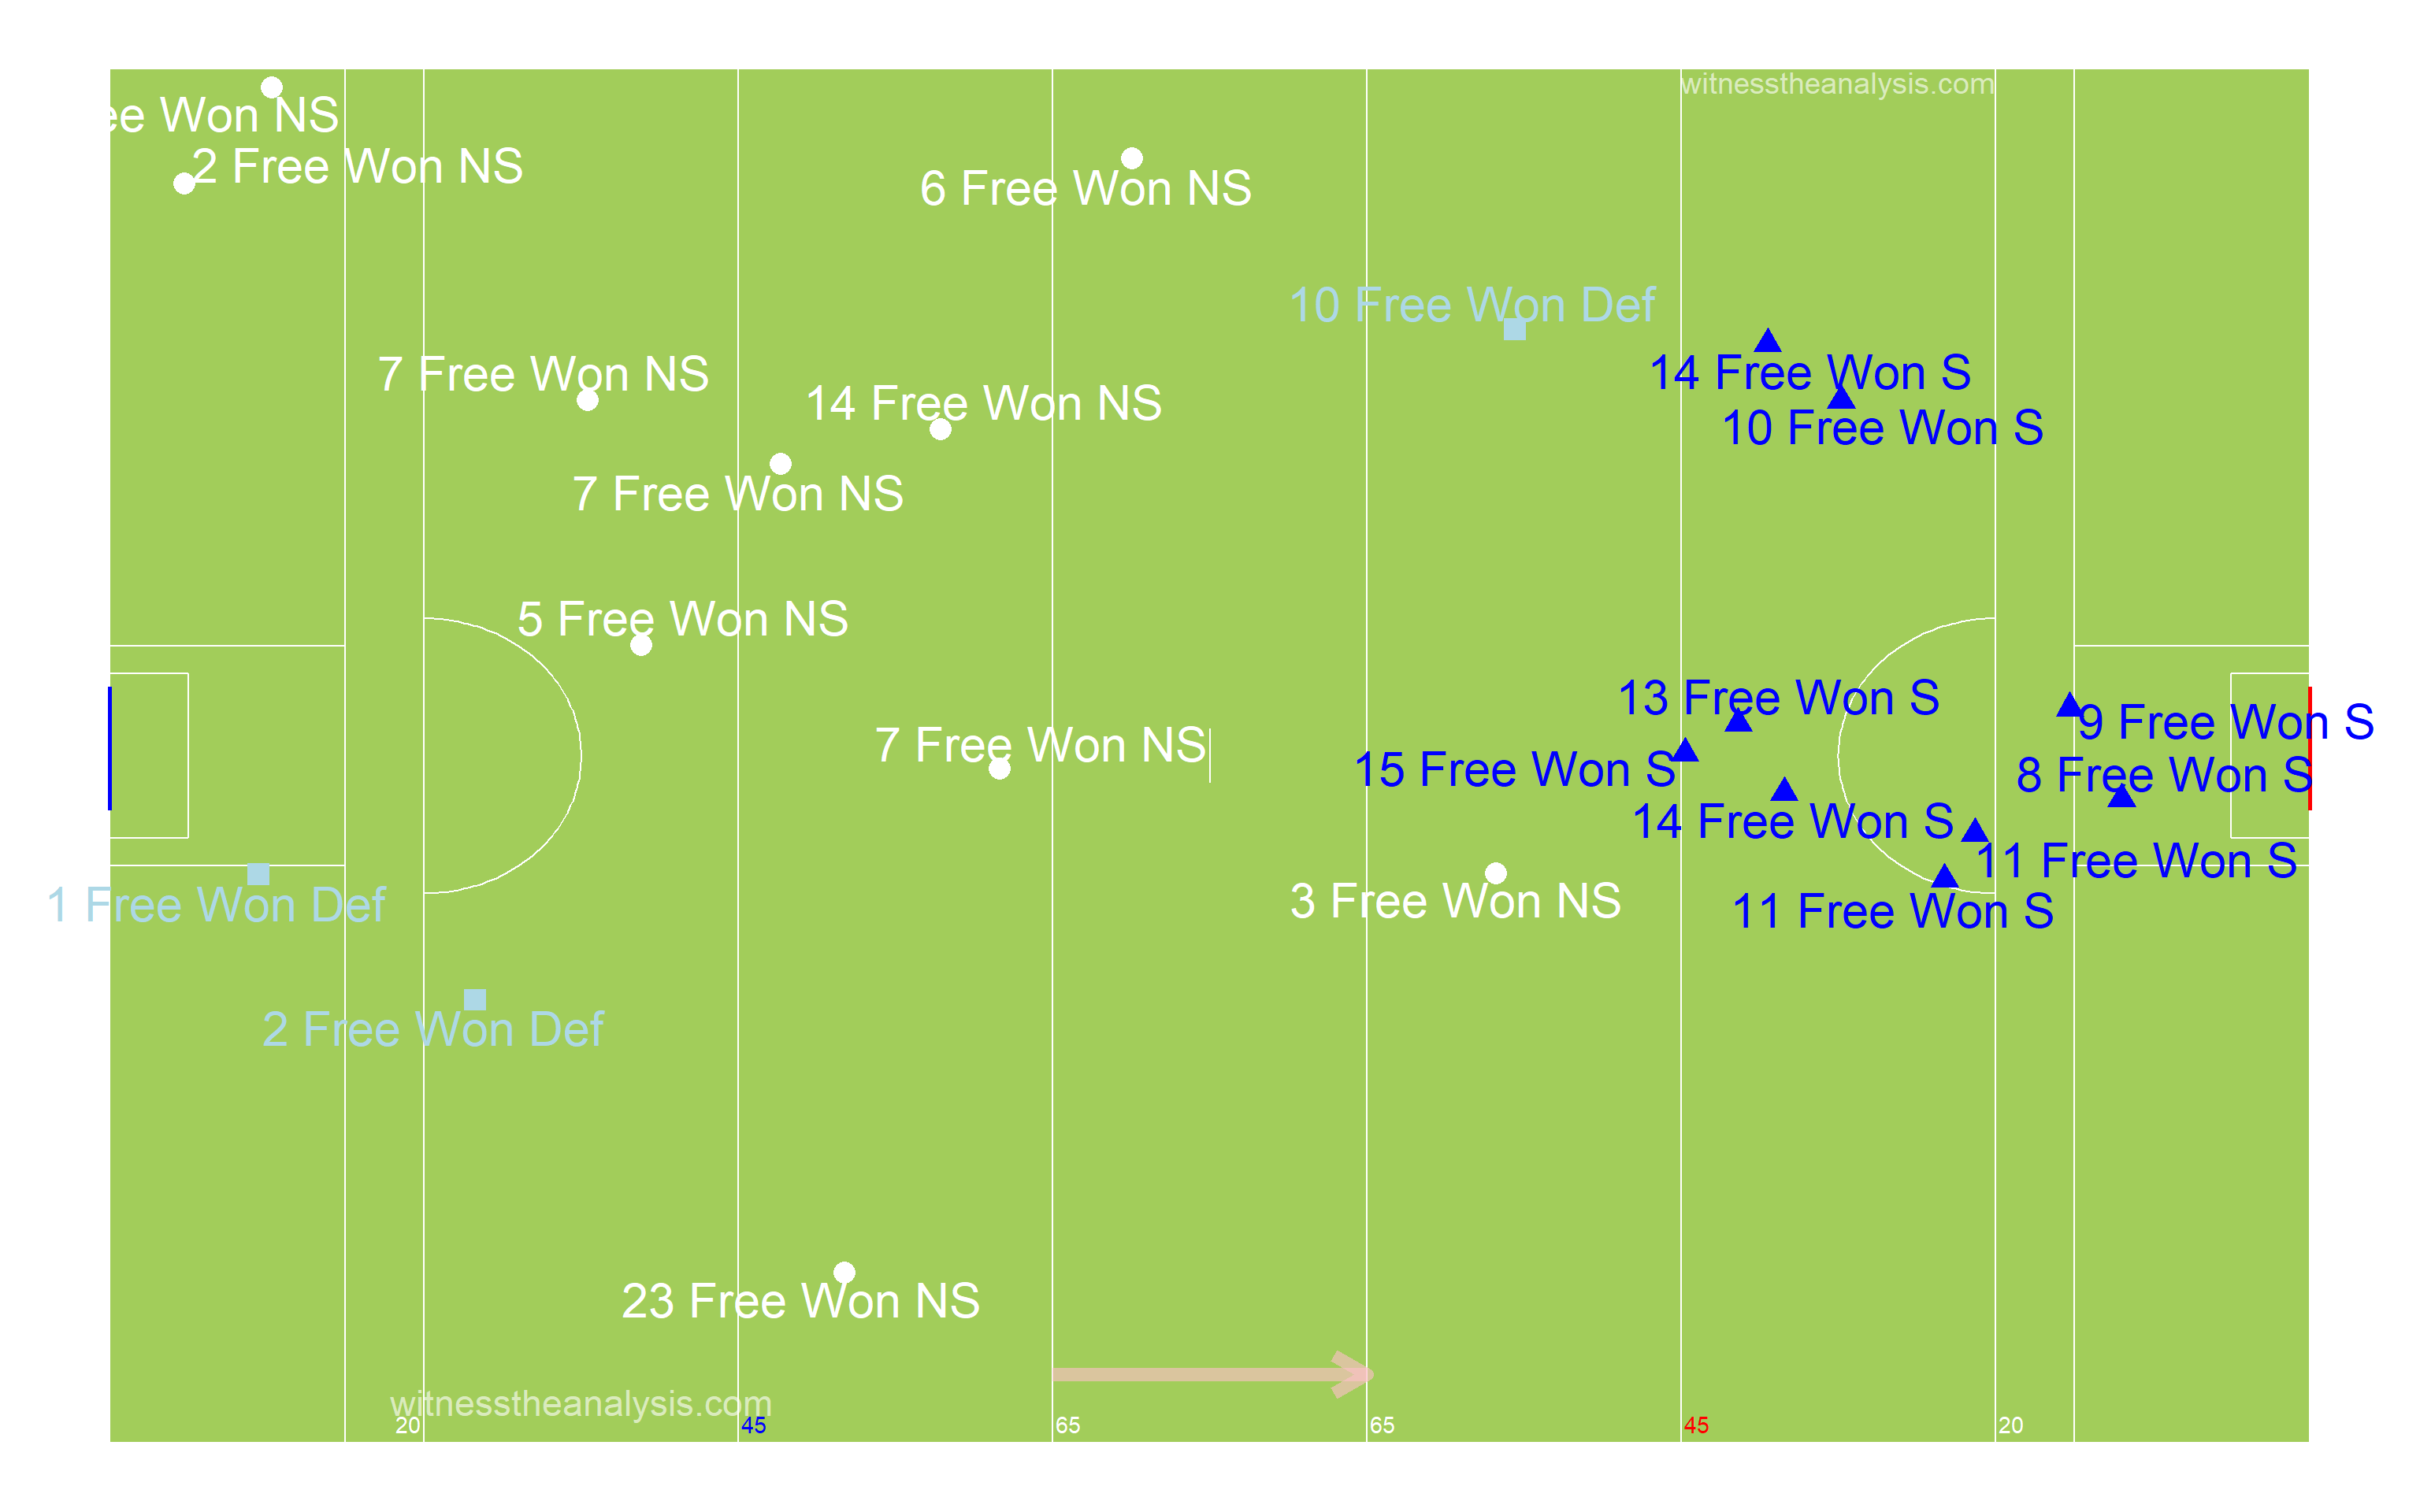
##Frees Won ###Thomas Davis
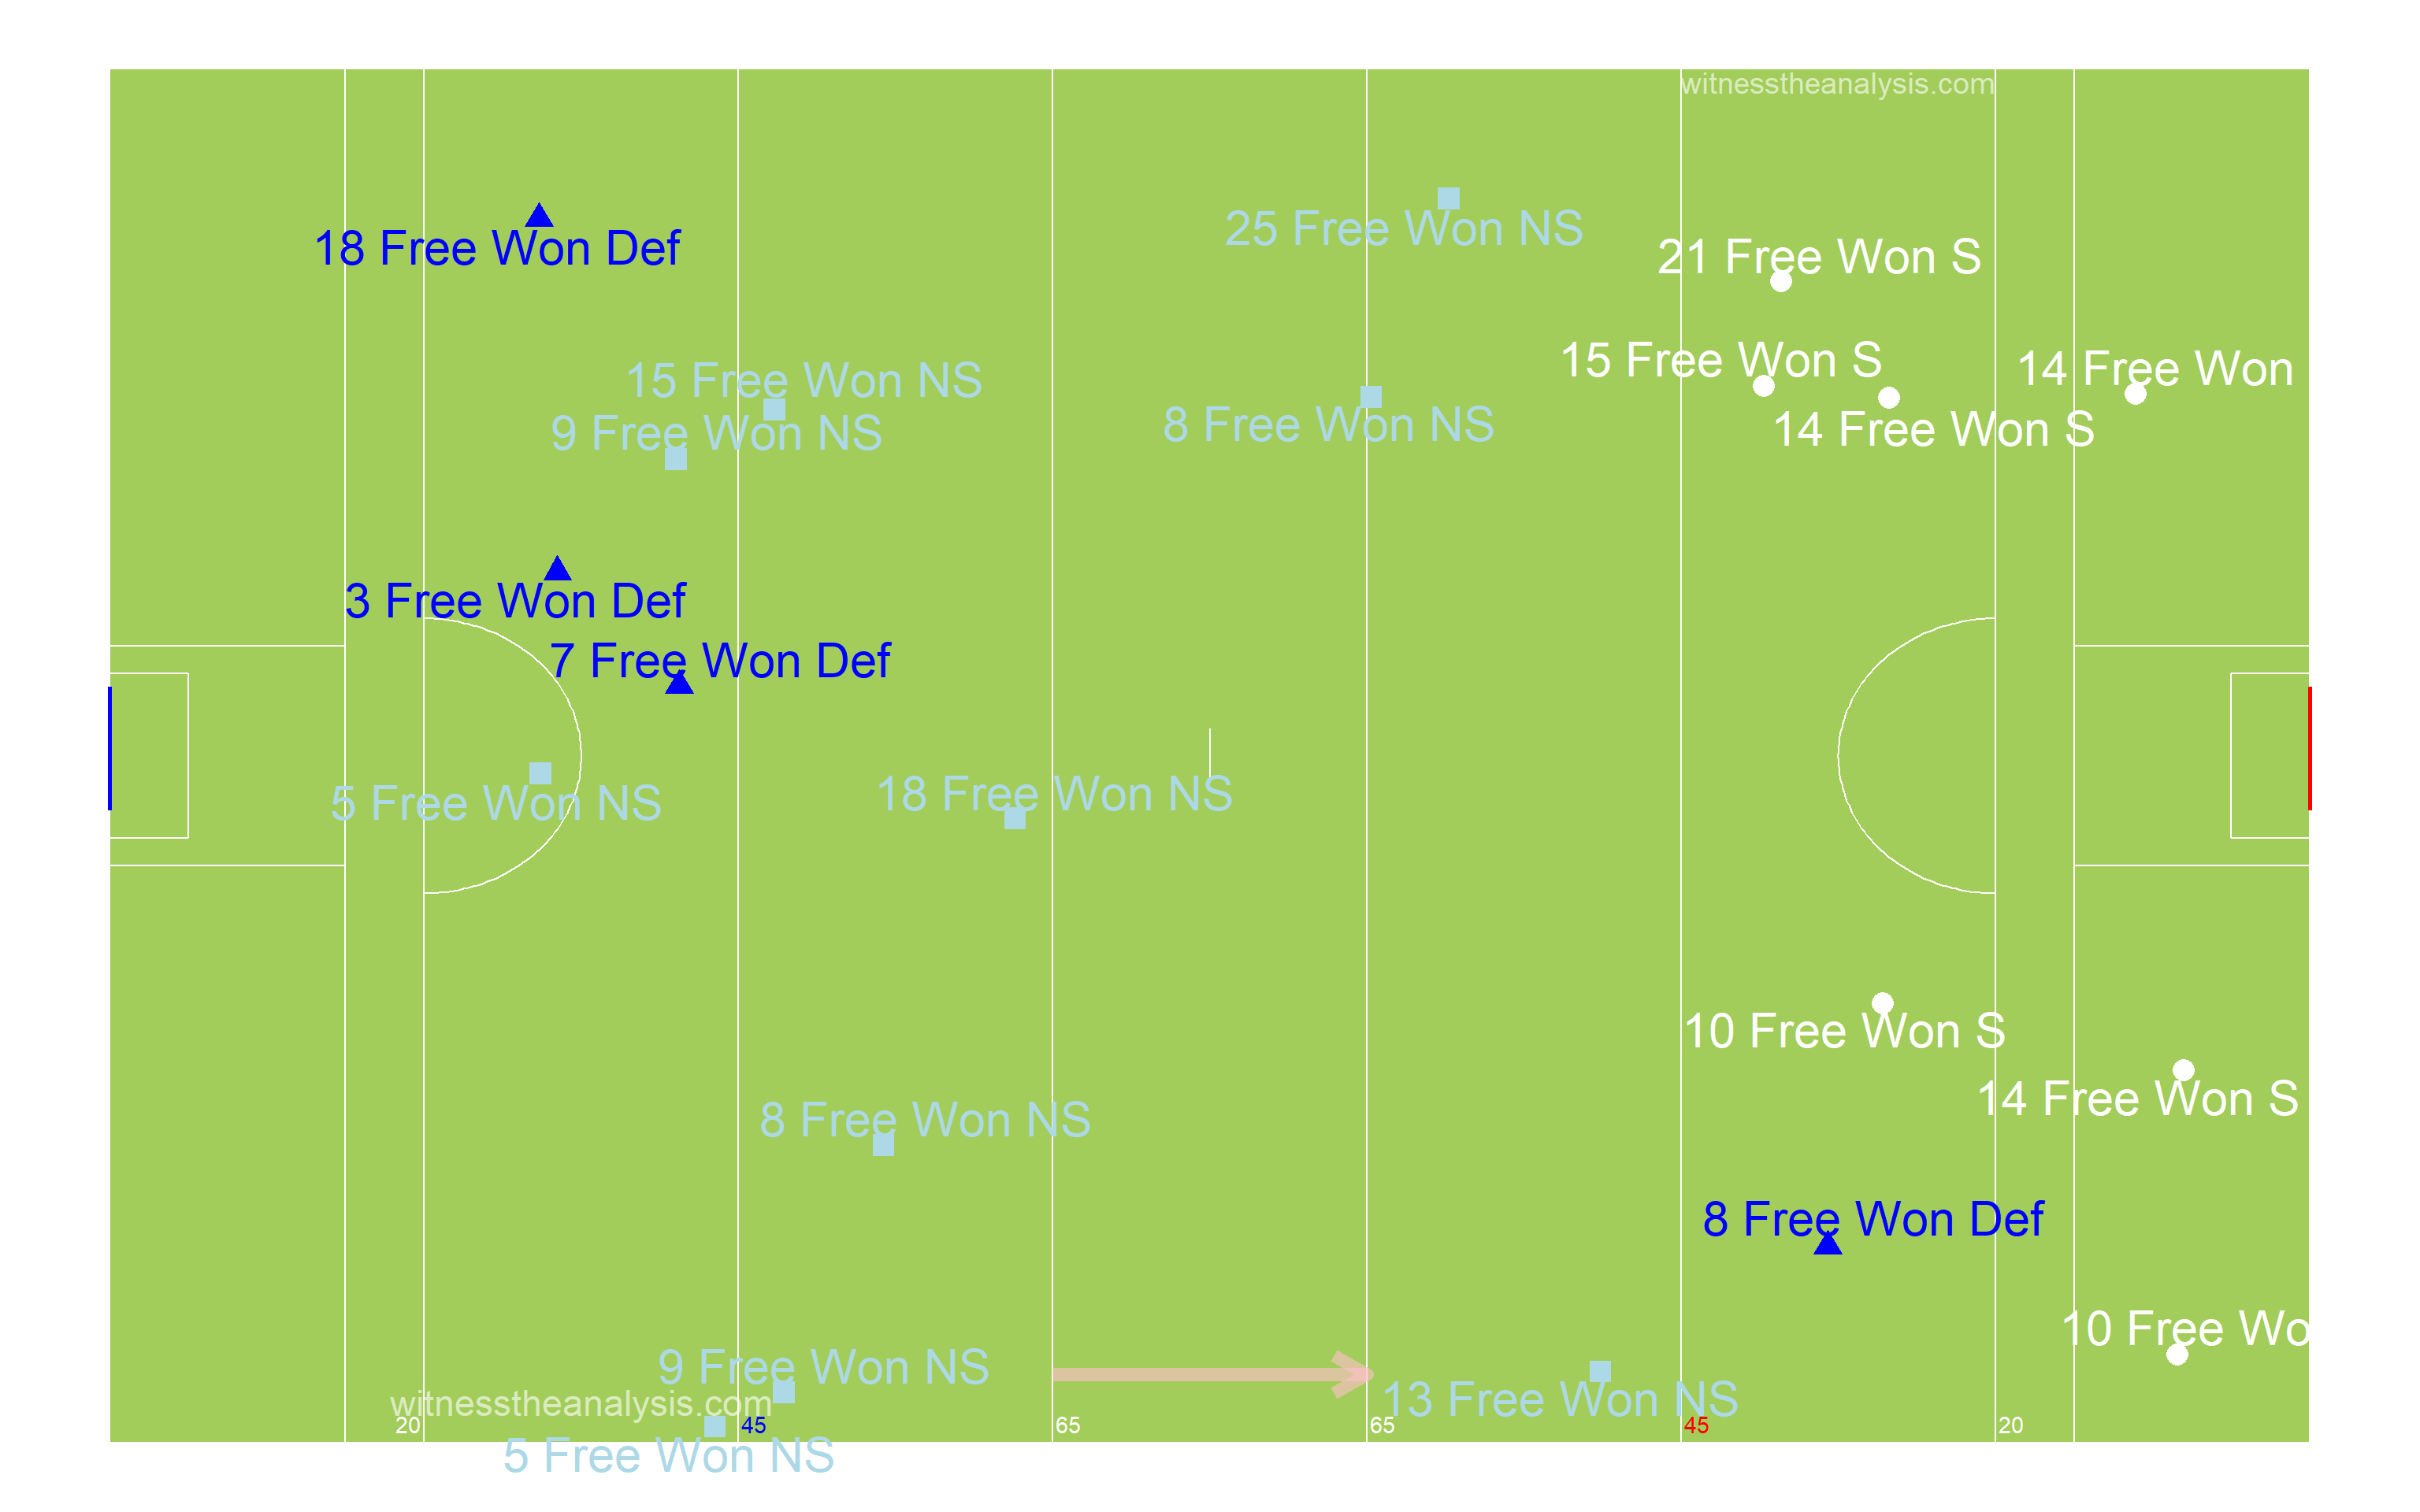
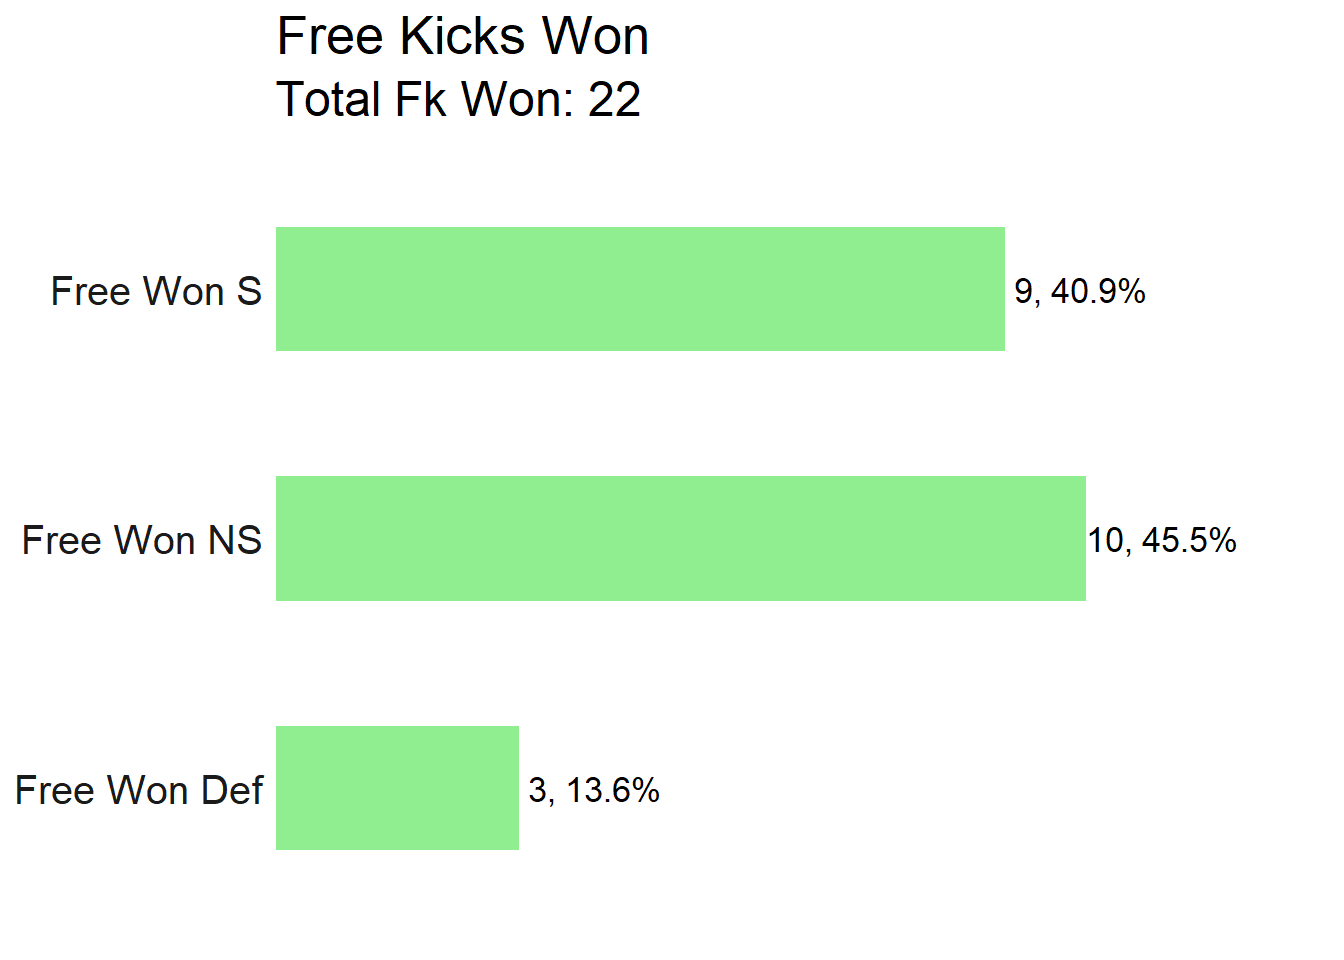
###Ballyboden
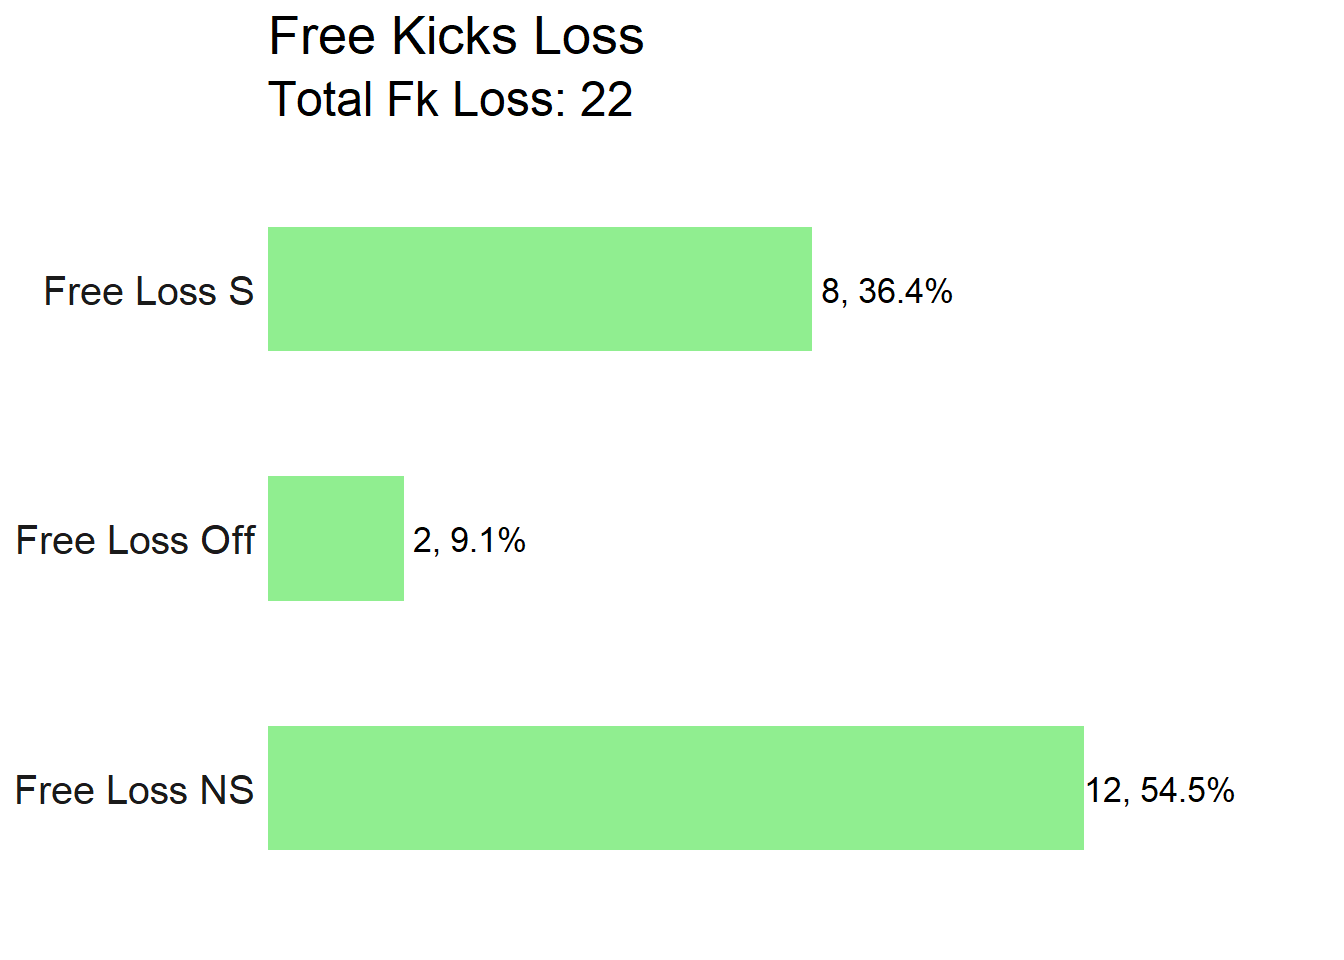
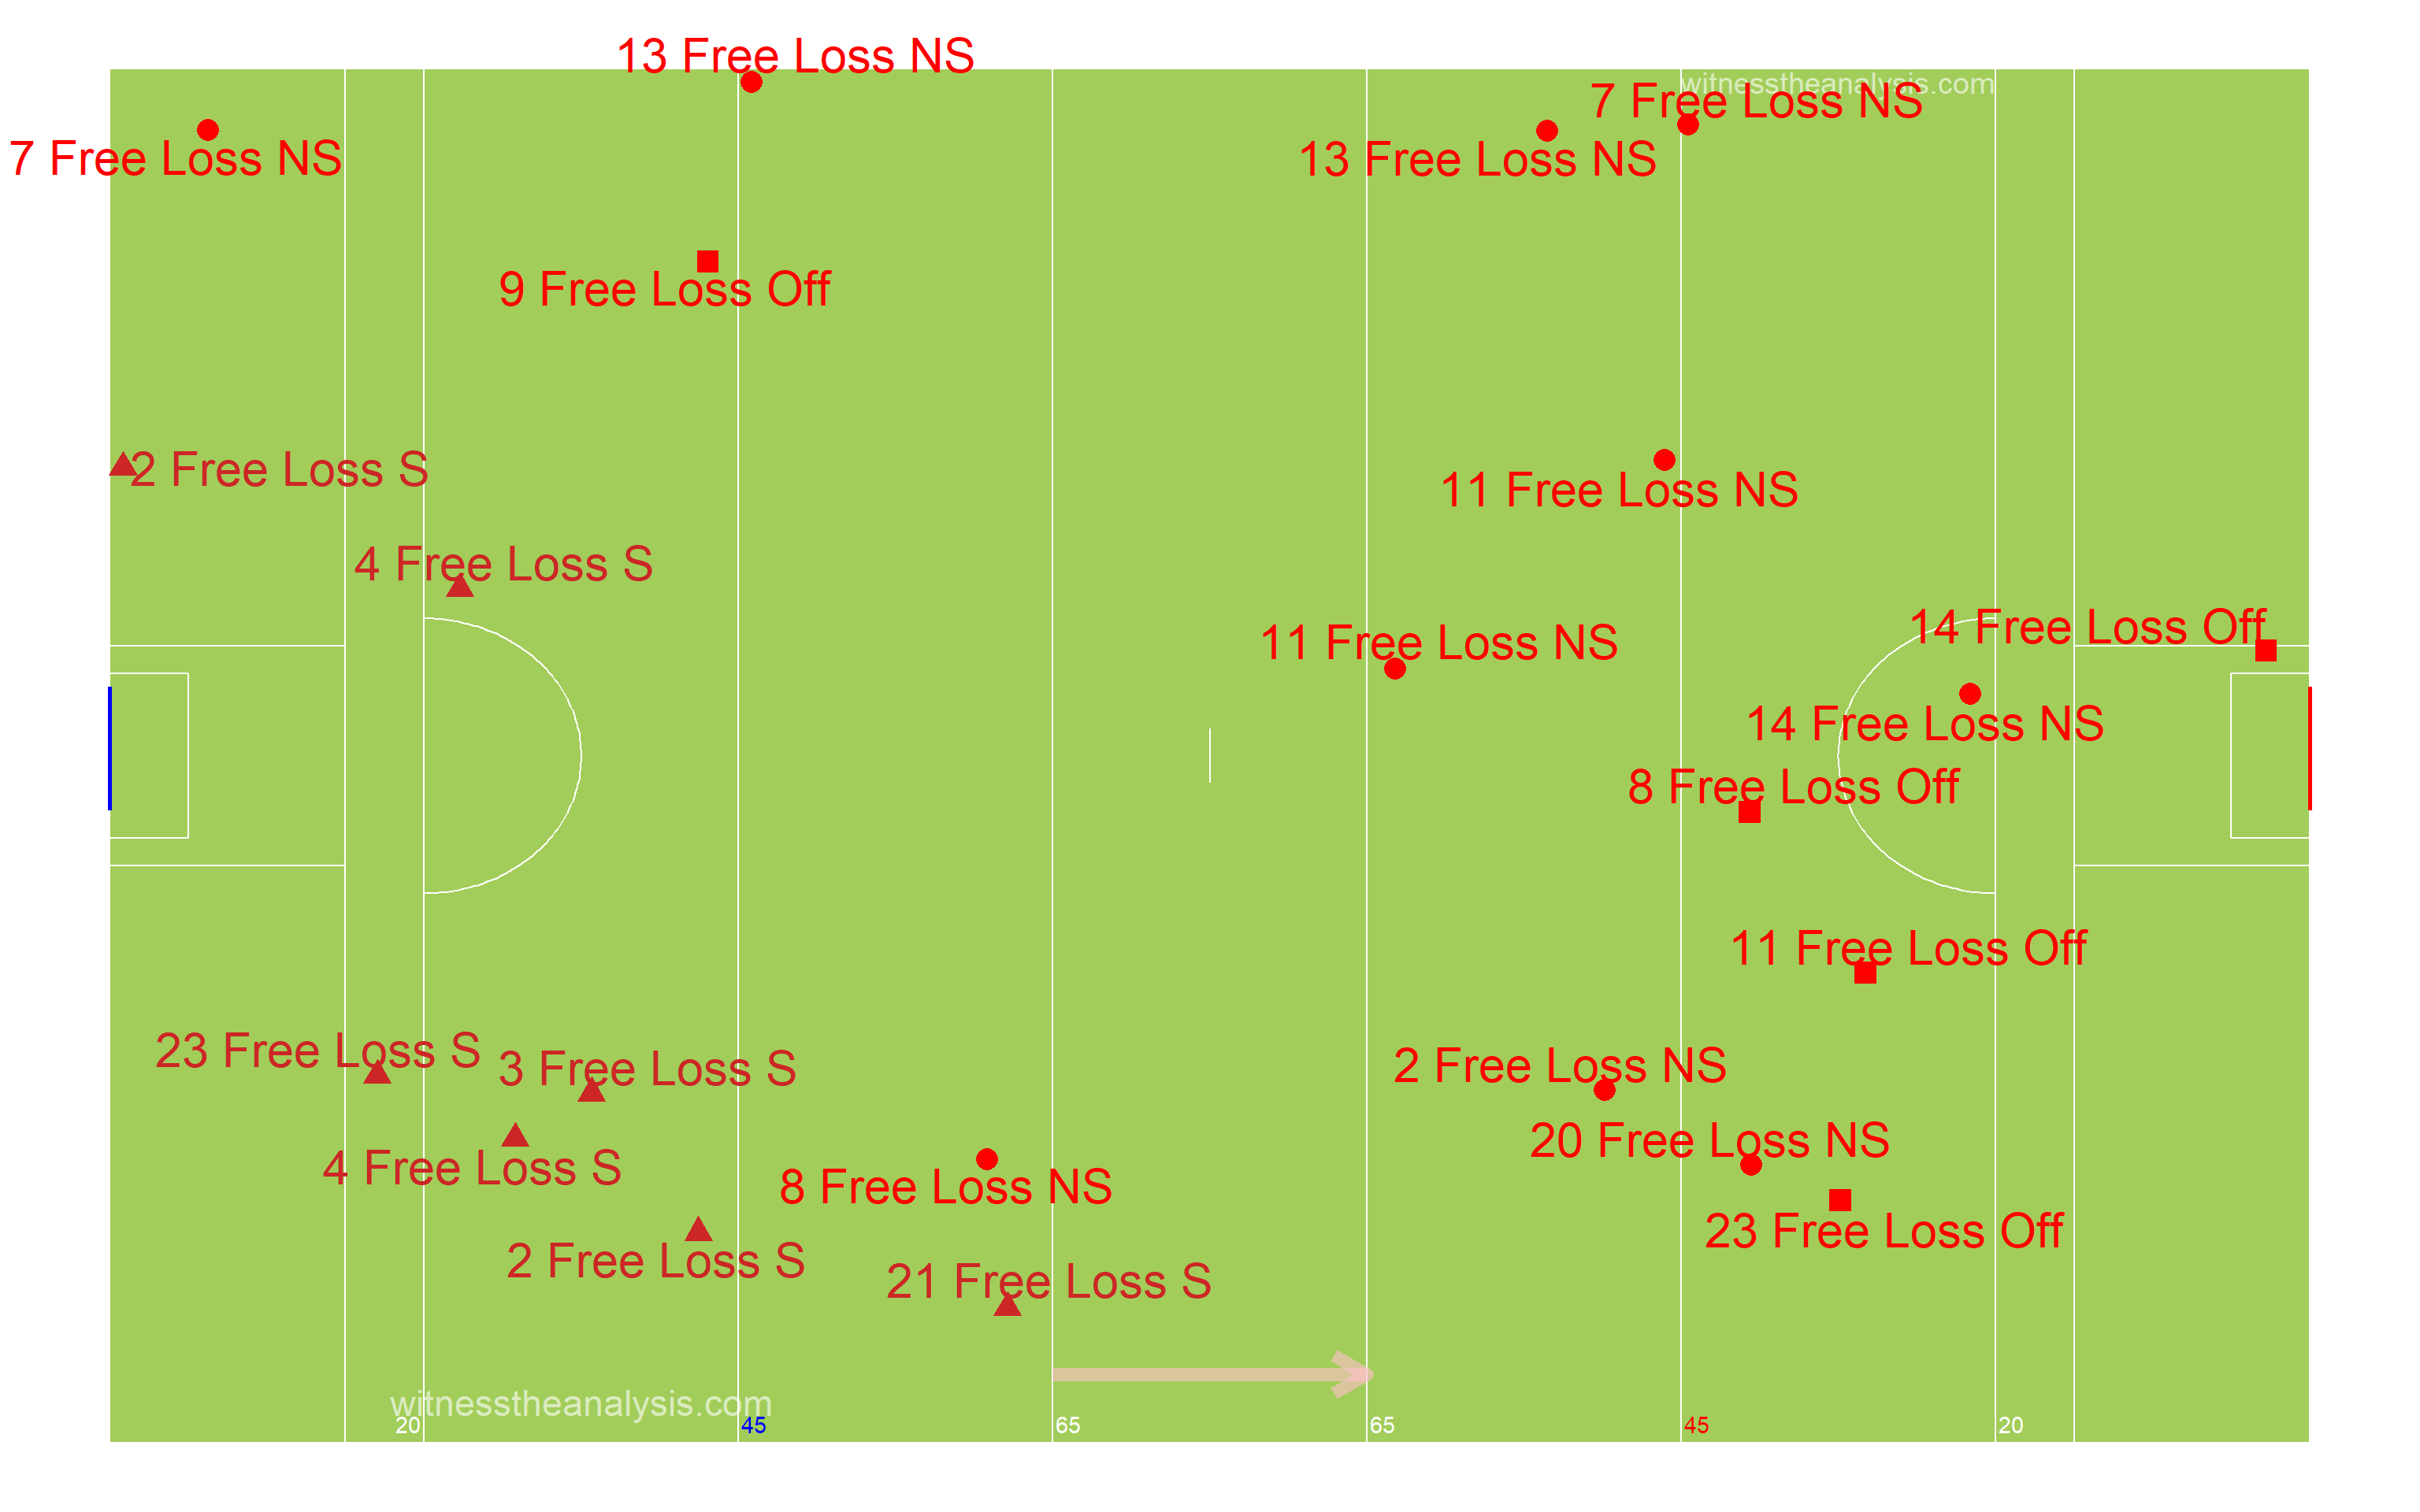
##Frees Loss ###Thomas Davis
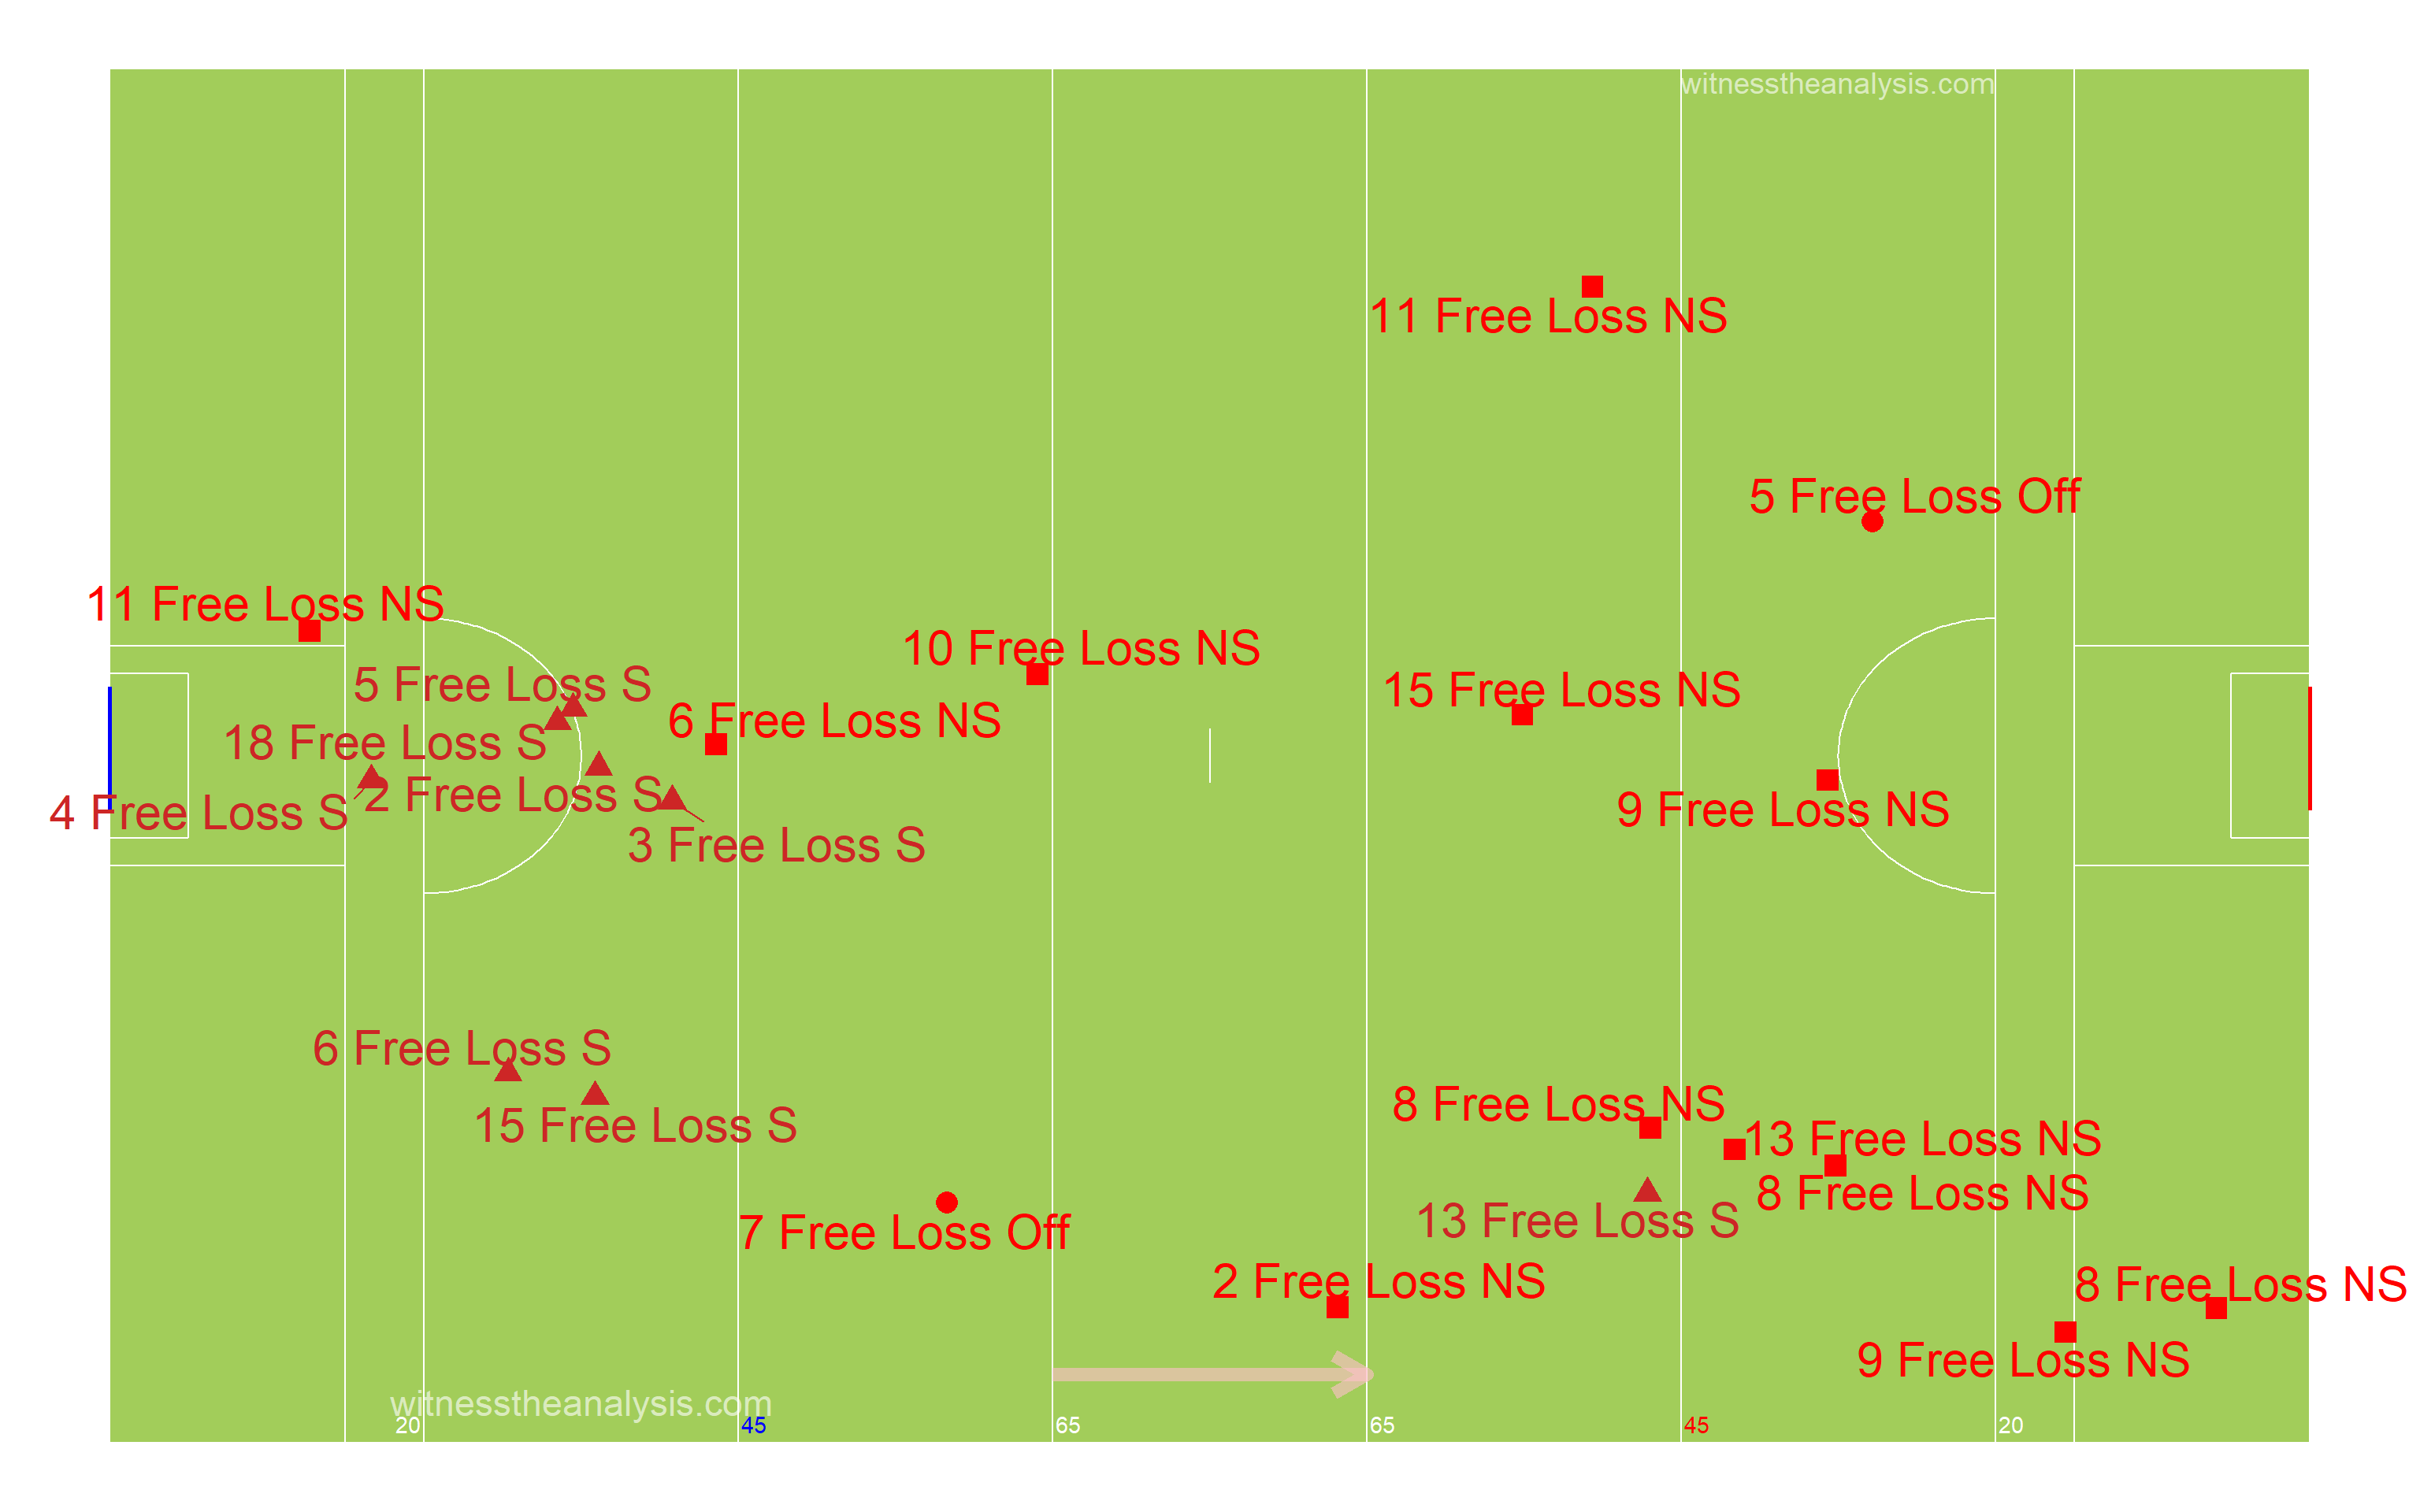
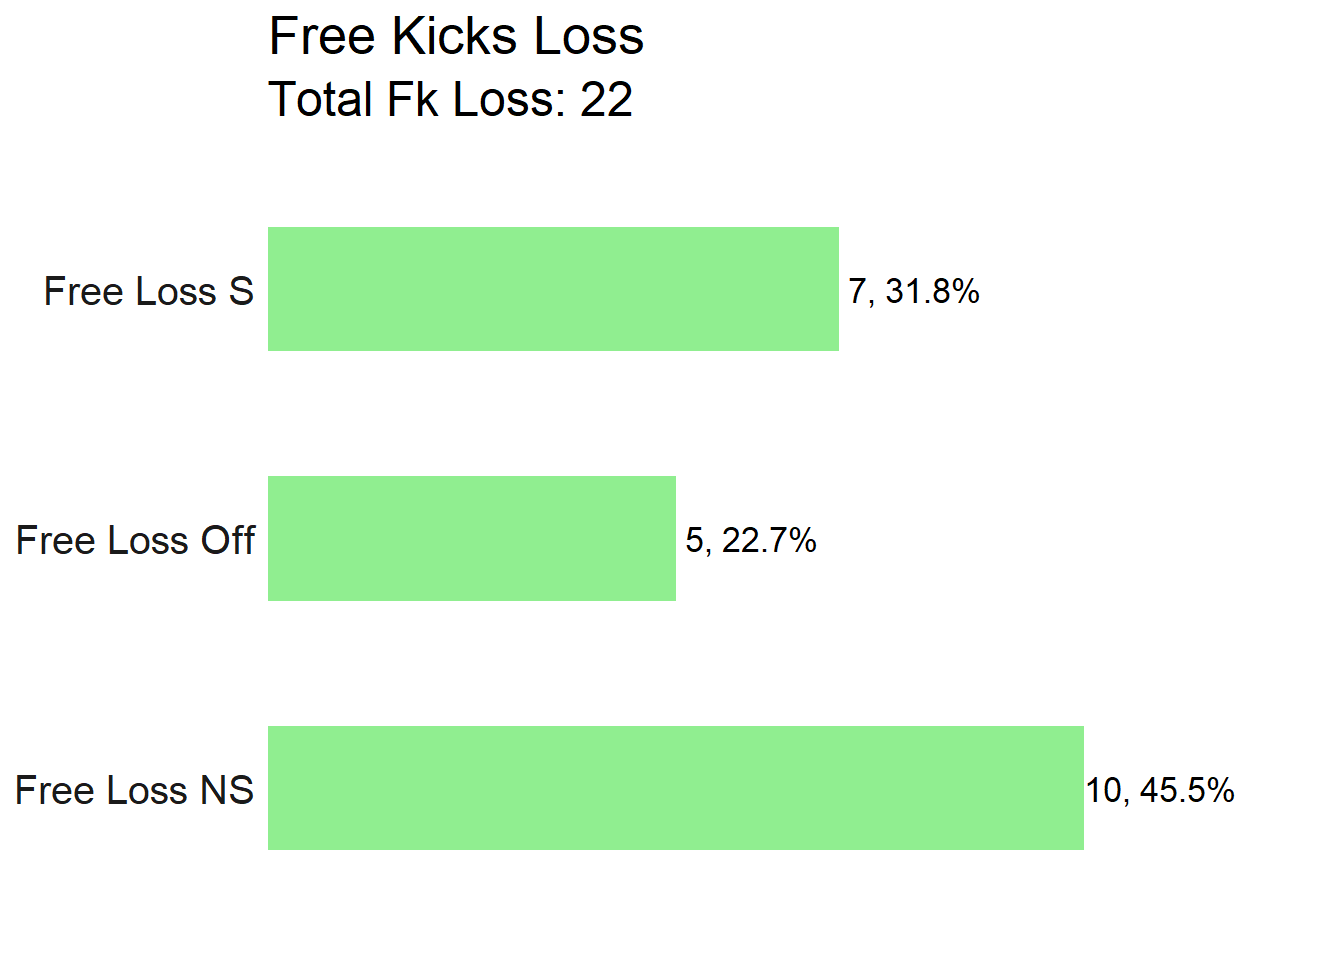
###Ballyboden
#Attacking
##Attacking Stats| . | Shot | Score | shot | score |
|---|---|---|---|---|
| AttTime | 00:07:21 | 00:03:23 | 00:13:10 | 00:05:04 |
| possave | 00:00:23 | 00:00:23 | 00:00:28 | 00:00:20 |
| phaseave | 00:00:14 | 00:00:14 | 00:00:18 | 00:00:14 |
| Origin Type | ||||
| Shot | Score | shot | score | |
| PW | 12 | 5 | 22 | 12 |
| Ko | 7 | 4 | 6 | 3 |
| Pitch Area Origin | ||||
| Shot | Score | shot | score | |
| Def | 12 | 6 | 12 | 5 |
| Def Mid | 2 | 1 | 3 | 1 |
| Att Mid | 2 | 0 | 9 | 8 |
| Att | 3 | 1 | 5 | 1 |
| Poss Duration | ||||
| secs | Shot | Score | shot | score |
| 0-9 | 4 | 2 | 7 | 2 |
| 10-19 | 3 | 1 | 8 | 8 |
| 20-29 | 4 | 3 | 4 | 2 |
| 30-39 | 7 | 3 | 2 | 1 |
| 40-49 | 1 | 0 | 2 | 1 |
| 50-59 | 0 | 0 | 4 | 1 |
| 60-69 | 0 | 0 | 0 | 0 |
| 70+ | 0 | 0 | 2 | 0 |
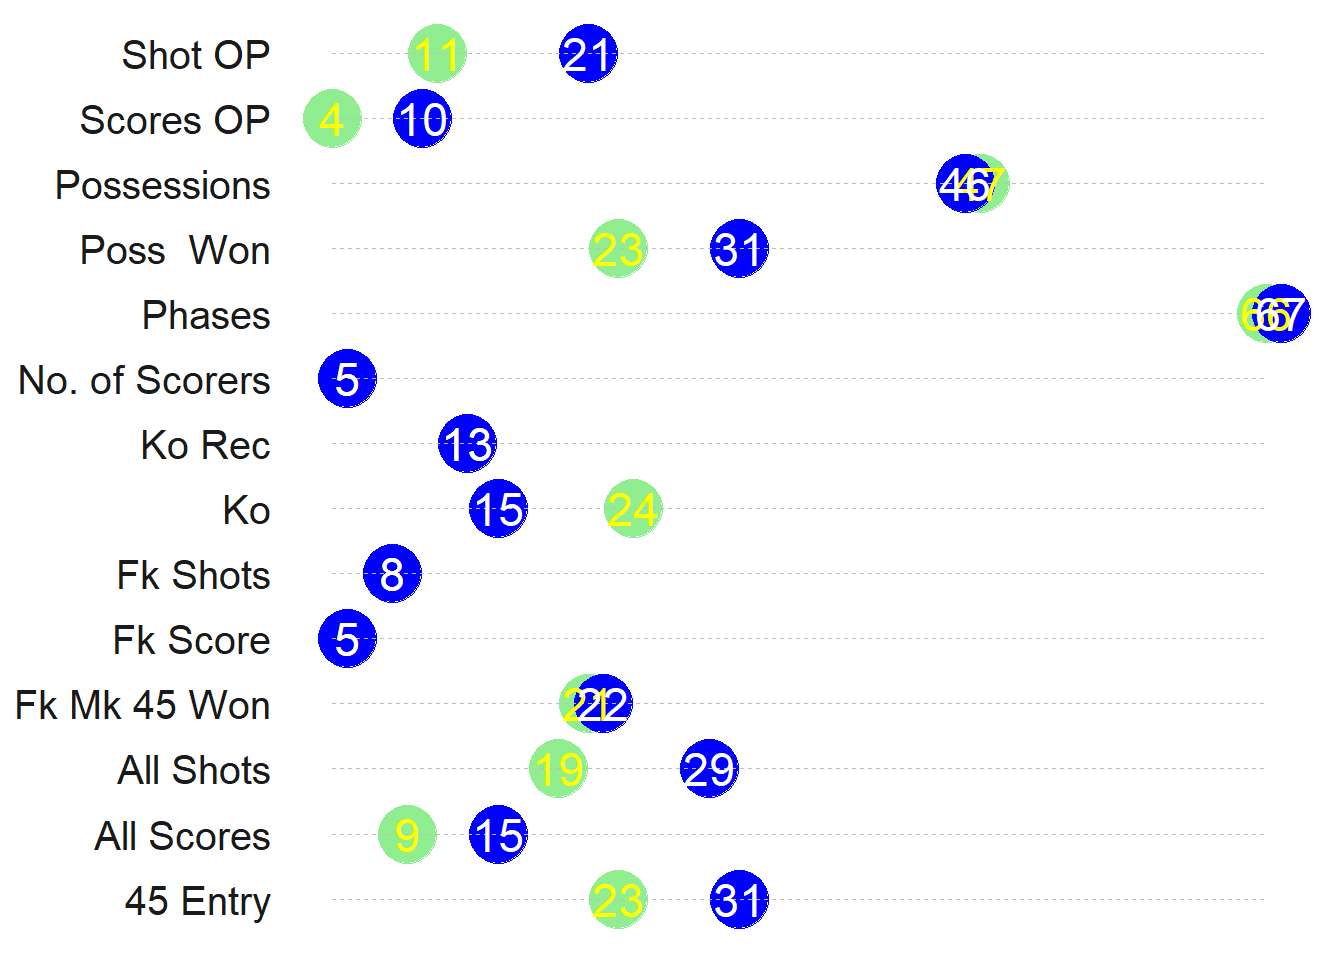
| Team | Poss | Phase | All.Shots | All.Scores | Shots.Per.Poss | Scores.PP | Shots.Op | Scores.Op | Score.Eff.. | Op.Scores.PP |
|---|---|---|---|---|---|---|---|---|---|---|
| Corofin | 40 | 56 | 19 | 11 | 48% | 28% | 15 | 8 | 53% | 20% |
| Pádraig Pearses | 40 | 62 | 18 | 7 | 45% | 18% | 11 | 3 | 27% | 8% |
| Team | Poss Time | Ave Poss Shot | Ave Phase Shot | Ave Poss Scr | Ave Phase Scr | Ave Act Poss | Ave Act Sht | Ave Act Scr | ||
| Corofin | 00:14:25 | 00:00:28 | 00:00:18 | 00:00:27 | 00:00:15 | 12.53 | 16.21 | 16.18 | ||
| Pádraig Pearses | 00:15:36 | 00:00:30 | 00:00:16 | 00:00:36 | 00:00:19 | 13.00 | 15.53 | 18.71 |
| Area | 0-9 | 10-19 | 20-29 | 30-39 | 40-49 | 50-59 | 60-69 | 70+ | Total |
| Def | 0 | 1 | 4 | 6 | 1 | 0 | 0 | 0 | 12 |
| Def Mid | 0 | 1 | 0 | 1 | 0 | 0 | 0 | 0 | 2 |
| Att Mid | 1 | 1 | 0 | 0 | 0 | 0 | 0 | 0 | 2 |
| Att | 3 | 0 | 0 | 0 | 0 | 0 | 0 | 0 | 3 |
| Thomas Davis | Scores | Time (secs) | |||||||
| Area | 0-9 | 10-19 | 20-29 | 30-39 | 40-49 | 50-59 | 60-69 | 70+ | Total |
| Def | 0 | 0 | 3 | 3 | 0 | 0 | 0 | 0 | 6 |
| Def Mid | 0 | 1 | 0 | 0 | 0 | 0 | 0 | 0 | 1 |
| Att Mid | 1 | 0 | 0 | 0 | 0 | 0 | 0 | 0 | 1 |
| Att | 1 | 0 | 0 | 0 | 0 | 0 | 0 | 0 | 1 |
| Ballyboden | Shots | Time (secs) | |||||||
| Area | 0-9 | 10-19 | 20-29 | 30-39 | 40-49 | 50-59 | 60-69 | 70+ | Total |
| Def | 0 | 3 | 3 | 1 | 2 | 2 | 0 | 1 | 12 |
| Def Mid | 0 | 0 | 0 | 1 | 0 | 1 | 0 | 1 | 3 |
| Att Mid | 2 | 5 | 1 | 0 | 0 | 1 | 0 | 0 | 9 |
| Att | 4 | 0 | 0 | 0 | 0 | 0 | 0 | 0 | 4 |
| Ballyboden | Scores | Time (secs) | |||||||
| Area | 0-9 | 10-19 | 20-29 | 30-39 | 40-49 | 50-59 | 60-69 | 70+ | Total |
| Def | 0 | 3 | 1 | 0 | 1 | 0 | 0 | 0 | 5 |
| Def Mid | 0 | 0 | 0 | 1 | 0 | 0 | 0 | 0 | 1 |
| Att Mid | 1 | 5 | 1 | 0 | 0 | 1 | 0 | 0 | 8 |
| Att | 1 | 0 | 0 | 0 | 0 | 0 | 0 | 0 | 1 |
| Line.Colour | Time.secs |
|---|---|
| black | 1-9 |
| blue | 10-19 |
| red | 20-29 |
| purple | 30-39 |
| yellow | 40-49 |
| white | 50-59 |
| orange | 60-69 |
| pink | 70+ |
| Dot Colours | |
| Black & White | Ko Rec’d |
| White & Black | PW |
| Blue & White | Fk Pass |
| Red & White | Op Shot |
| Purple & White | Fk Shot |
| Green & White | 45 |
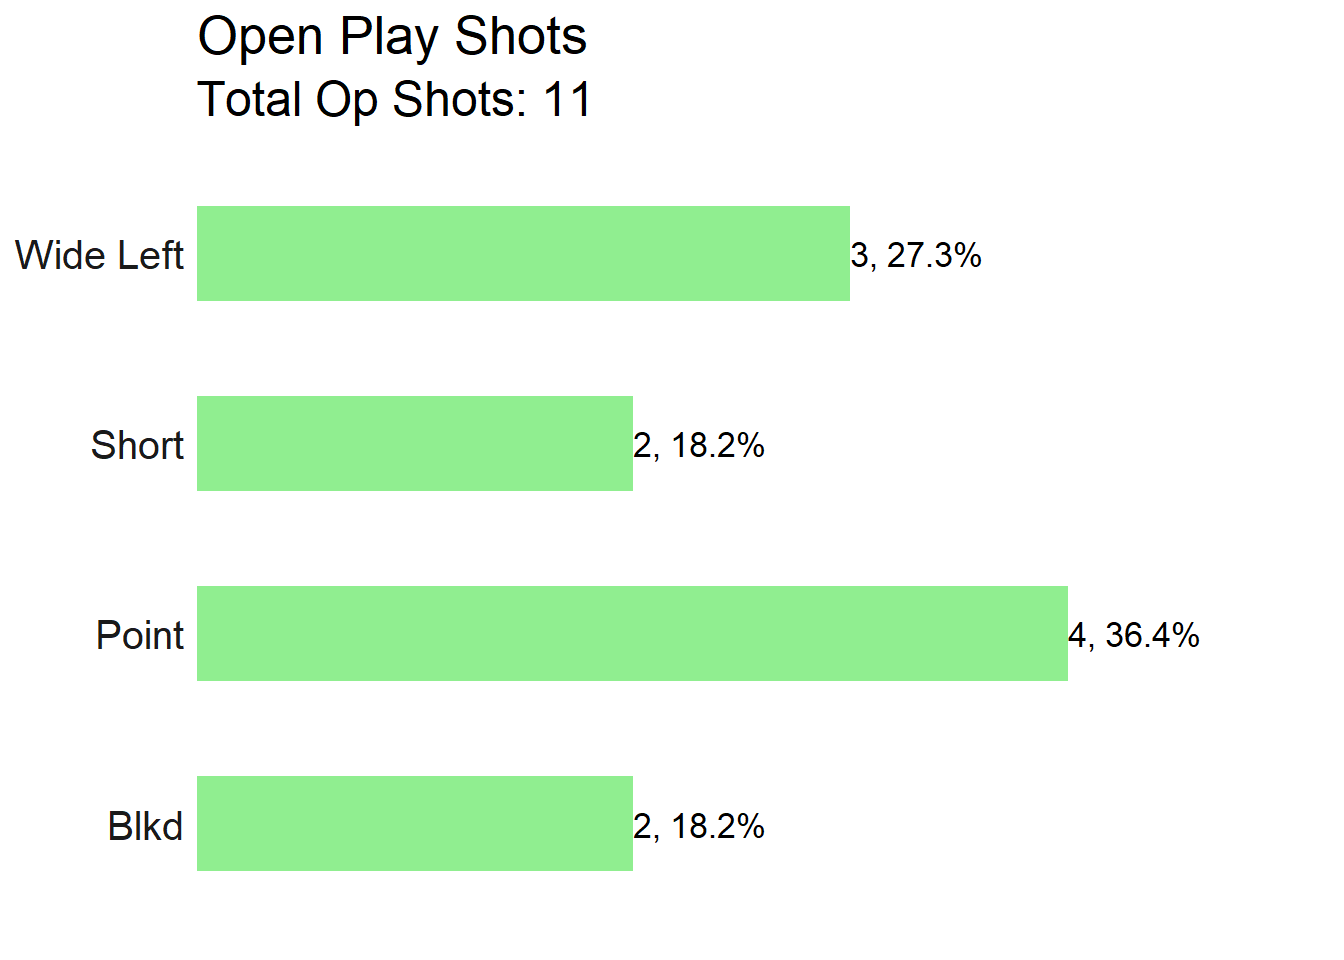
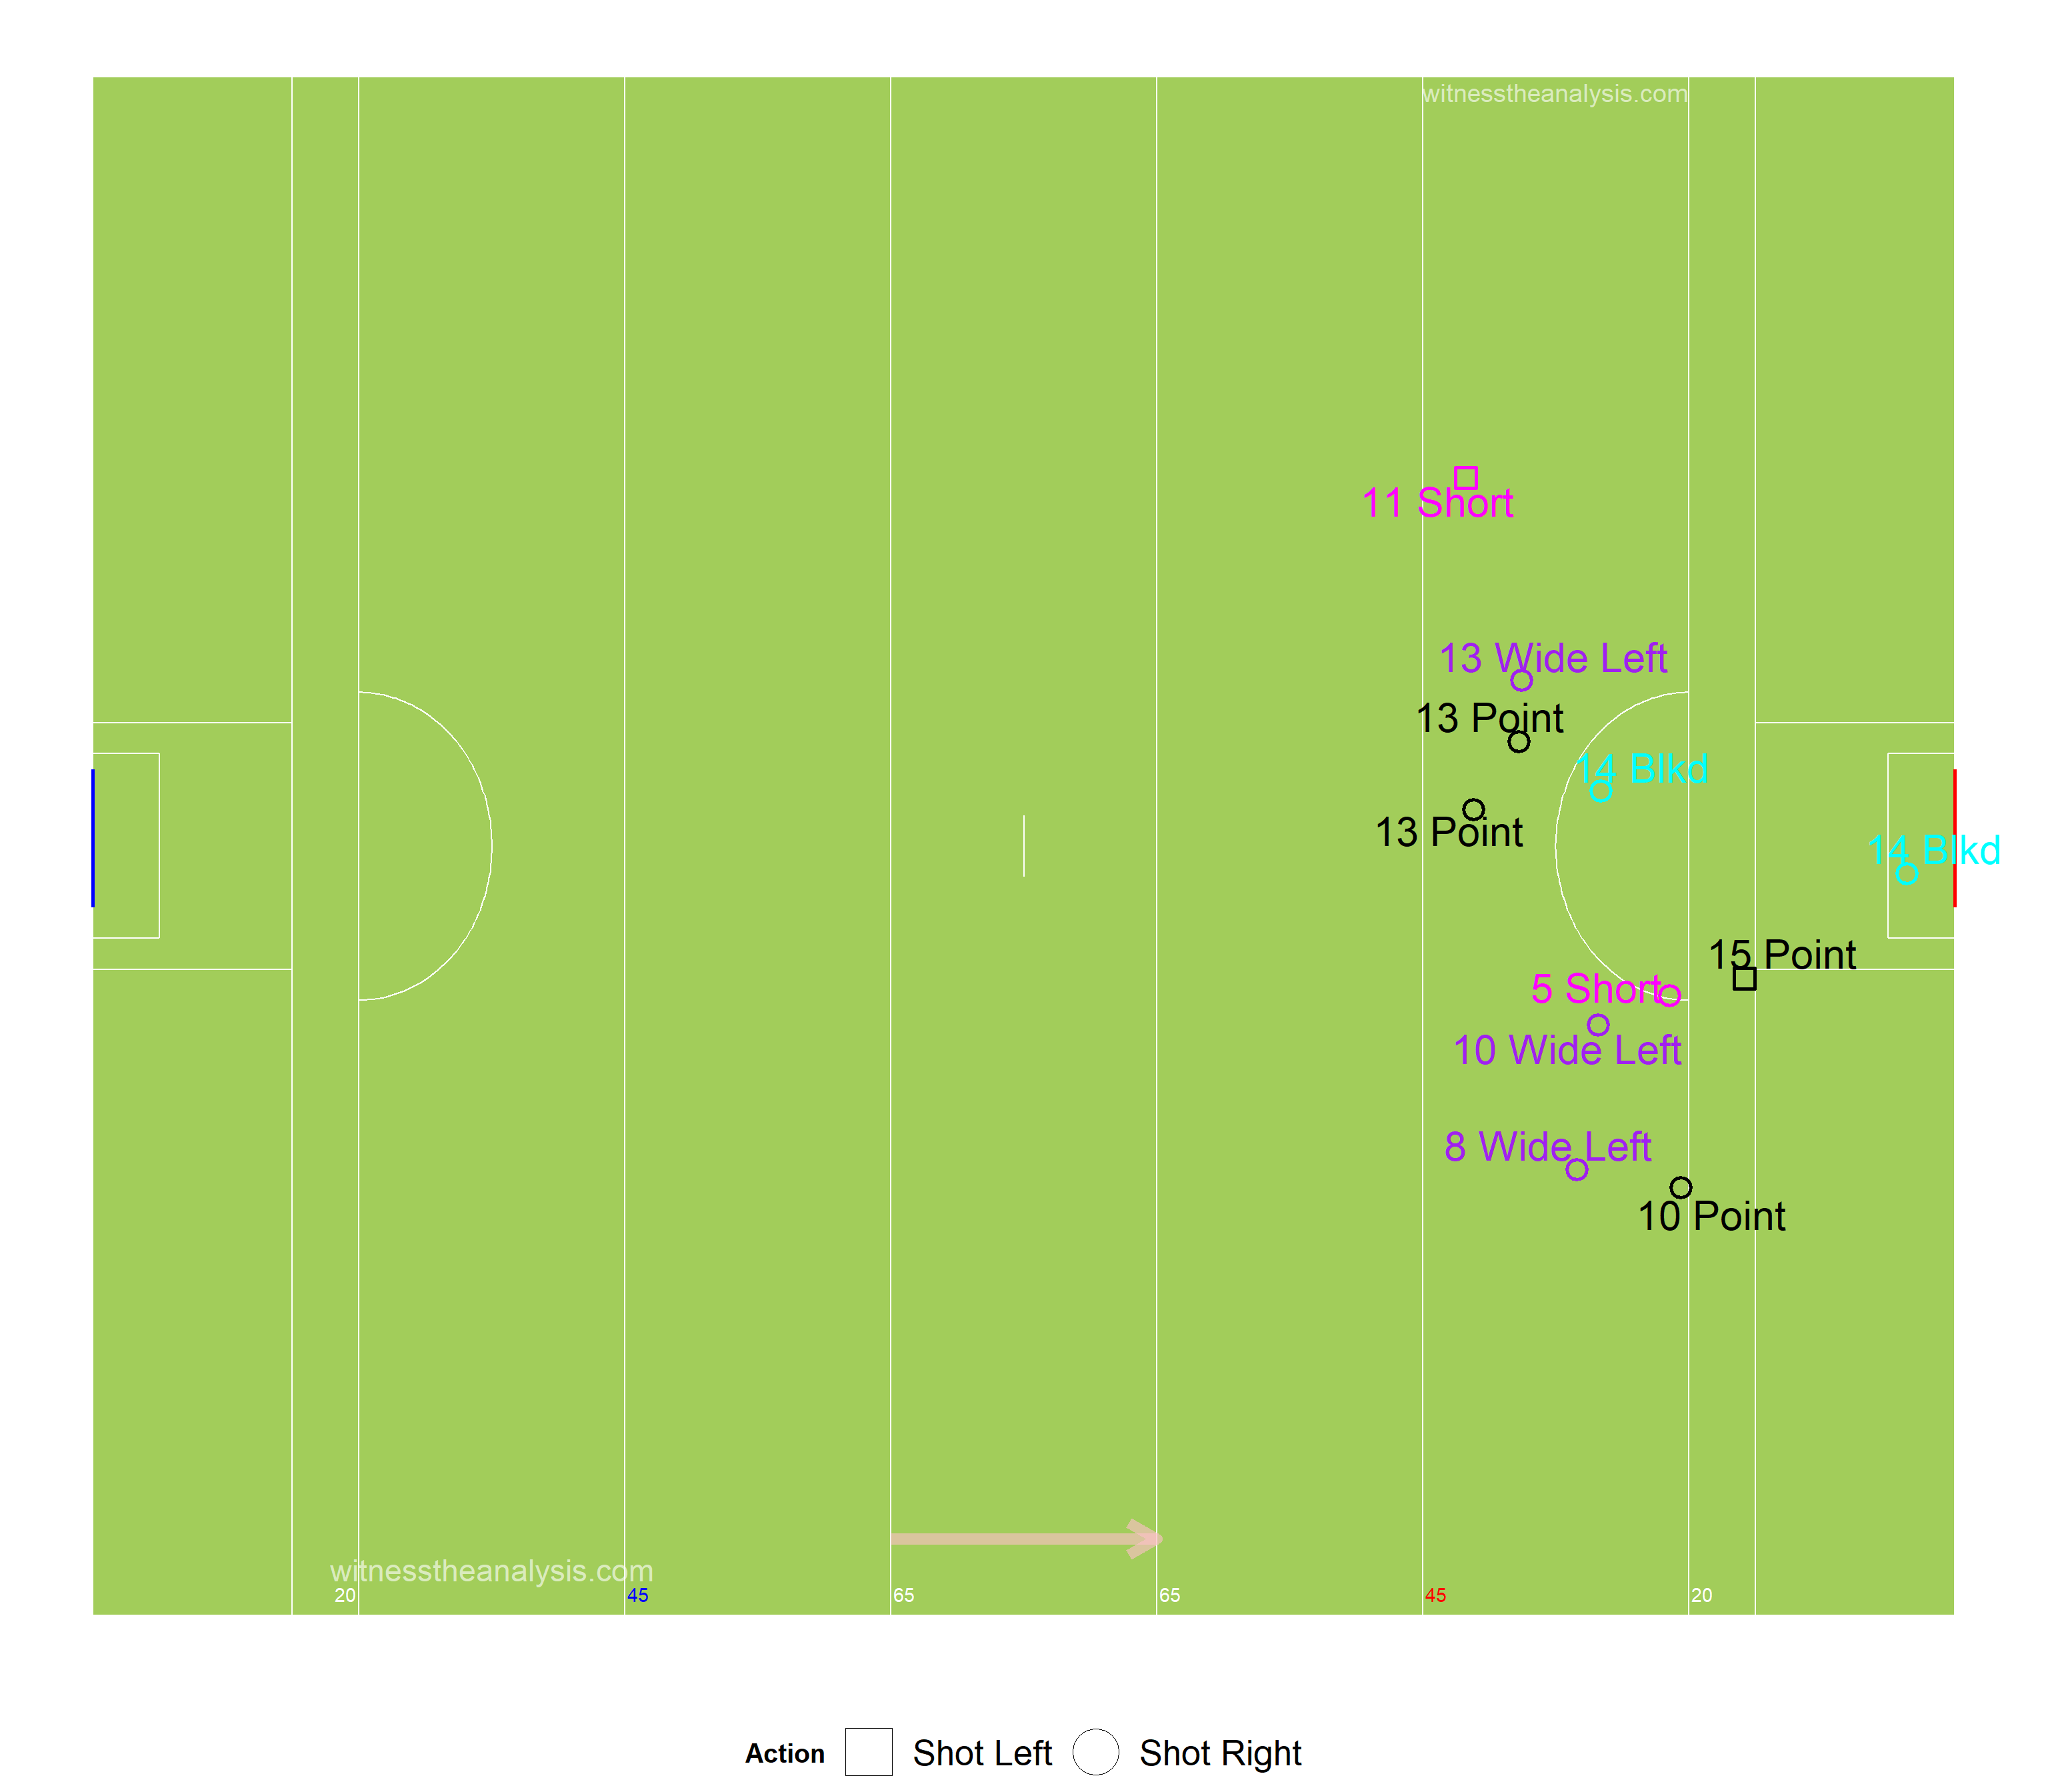
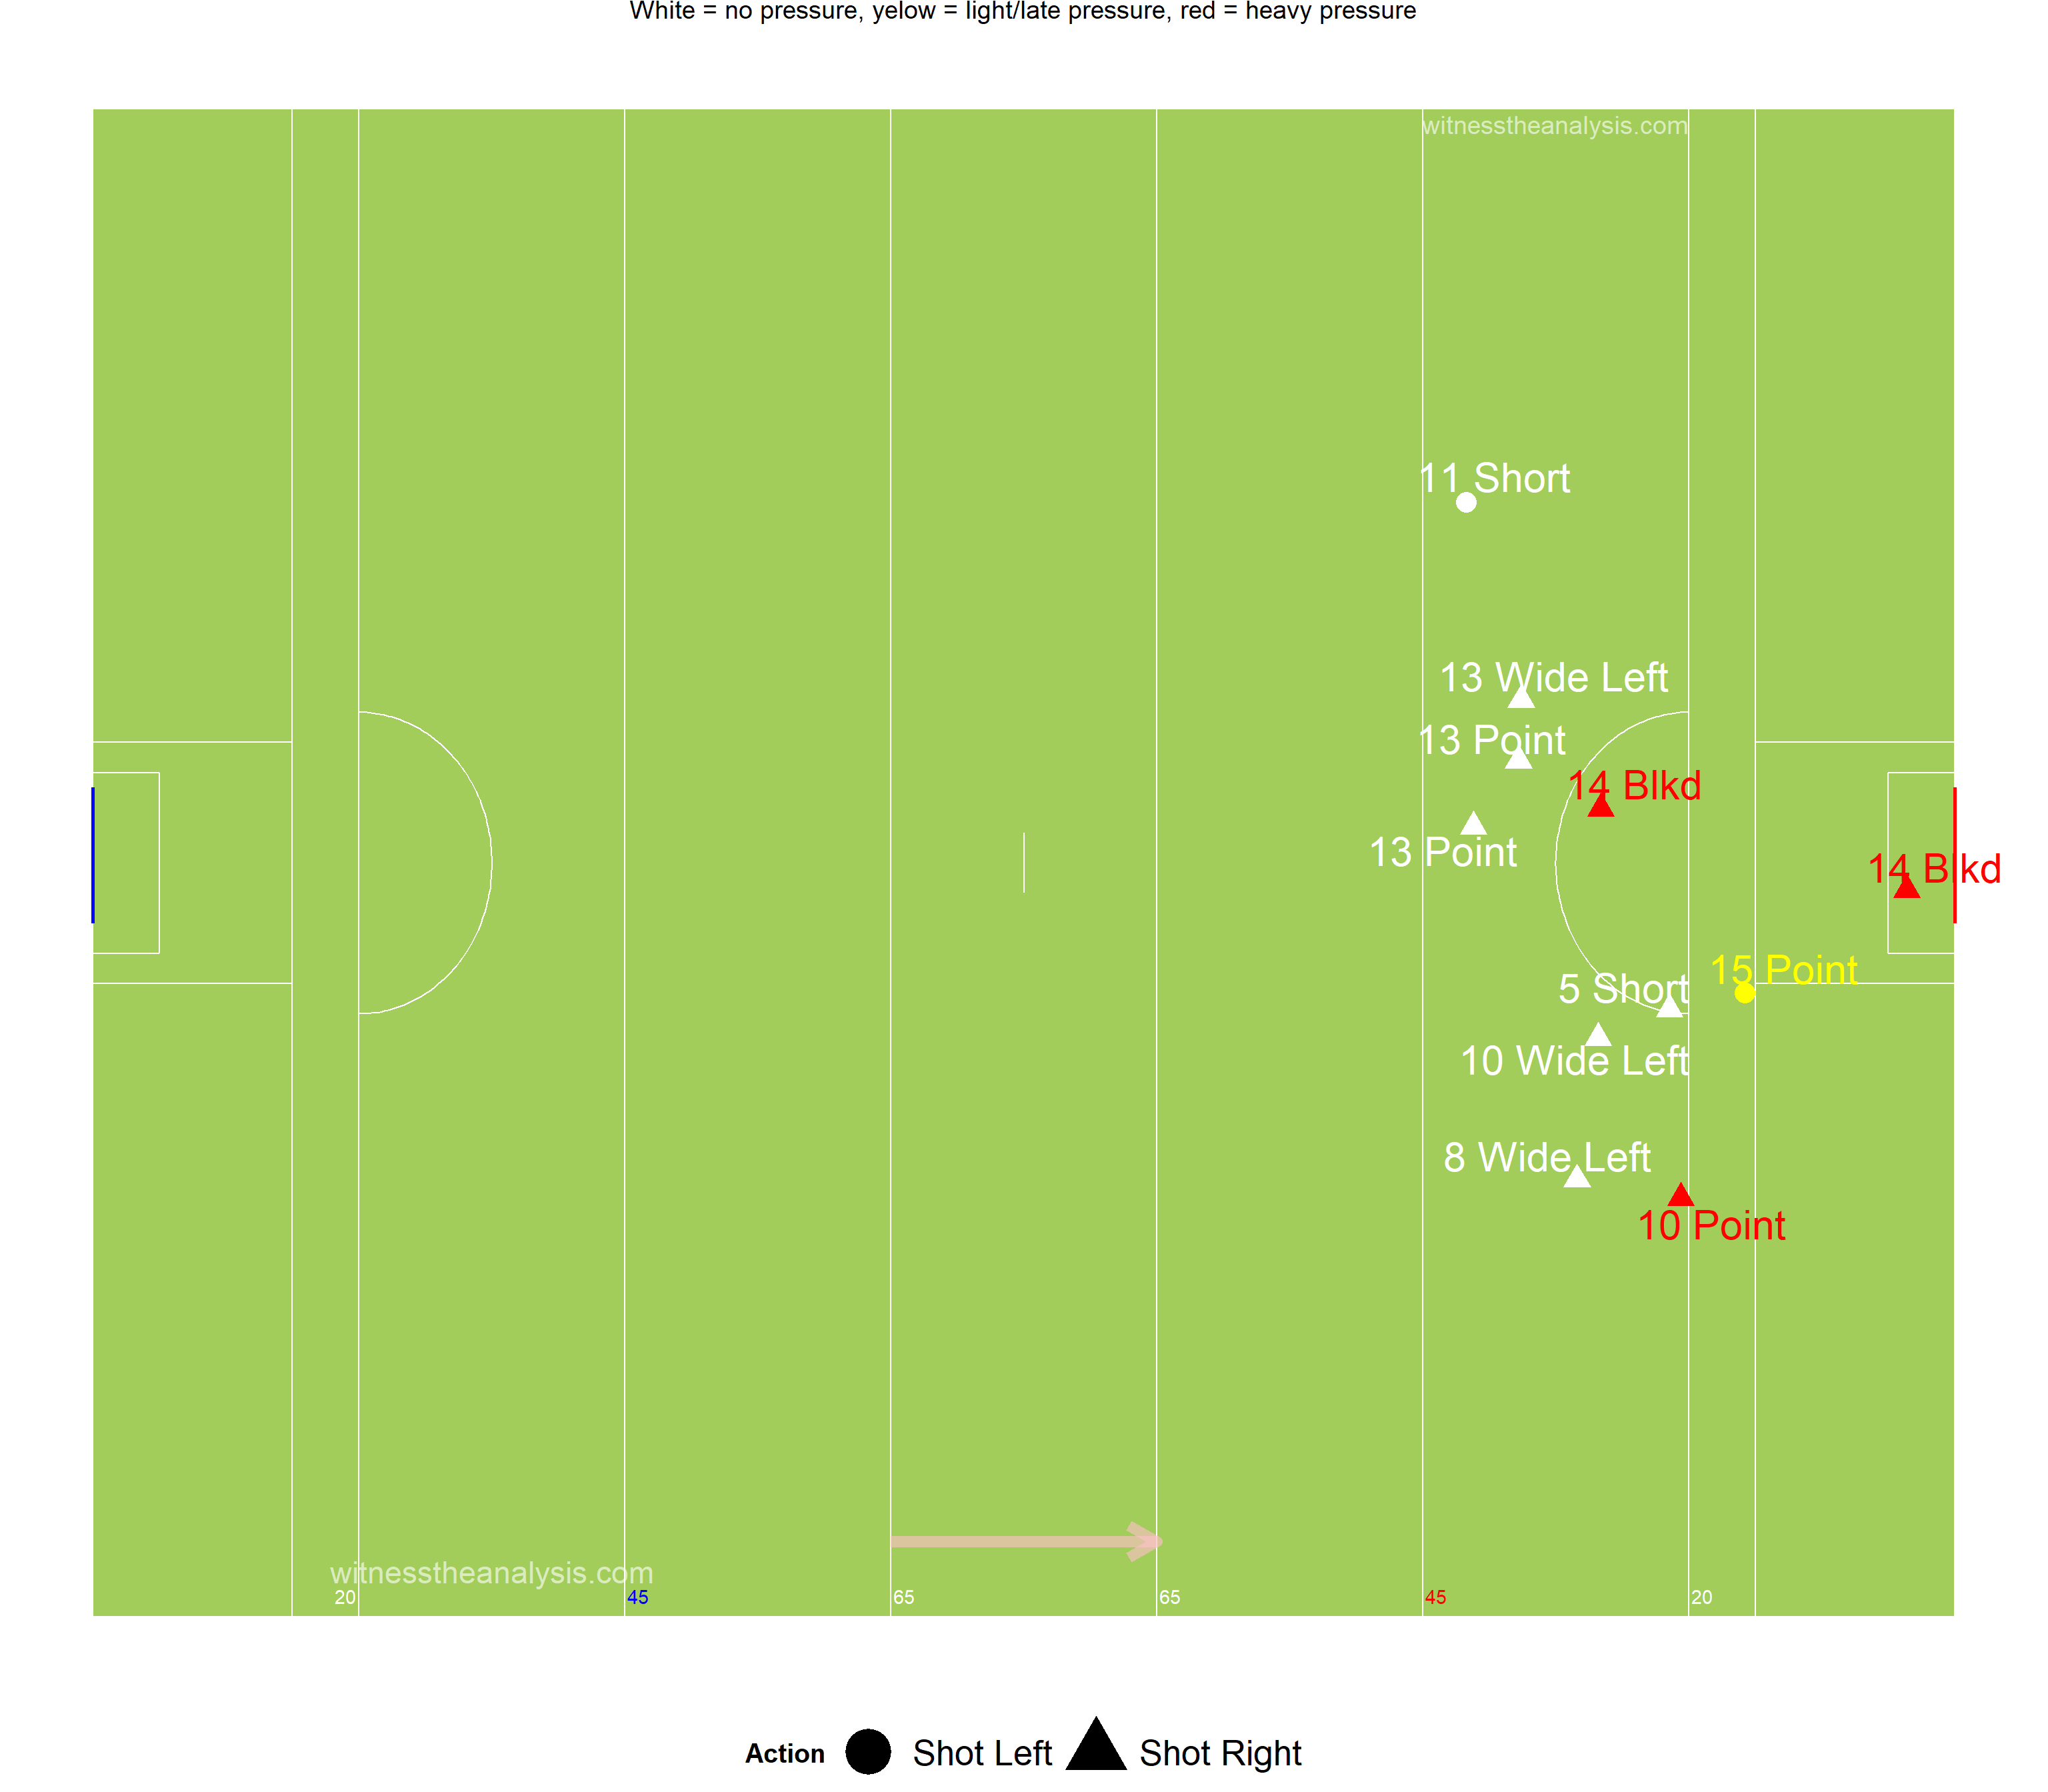
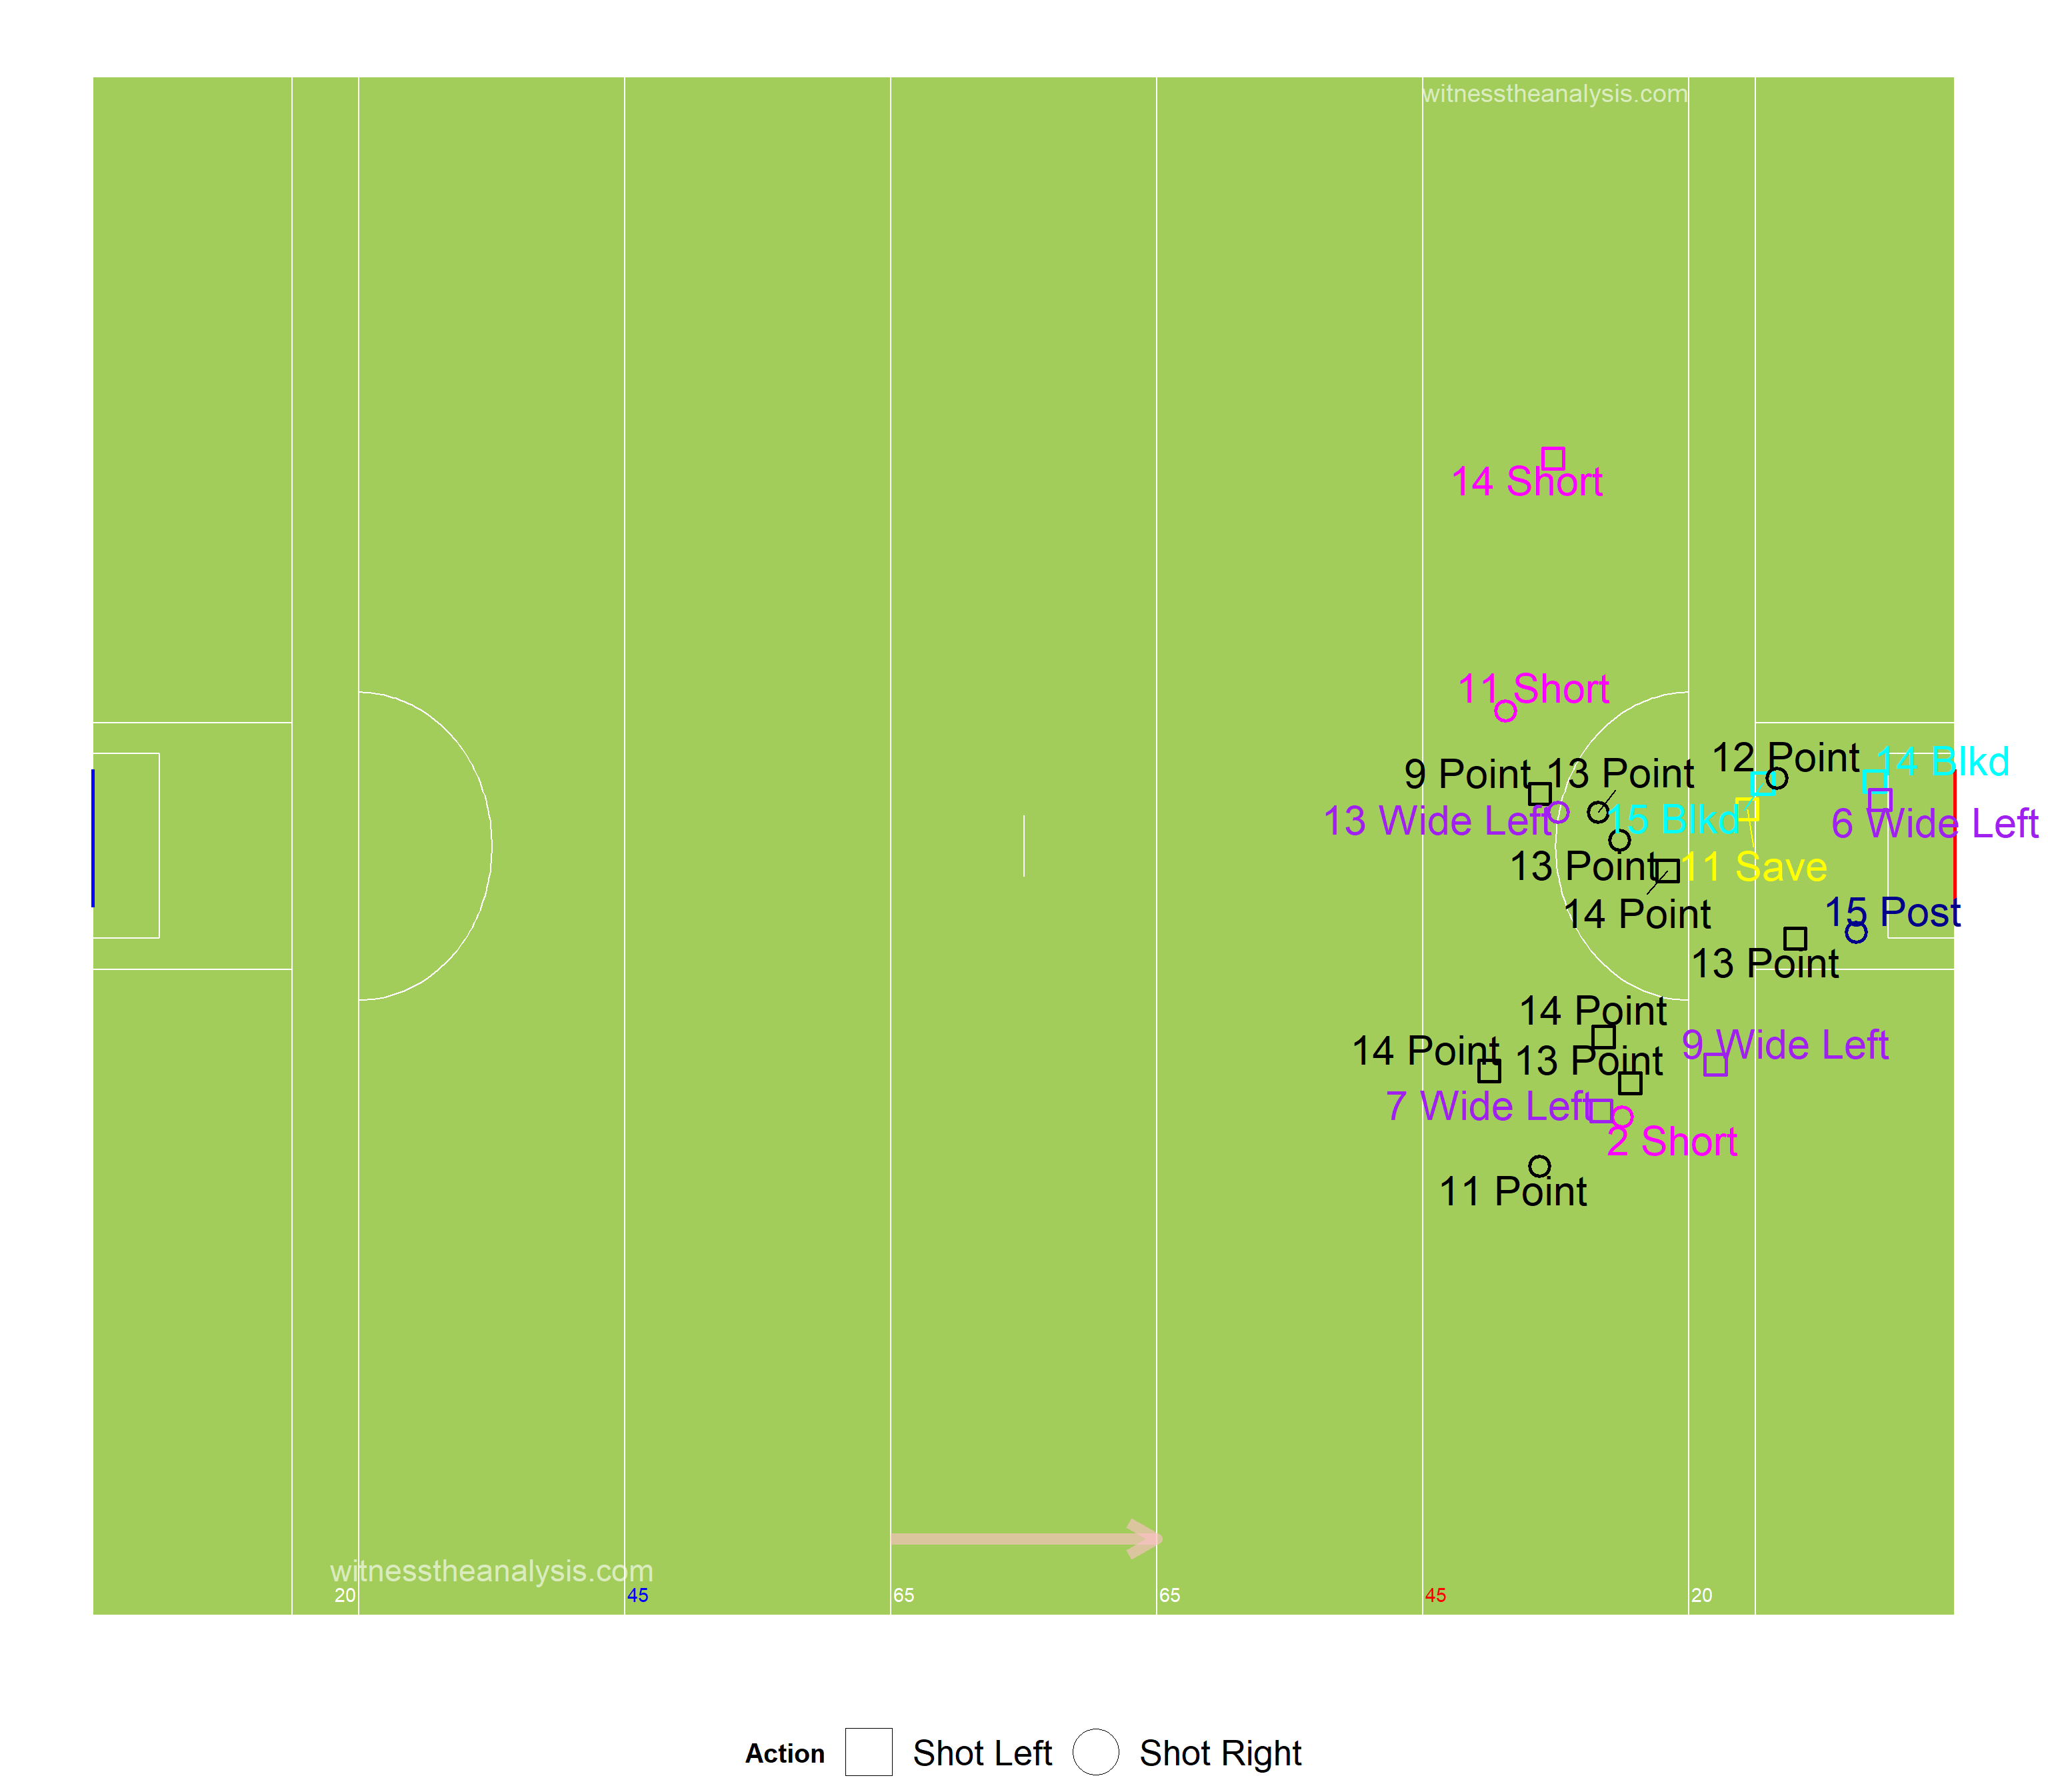
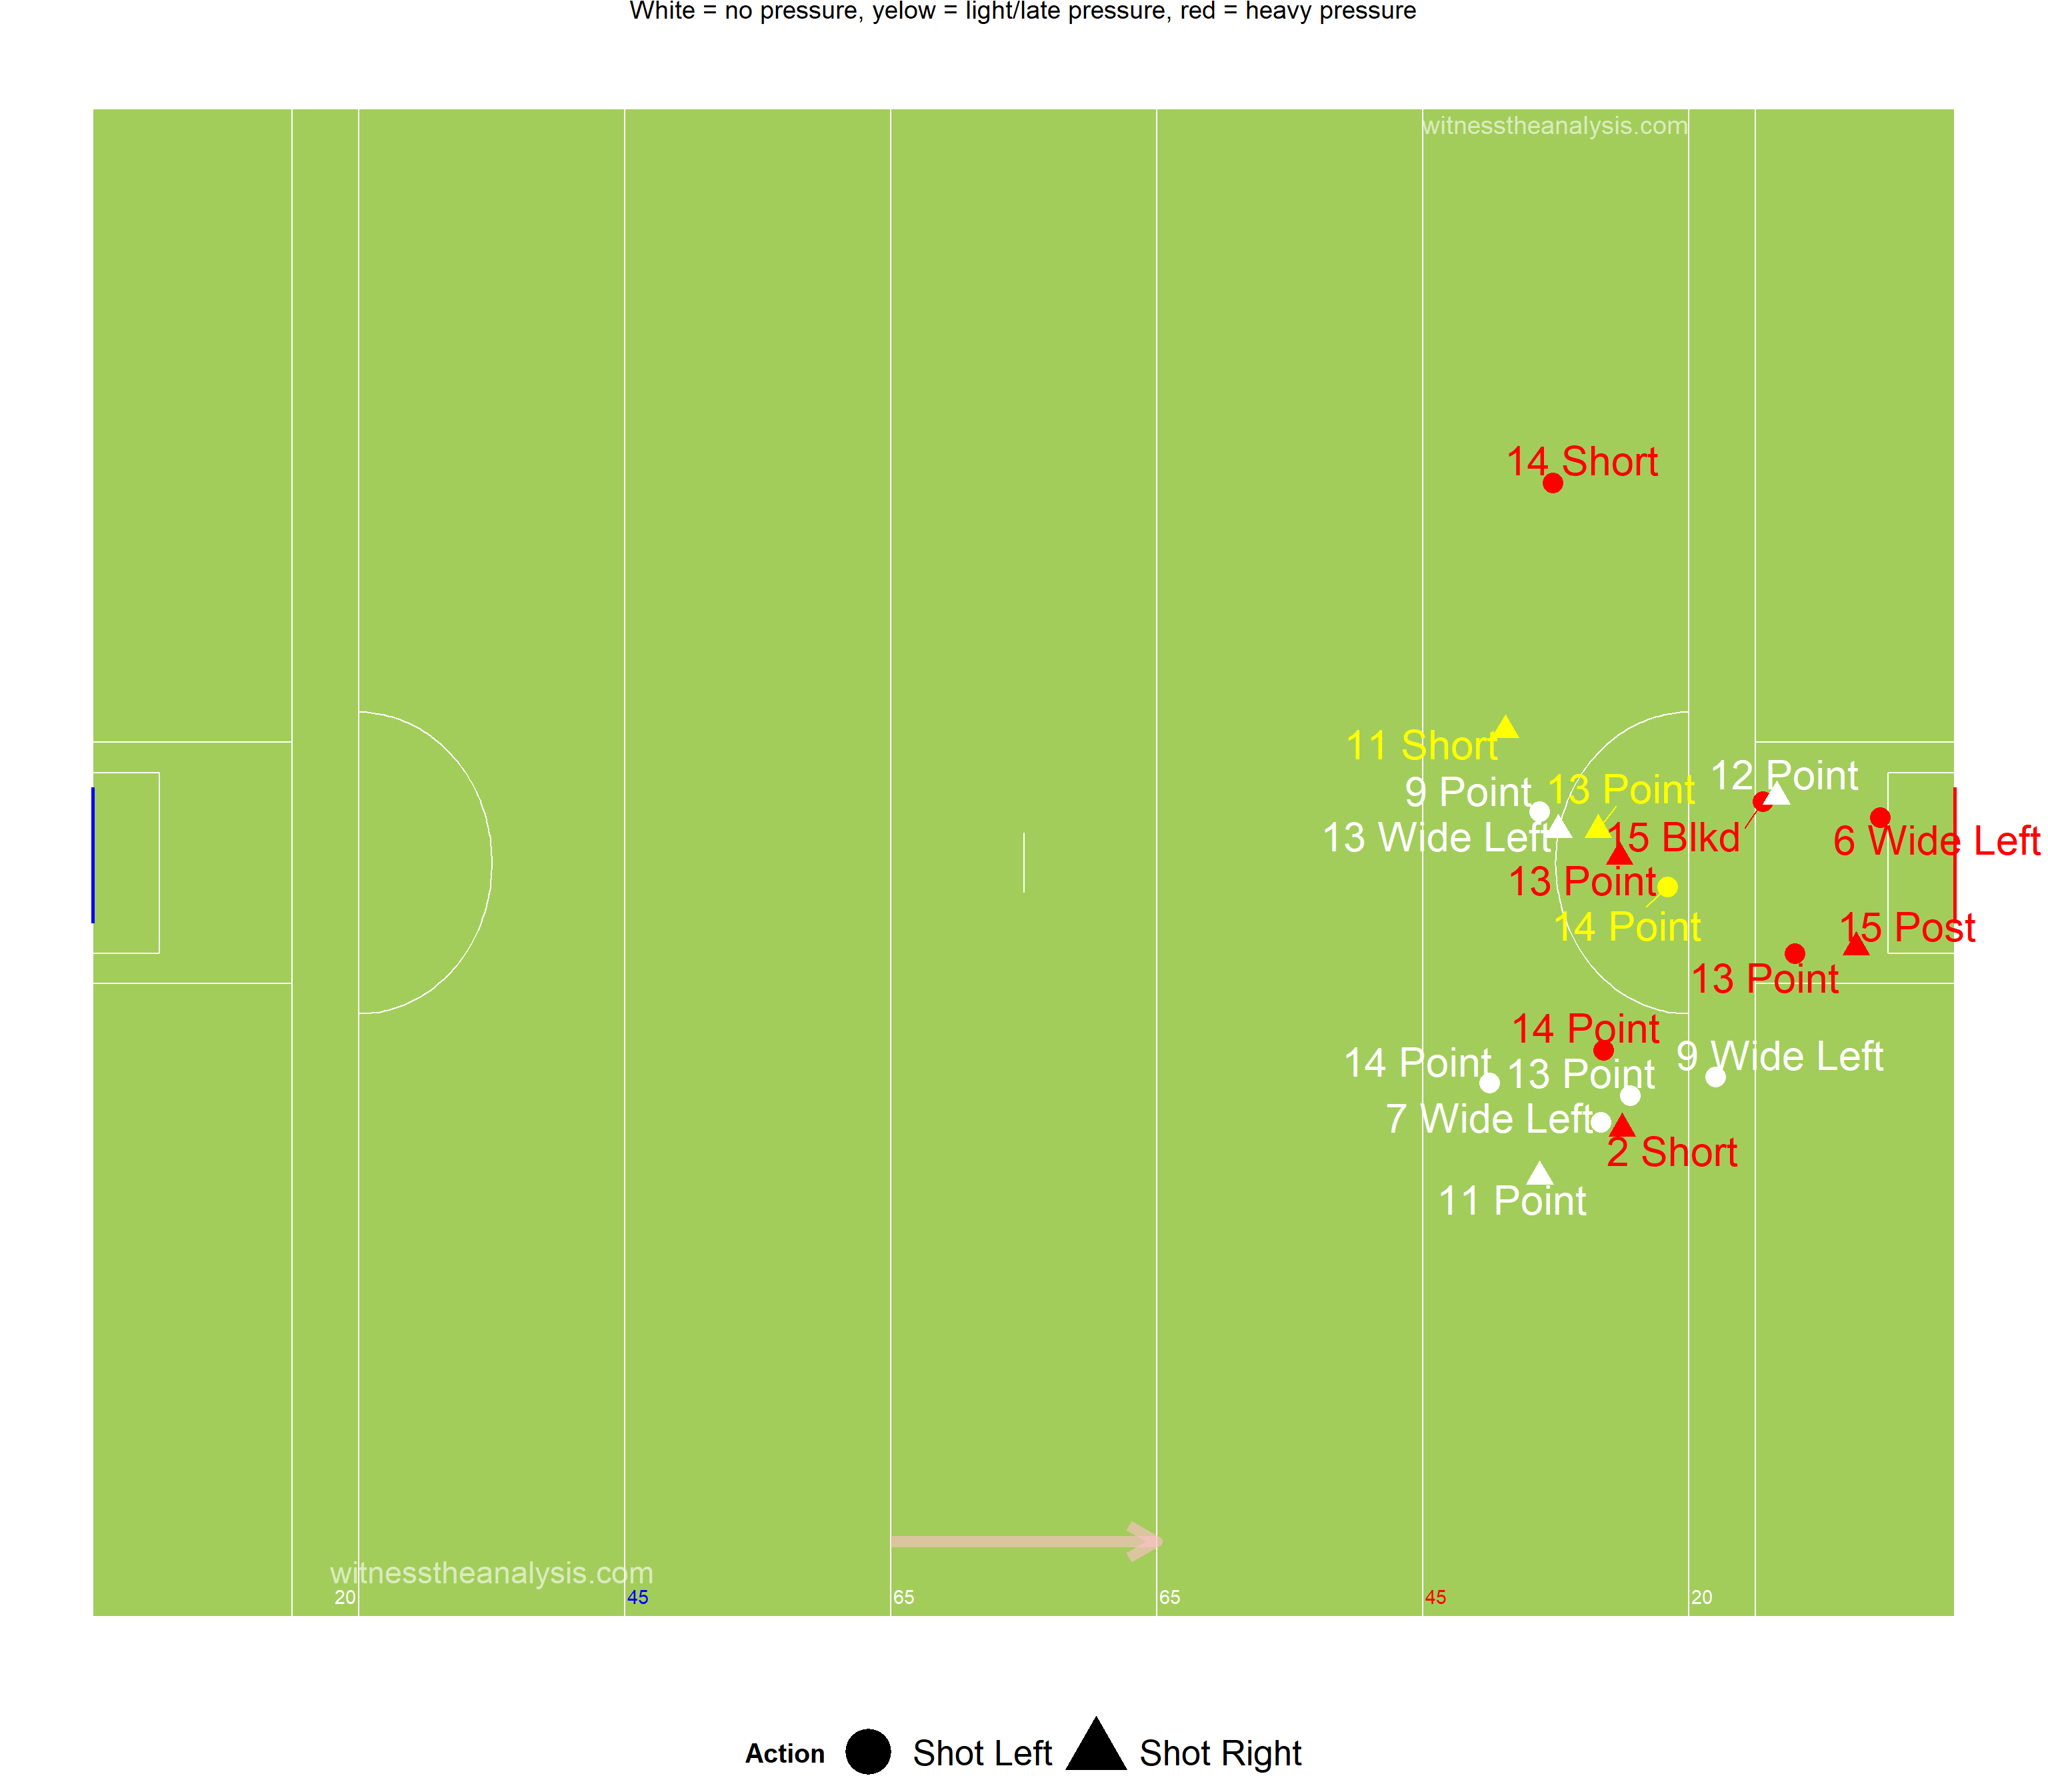
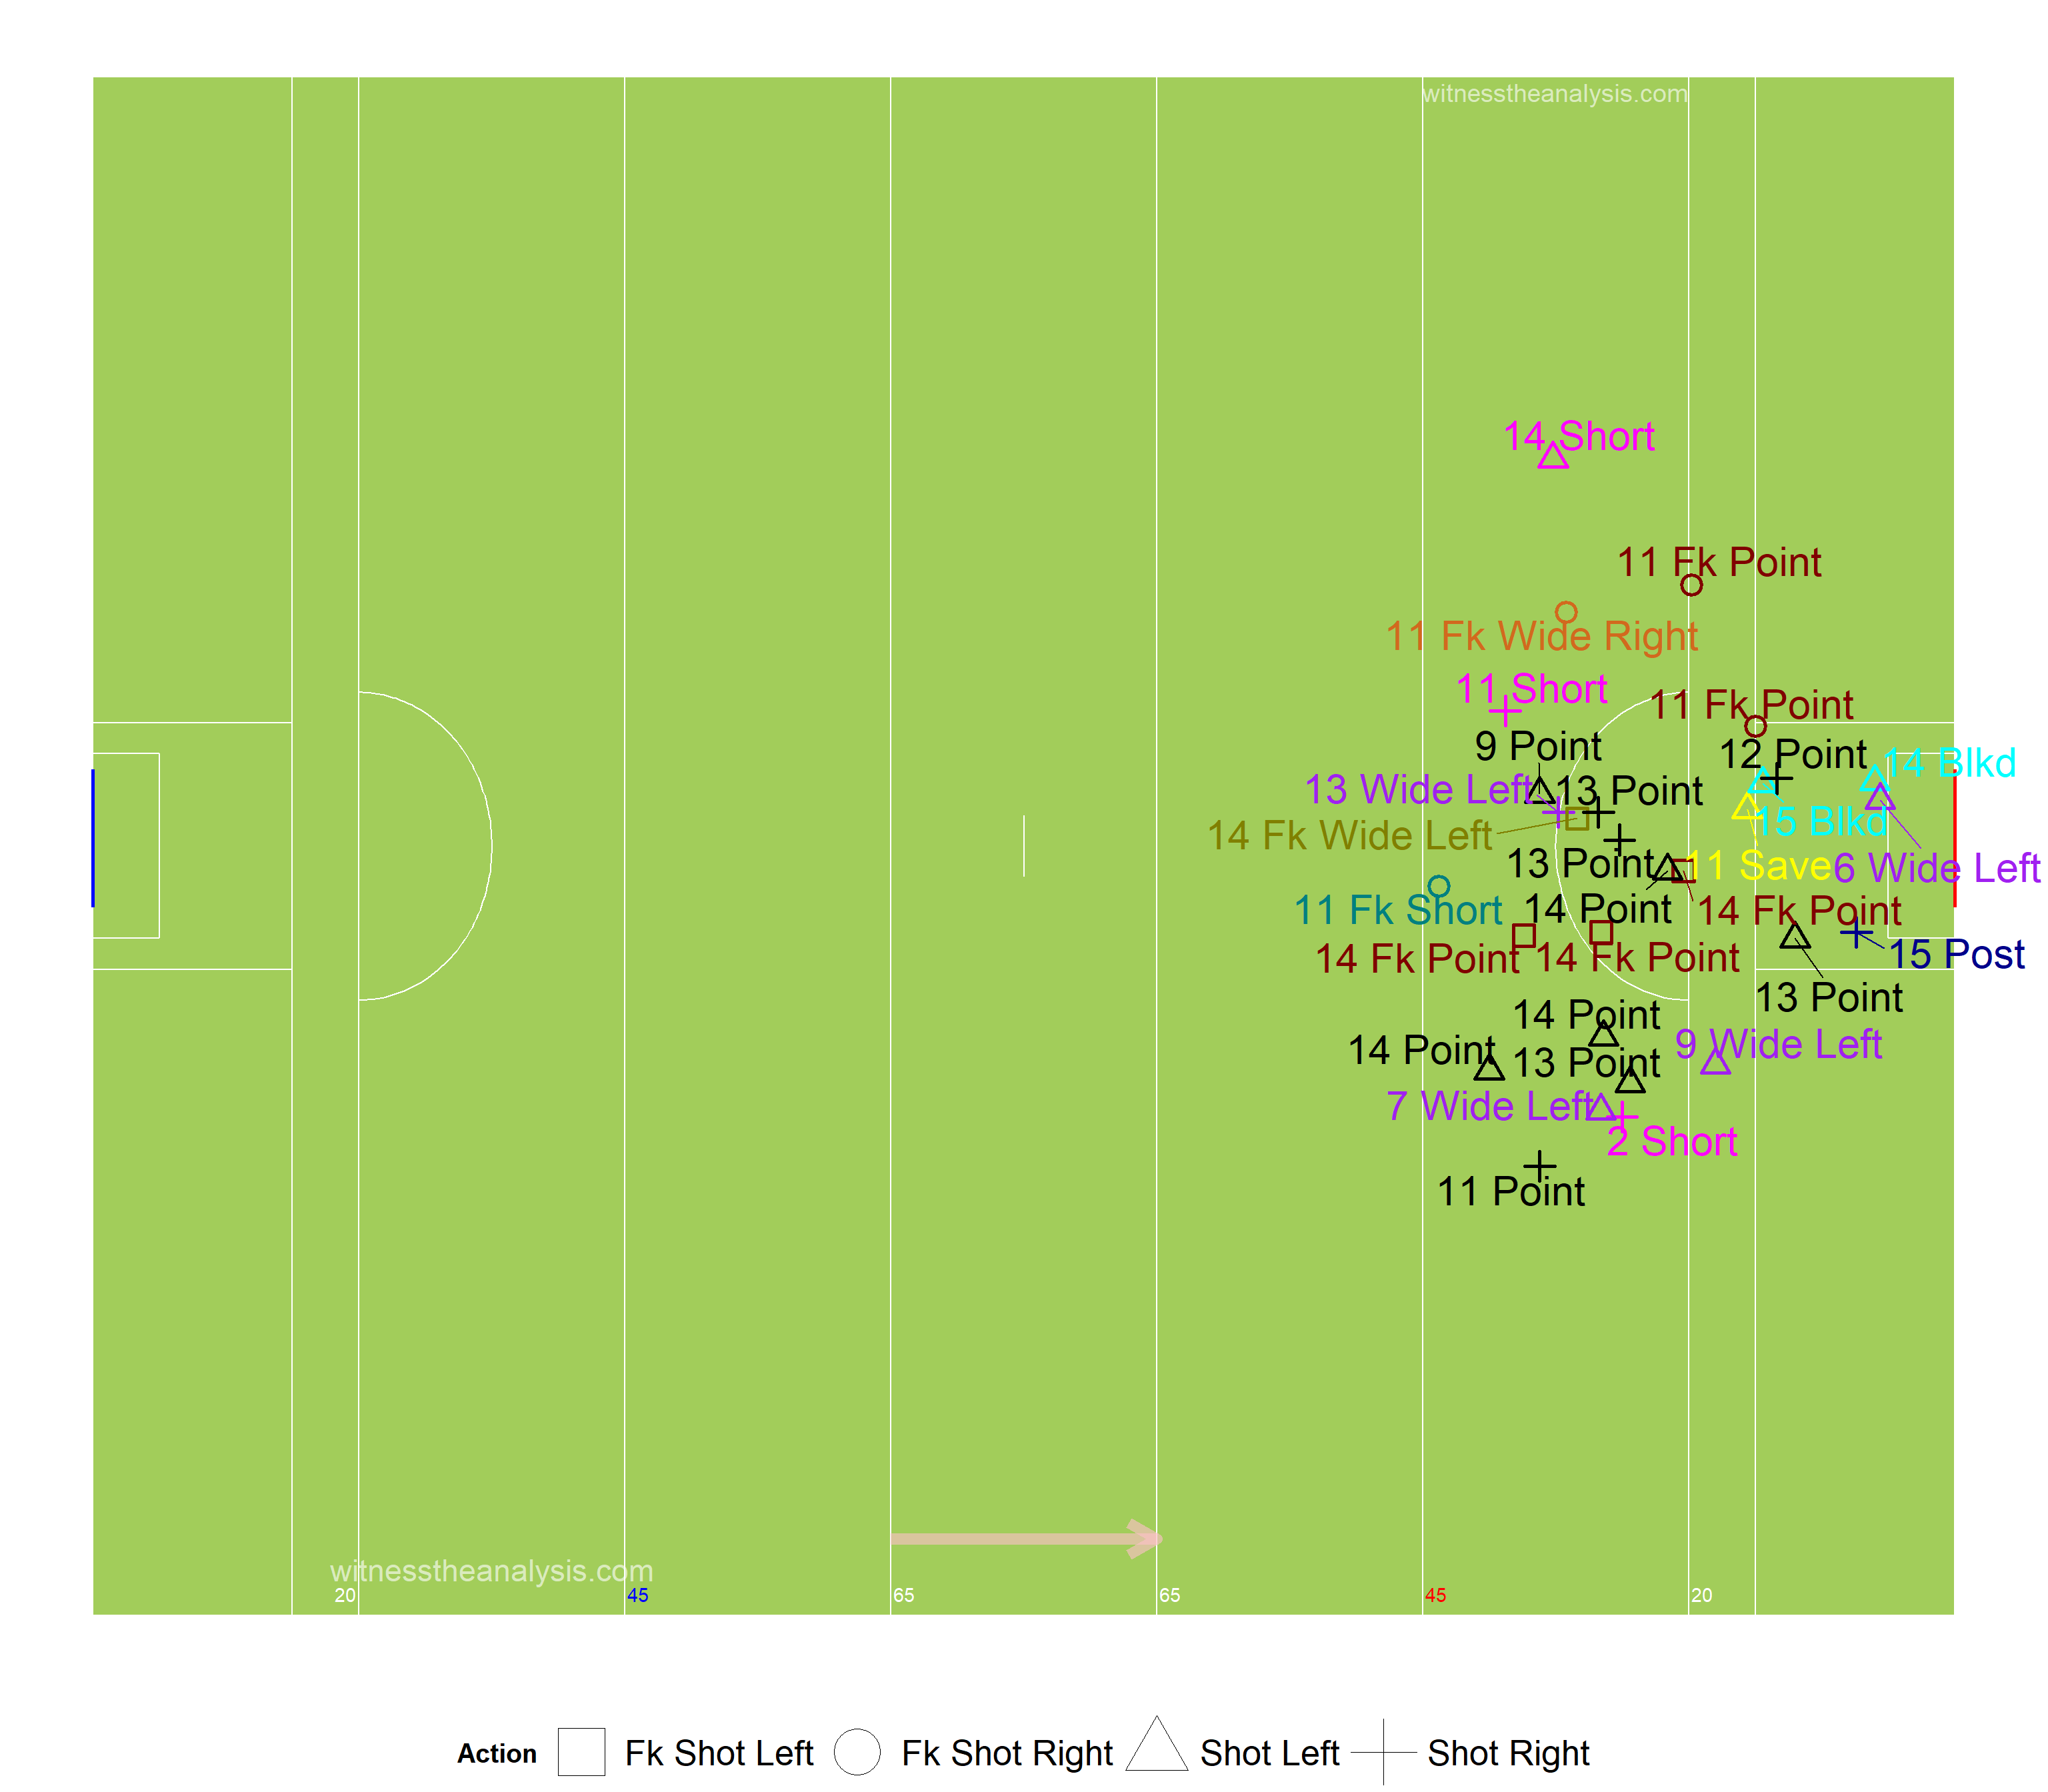
##Open Play Shots - Location & Outcome
###Thomas Davis
###Shot Efficiency - Thomas Davis 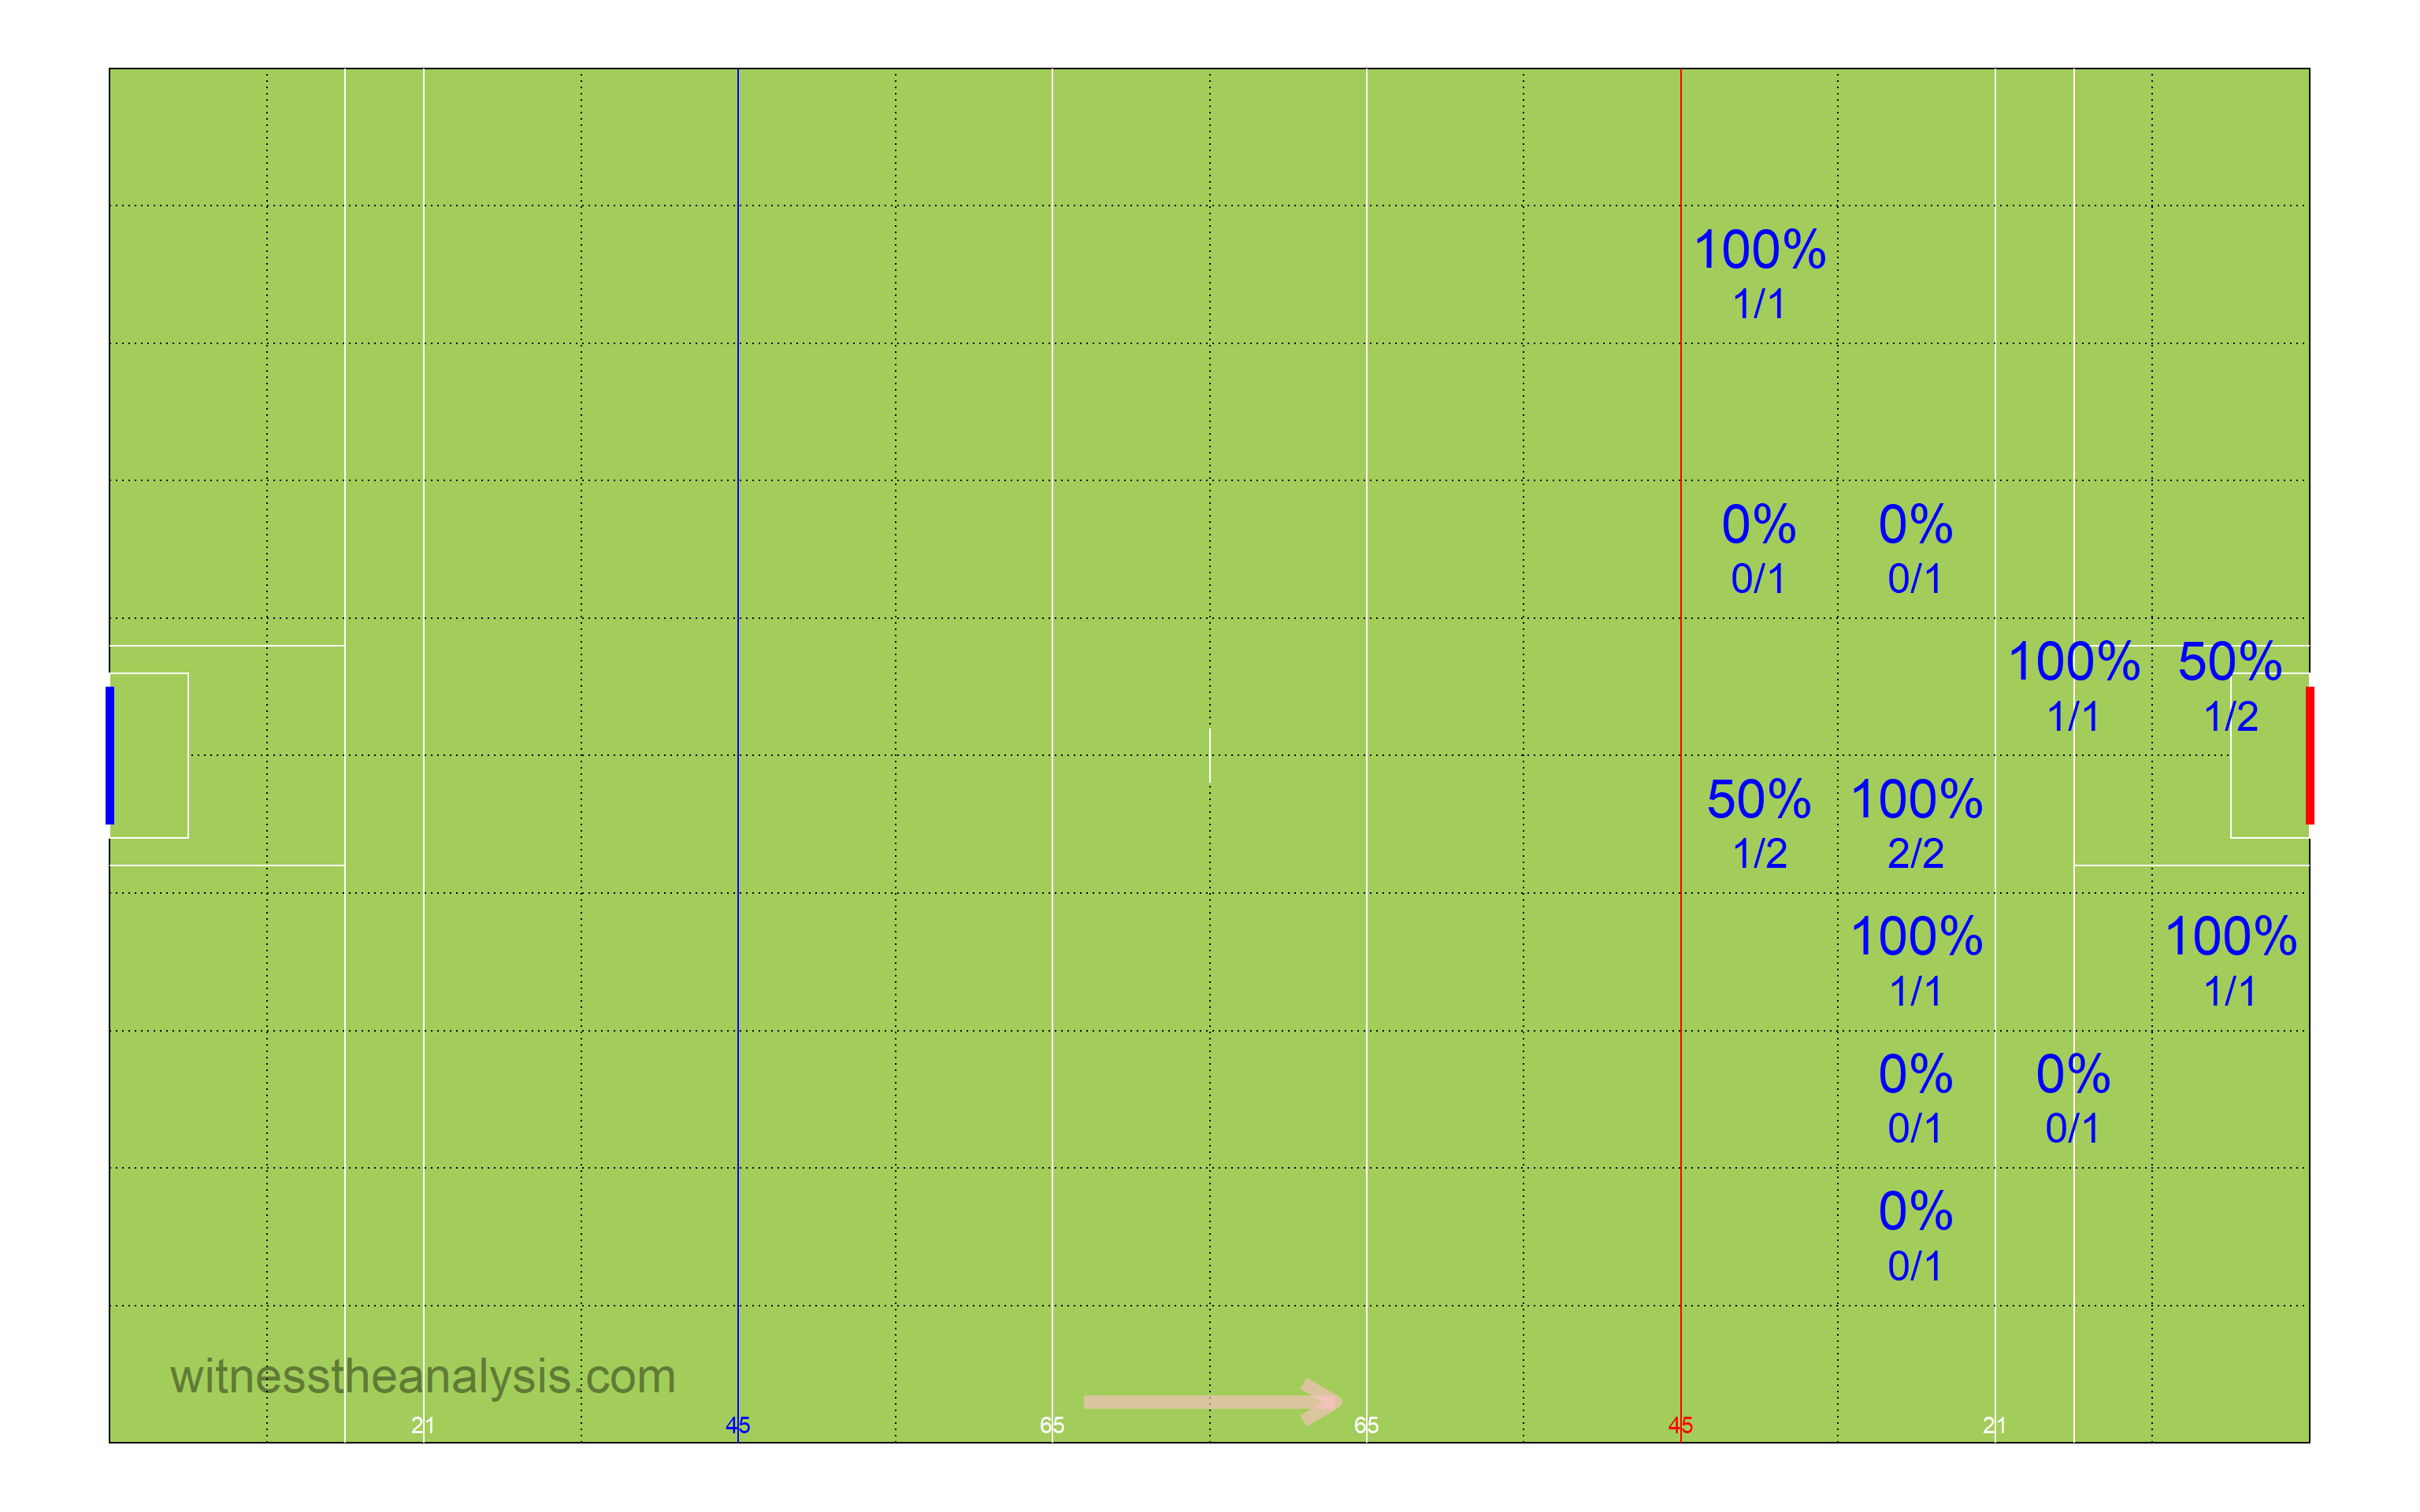
###Shot Pressure - Thomas Davis
###Shot Density 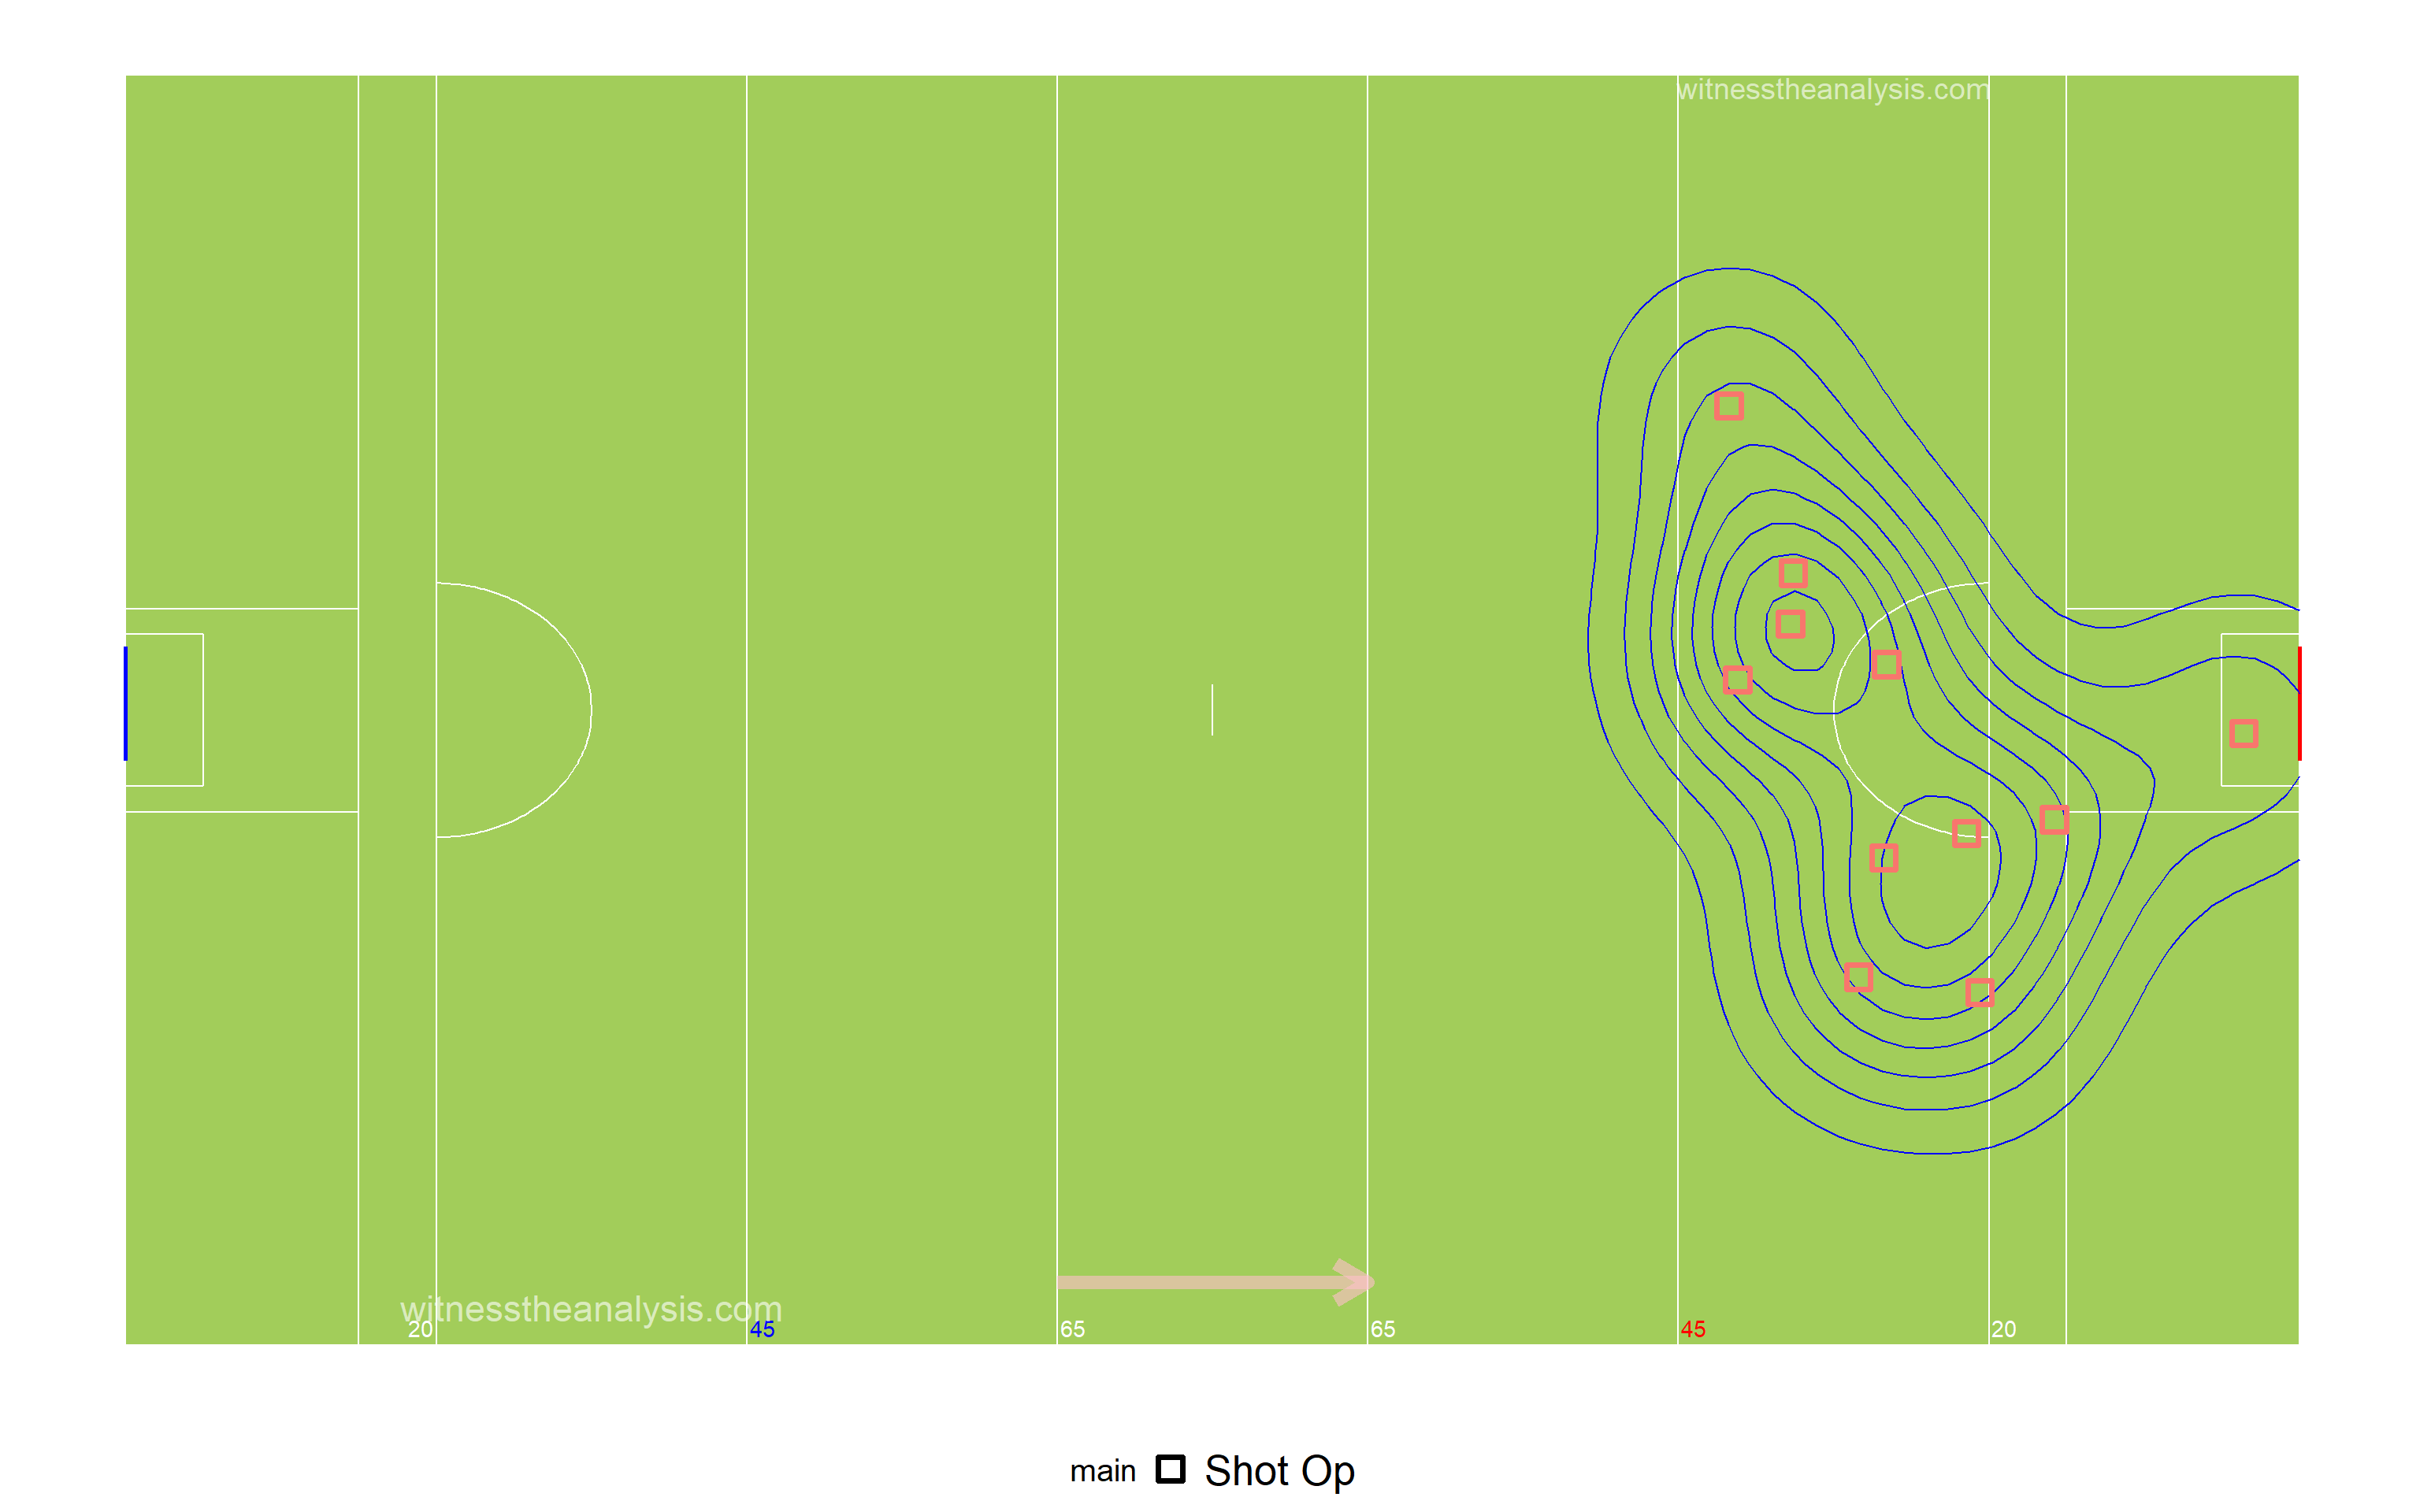
###Ballyboden 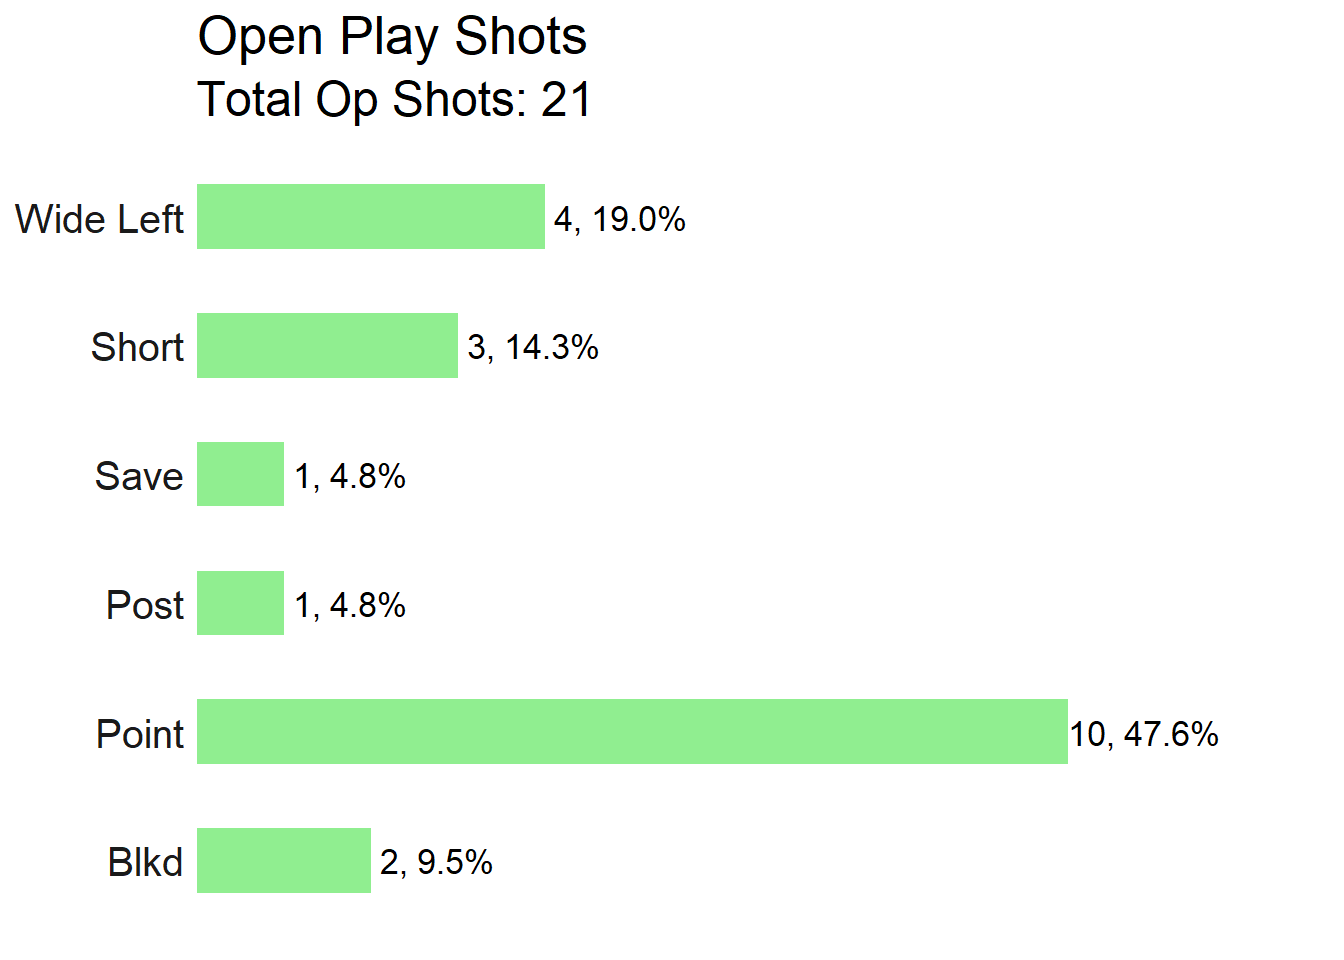
###Shot Efficiency - Ballyboden 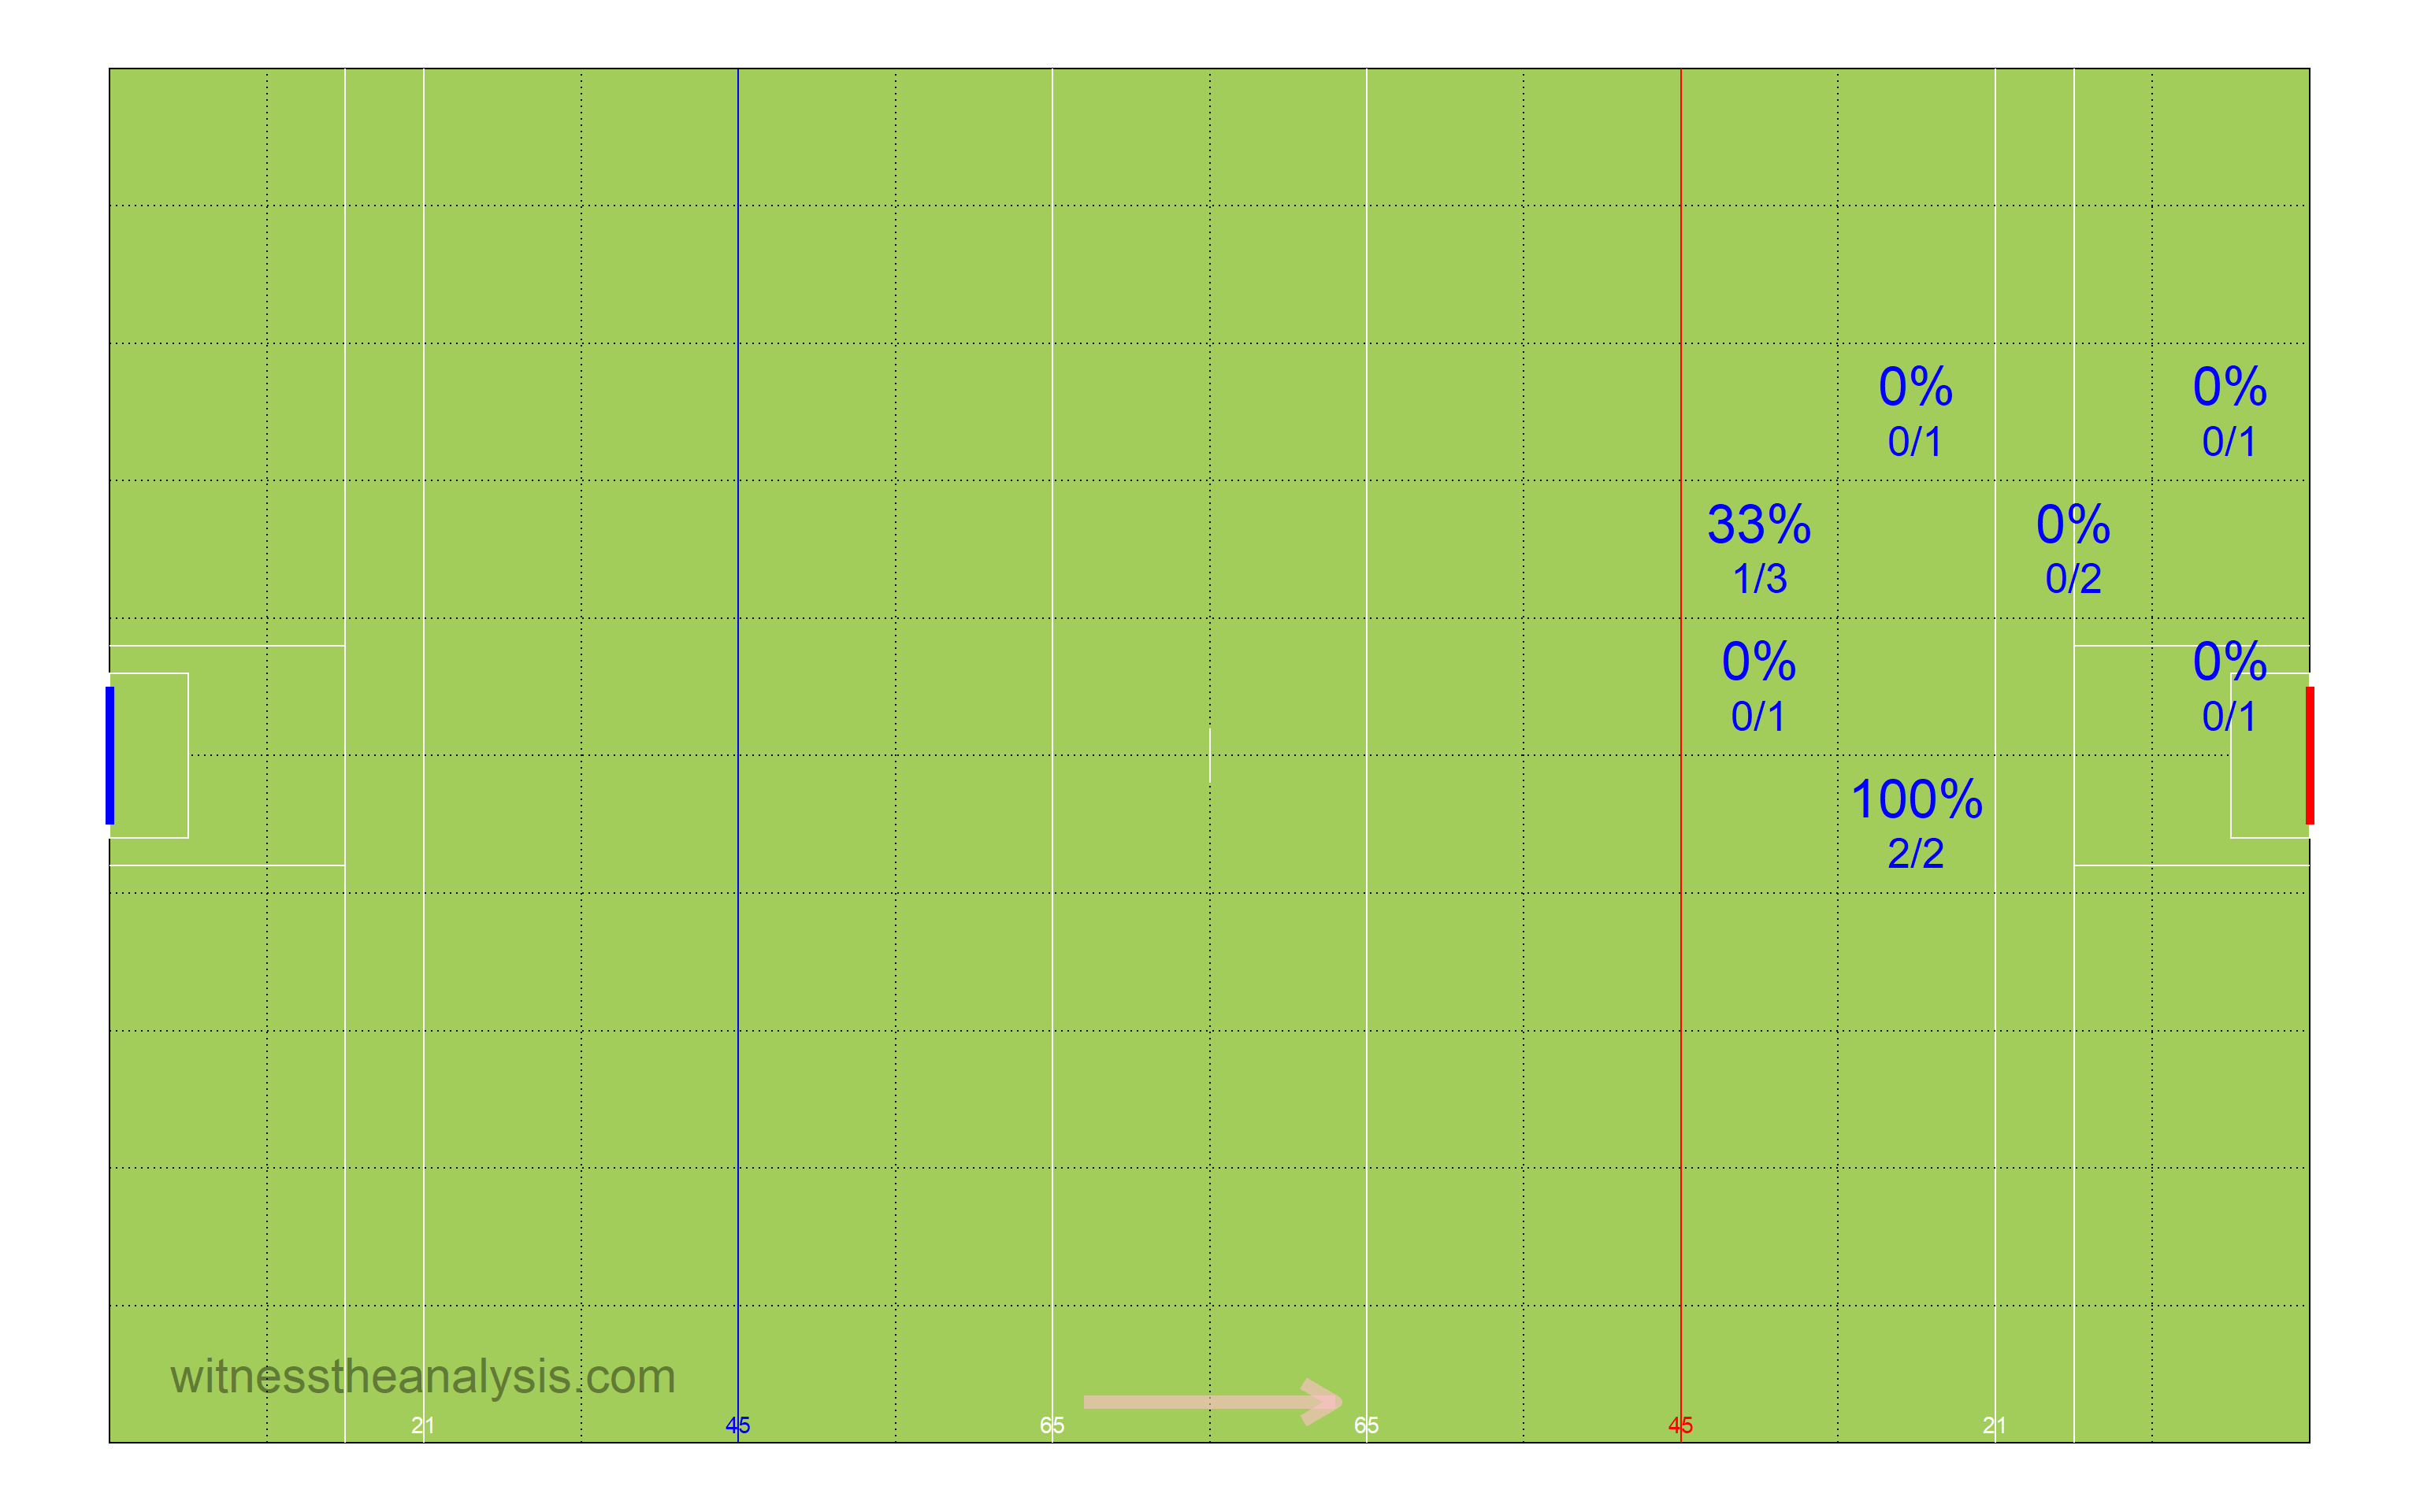
###Shot Density 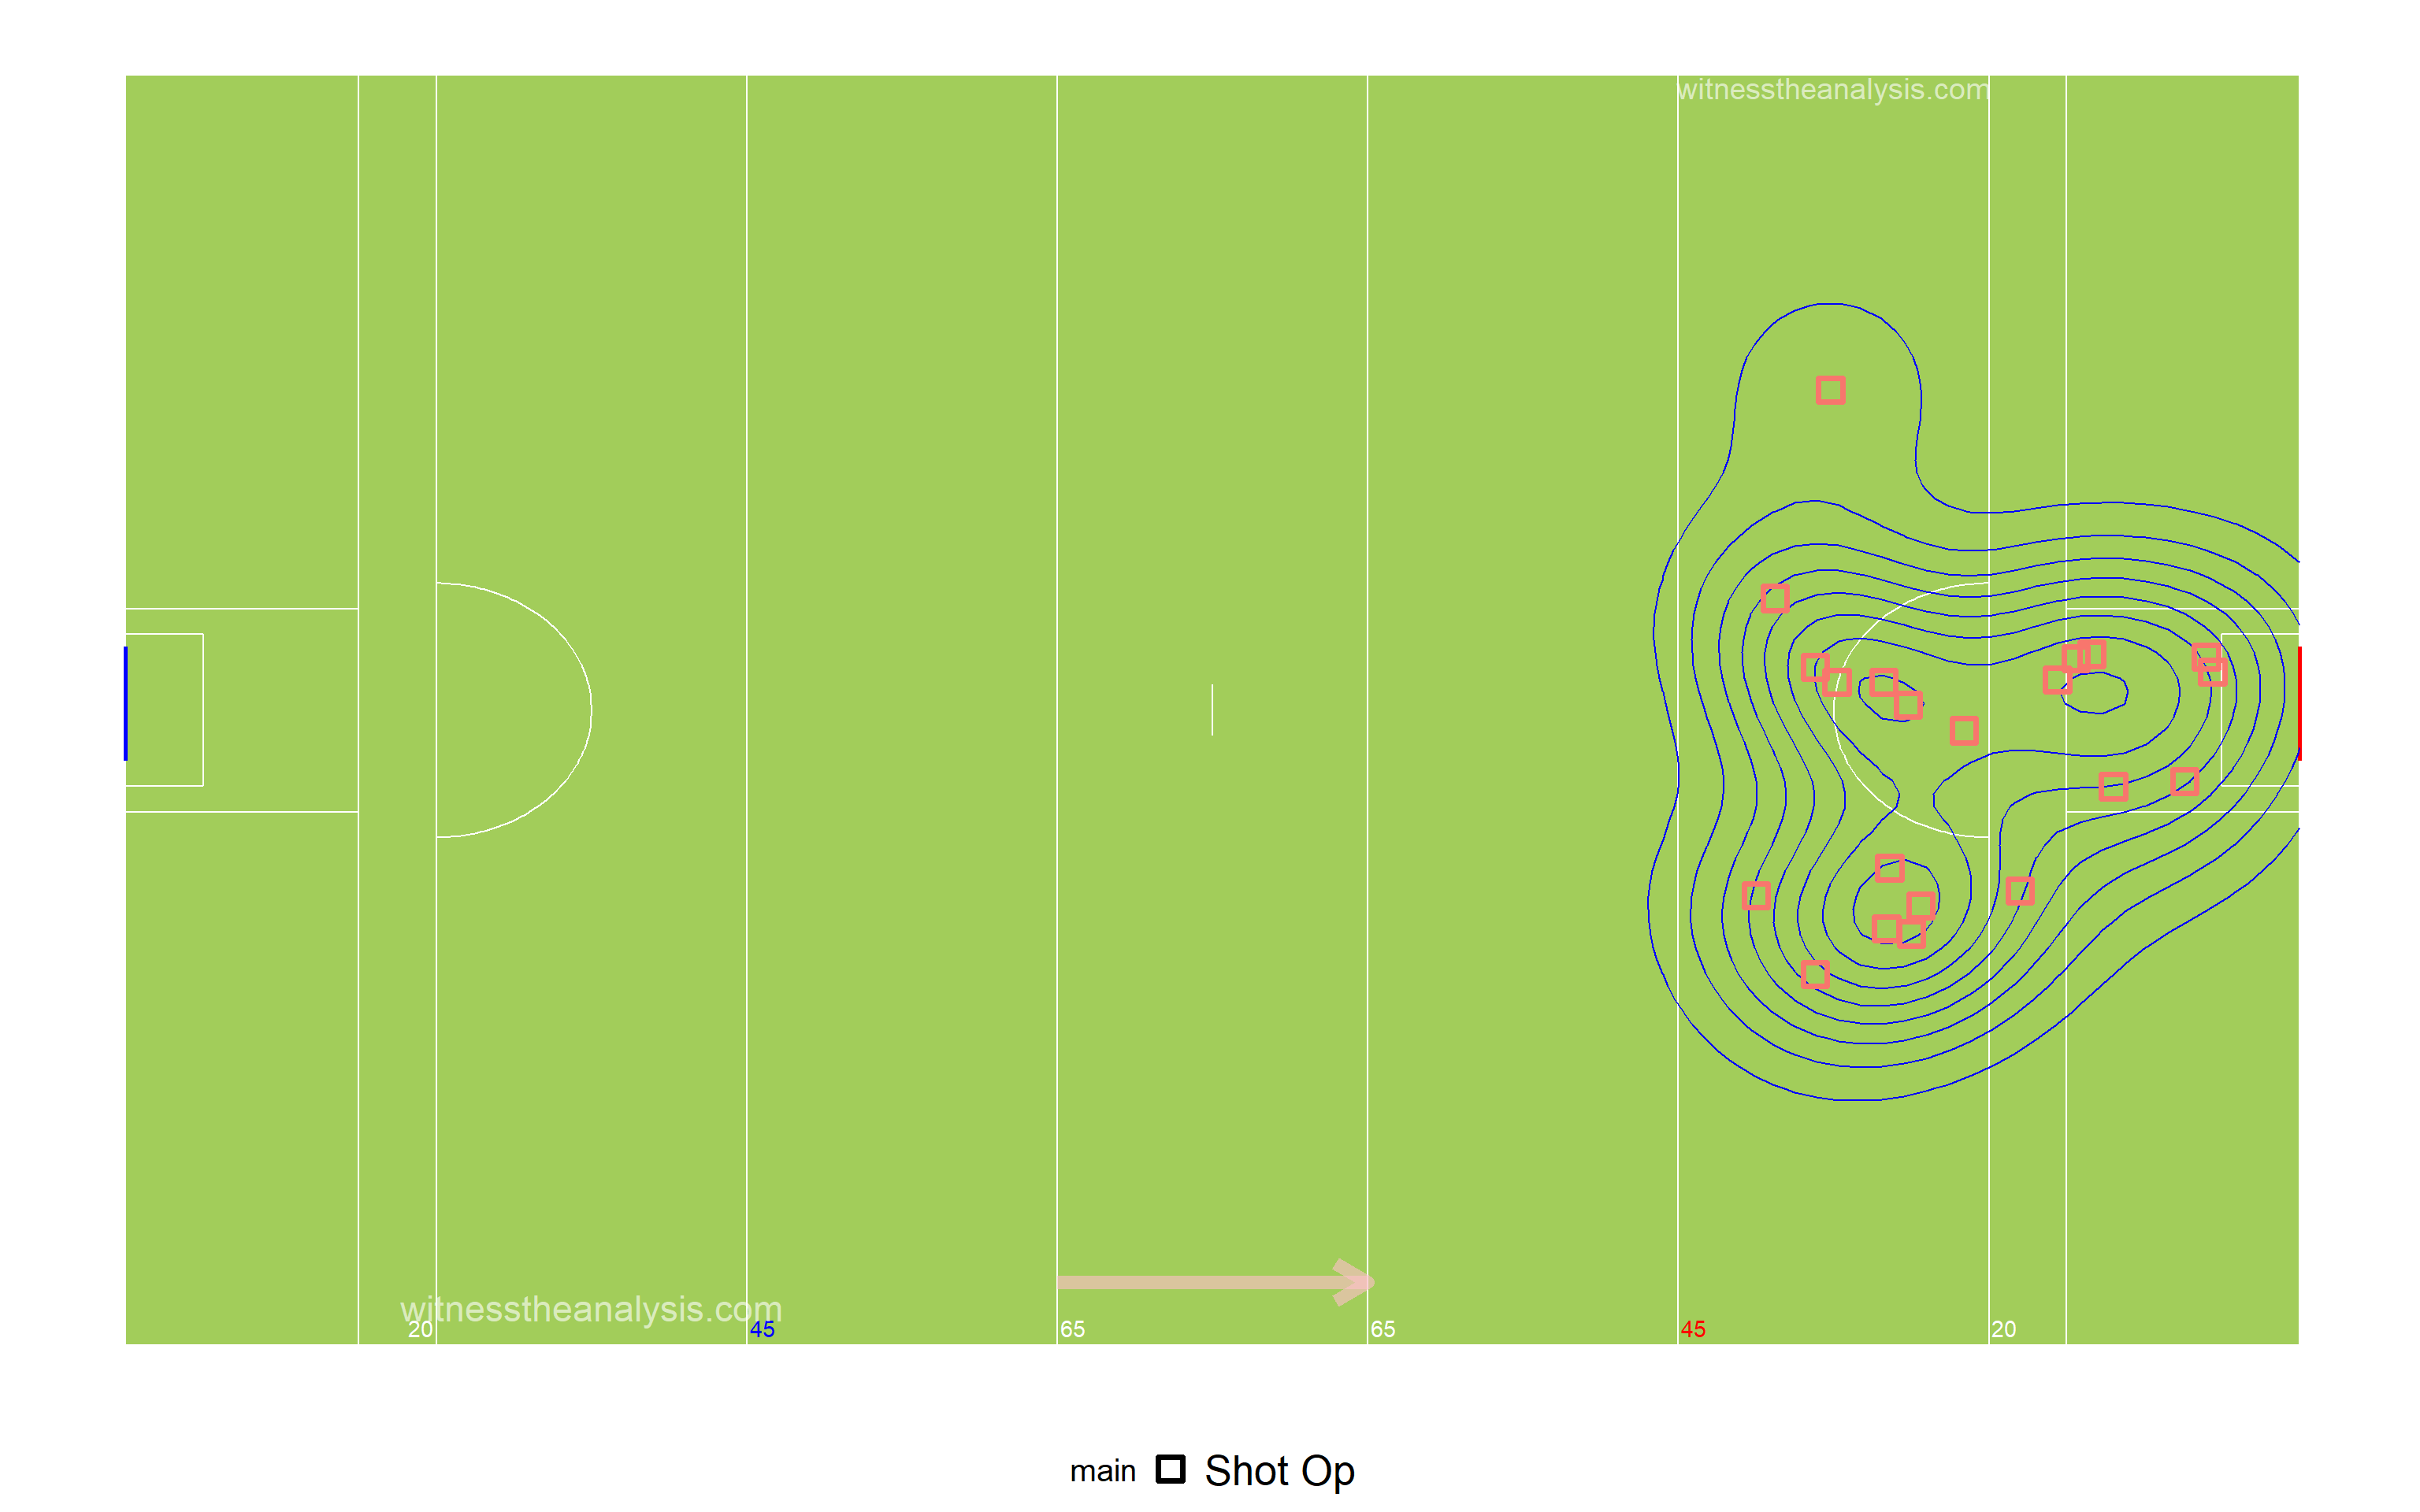
###Shot Pressure - Ballyboden
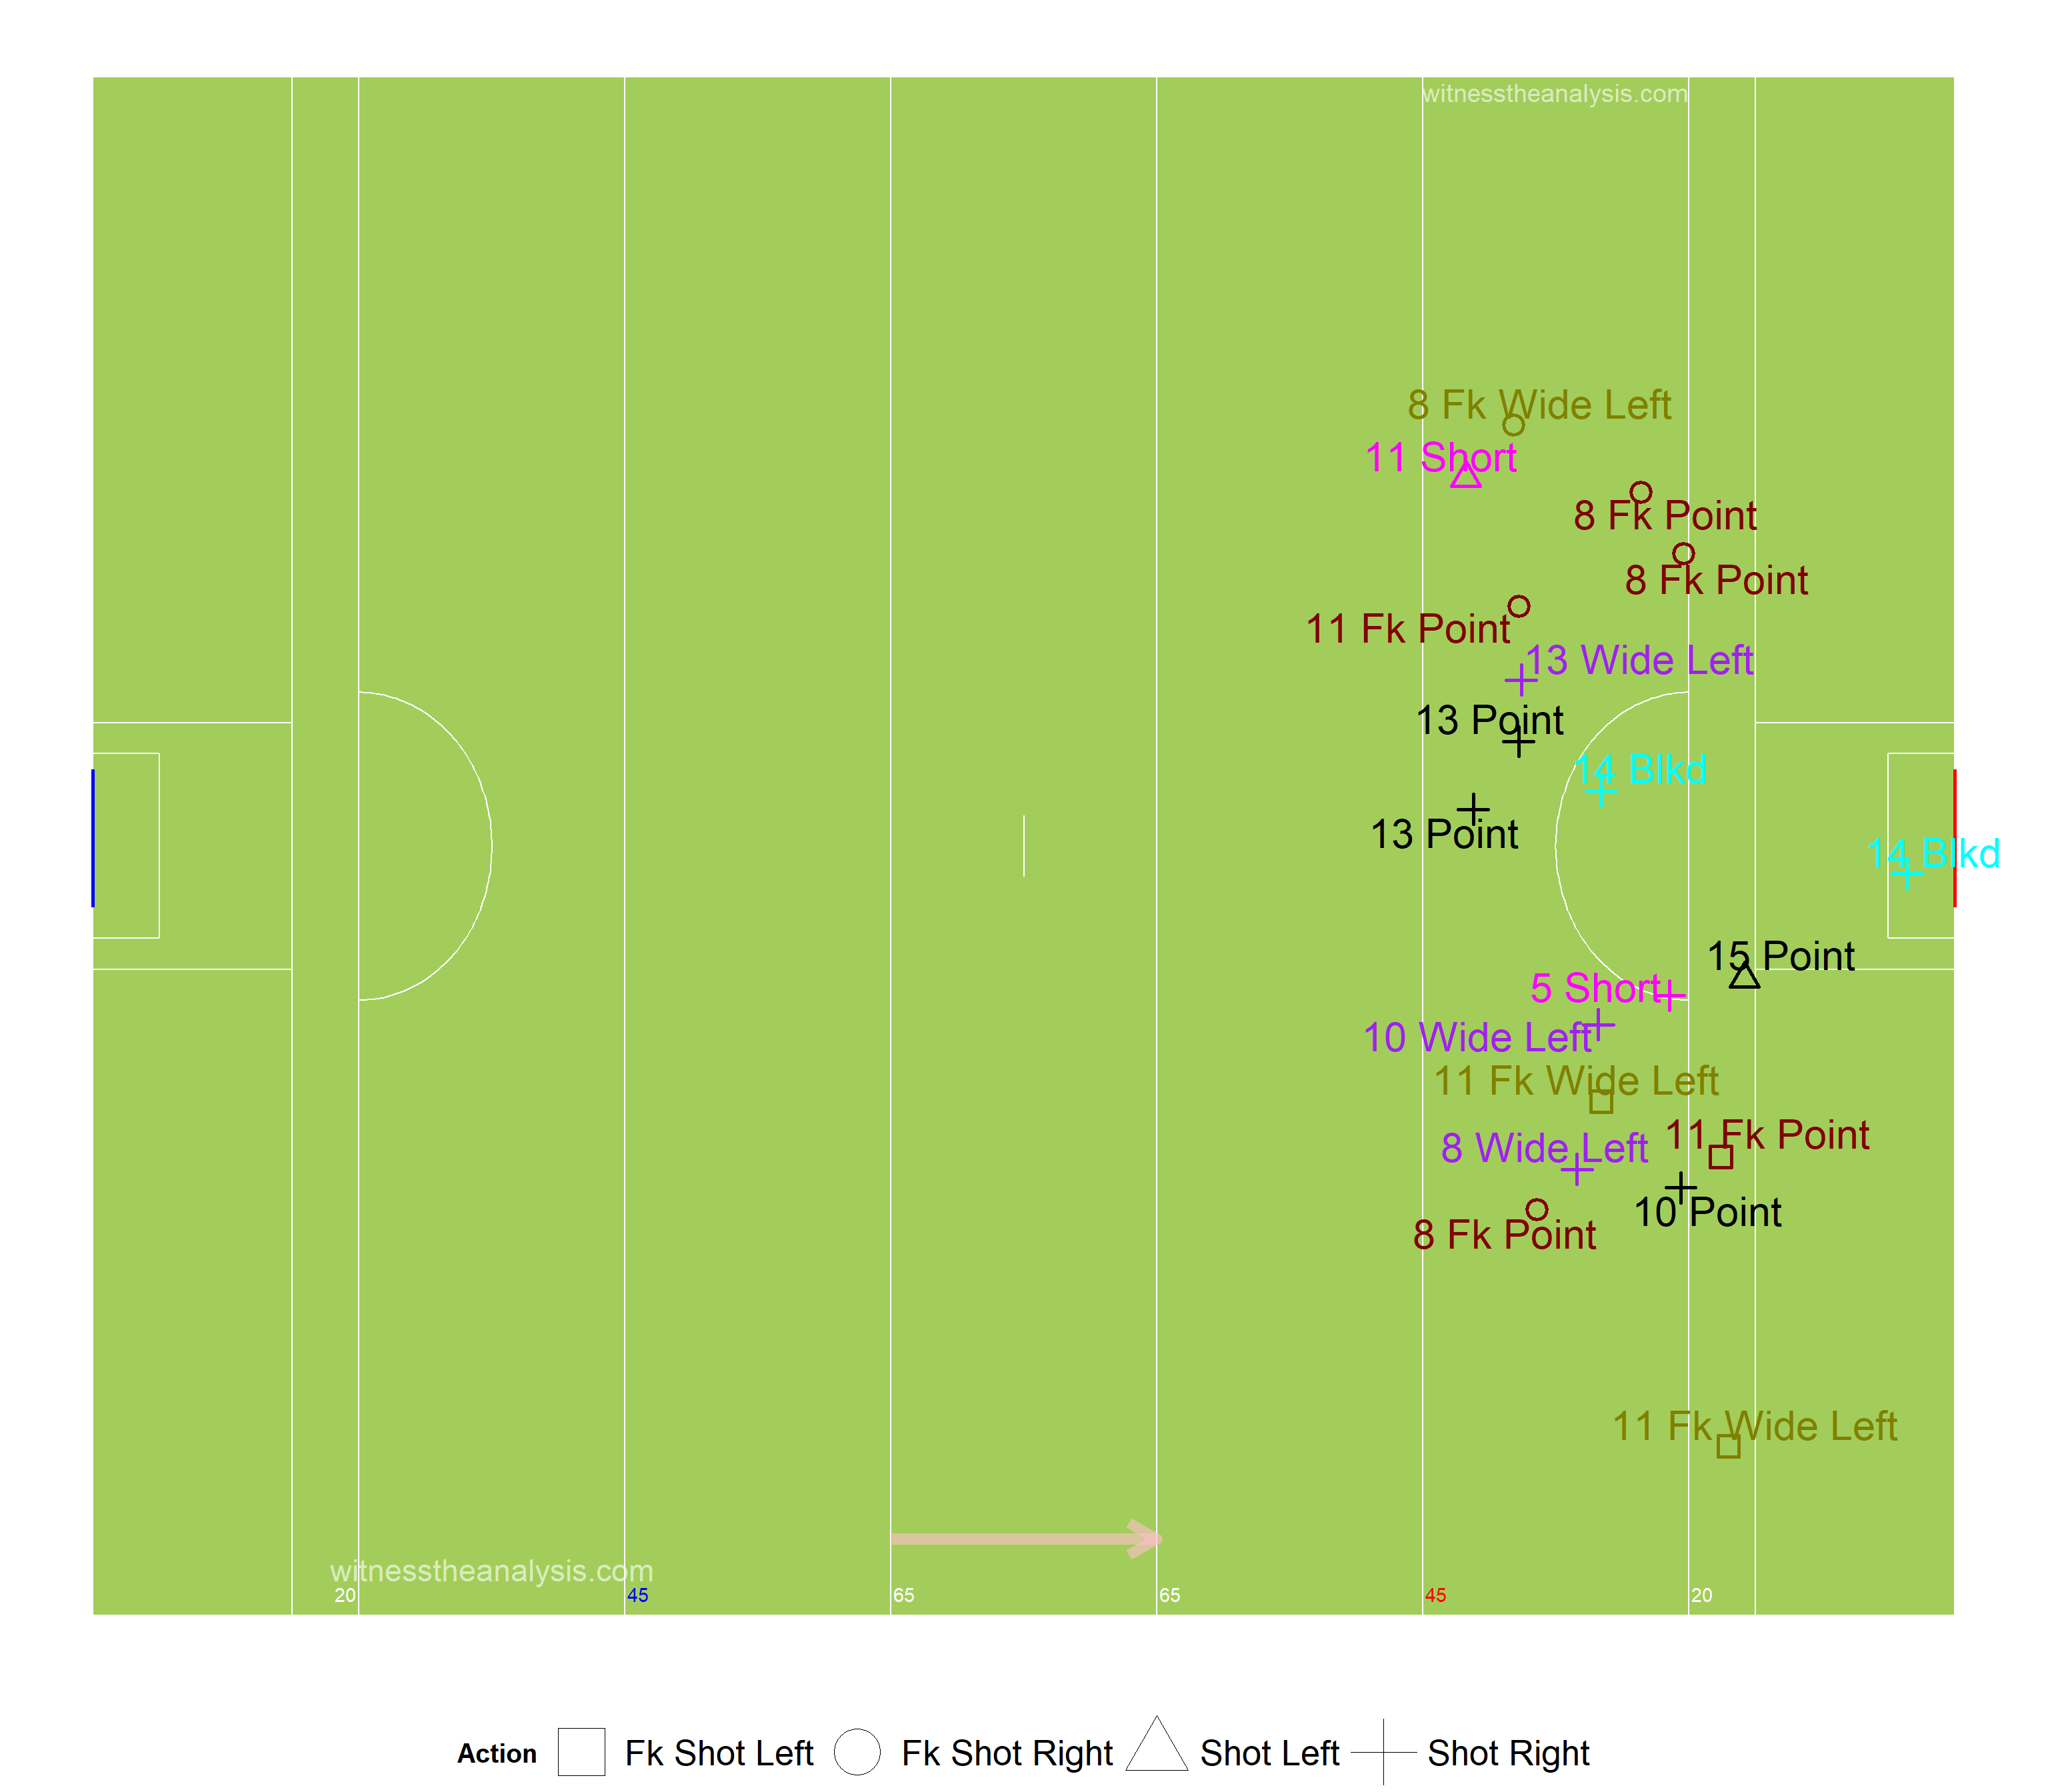
##All Shots - Location & Outcome ###Thomas Davis 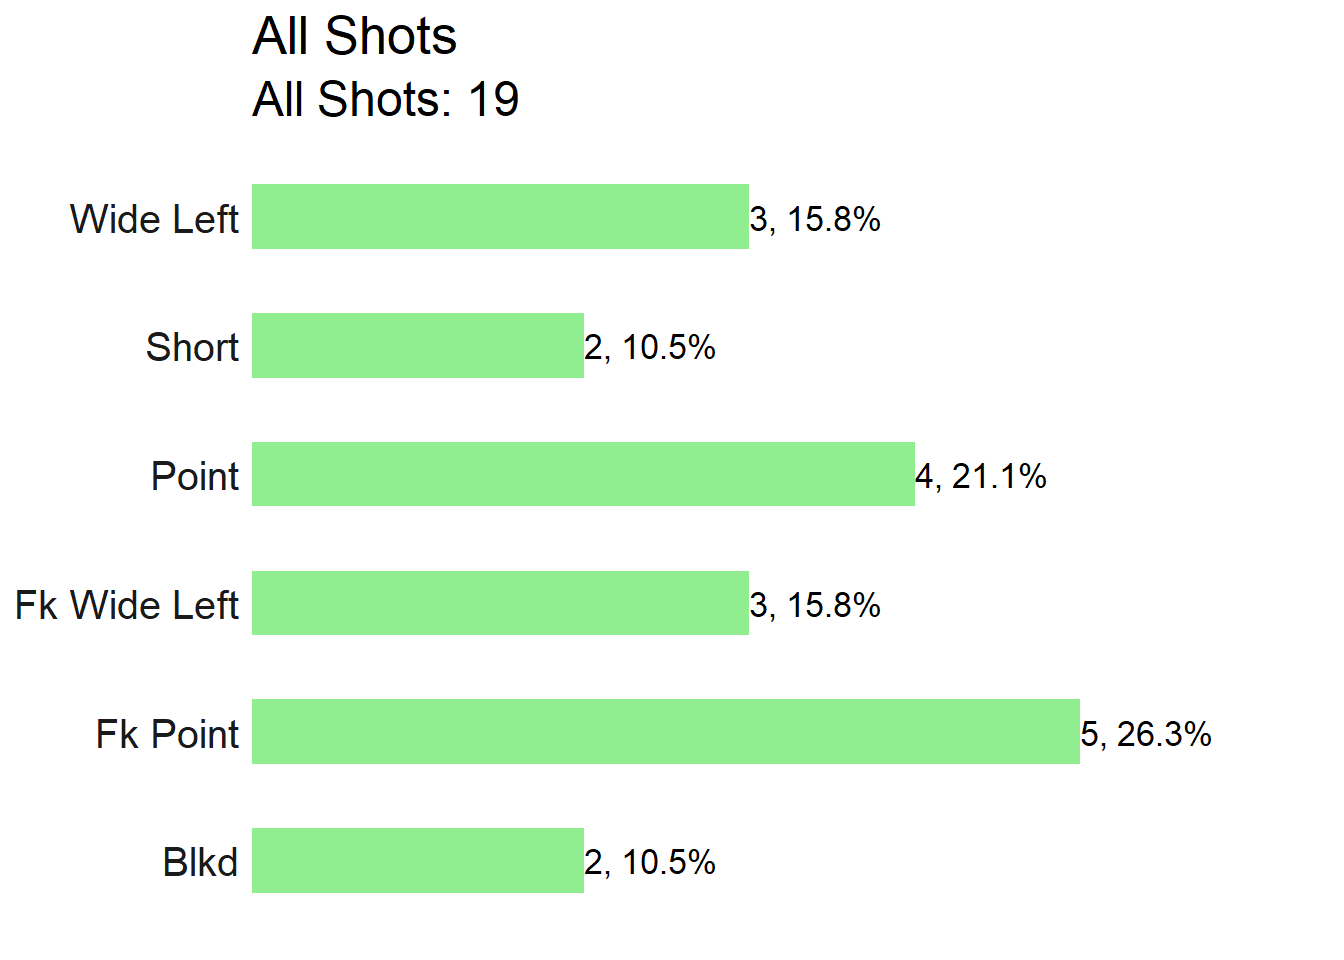
###All Shot Density 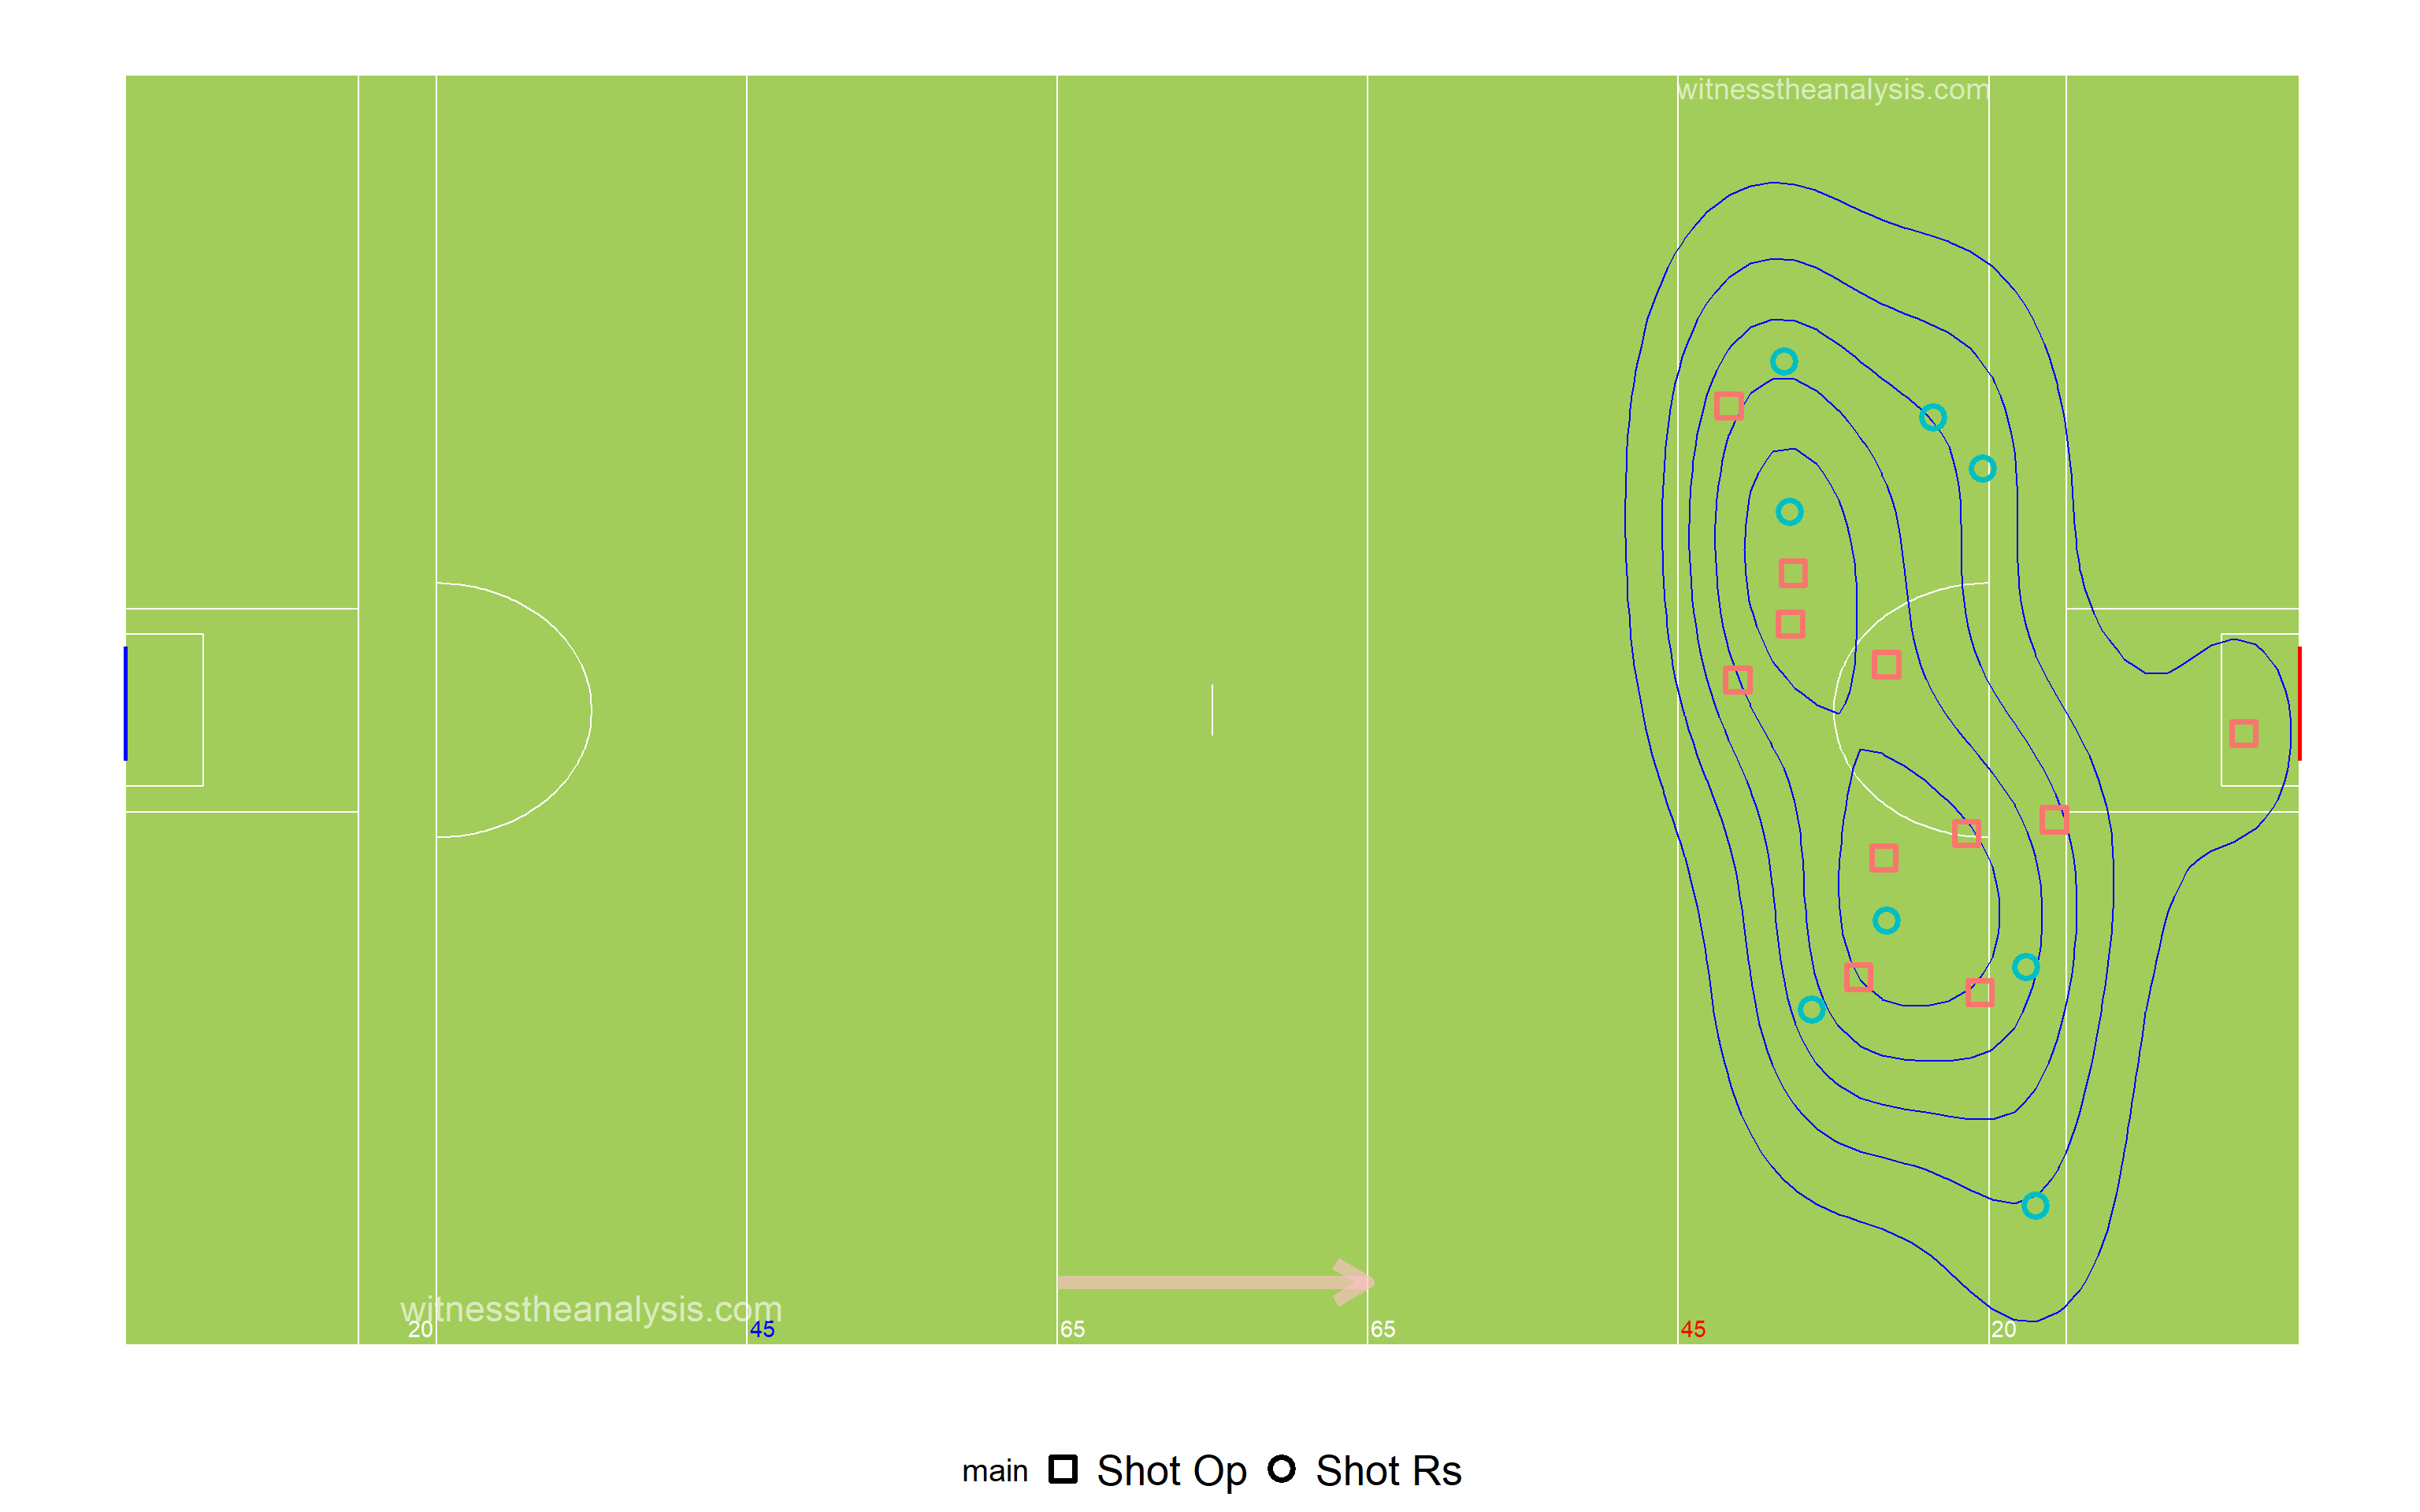
###Free Kick Shot Efficiency - Thomas Davis 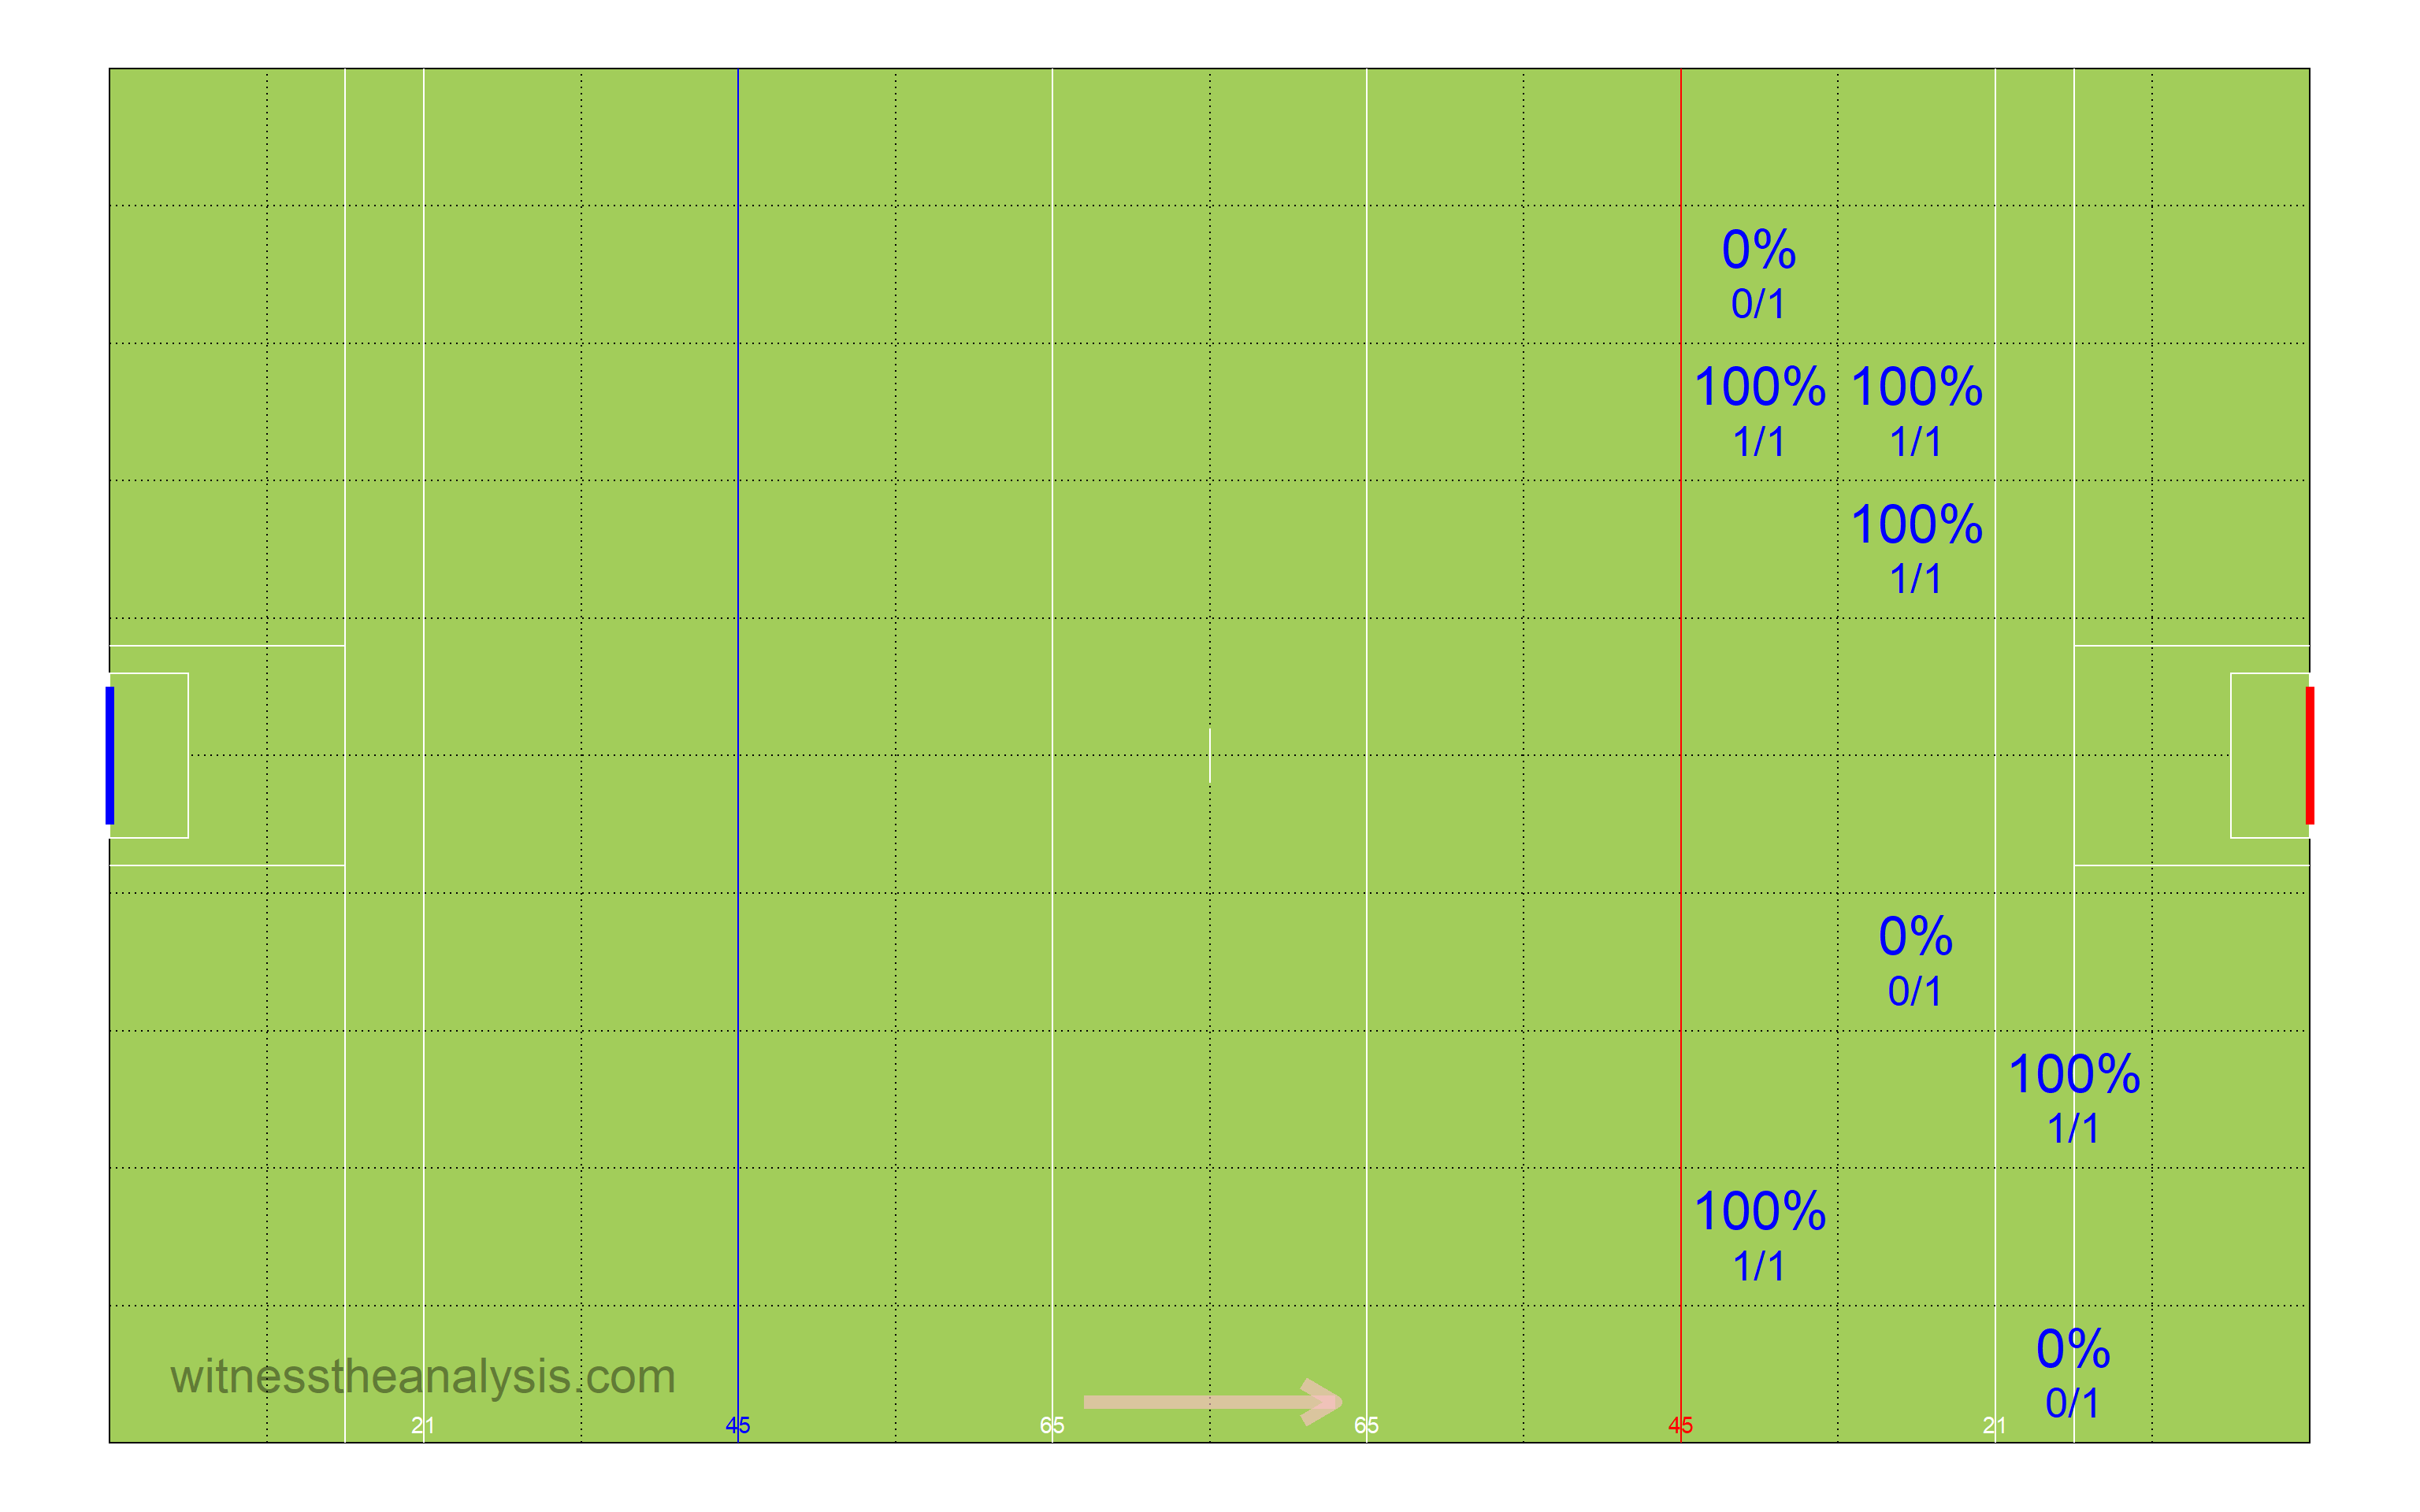
###Ballyboden 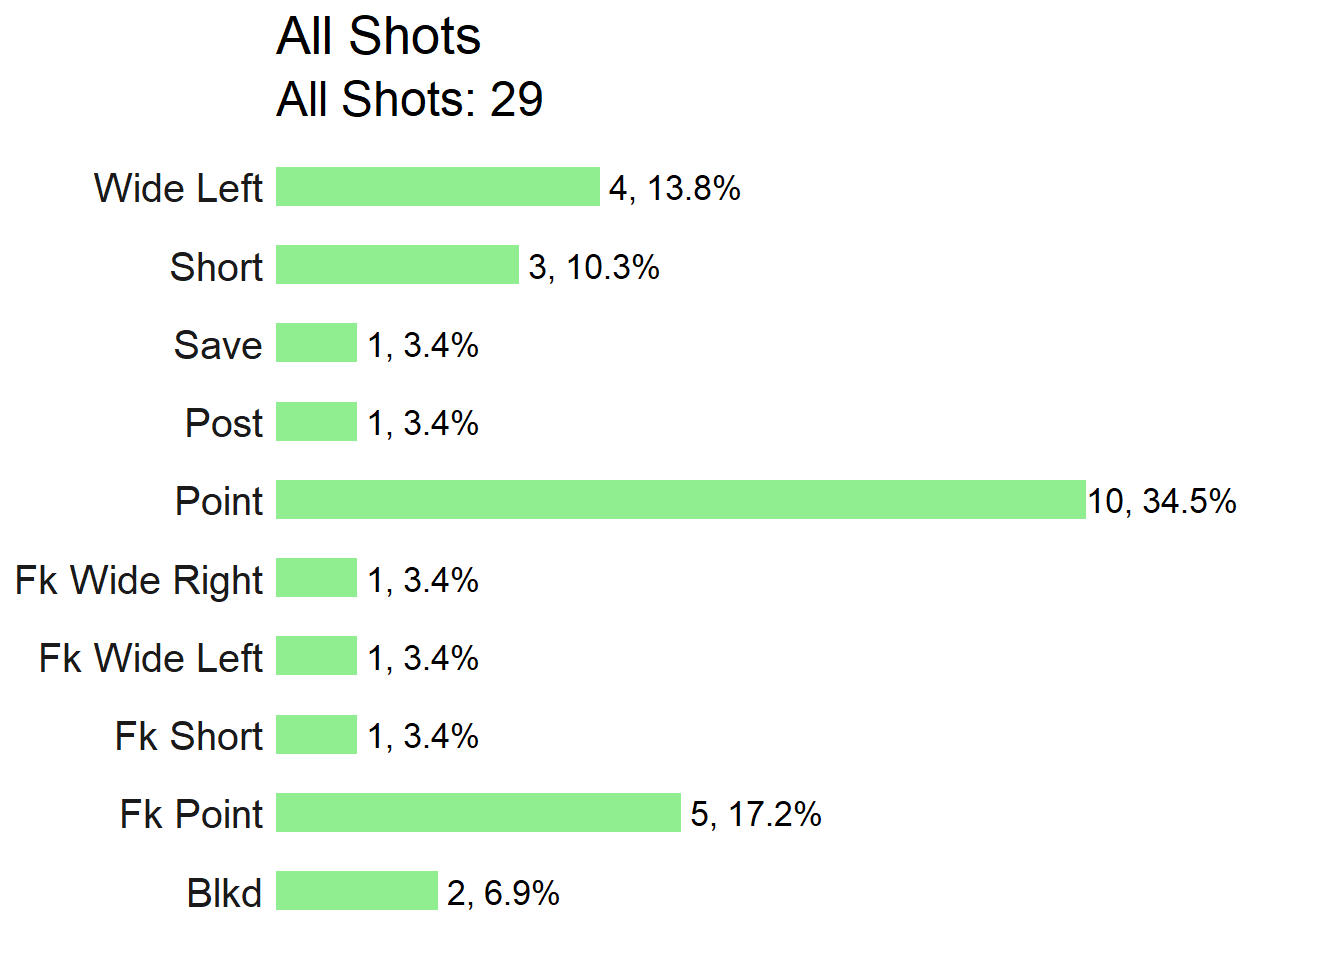
###All Shot Density 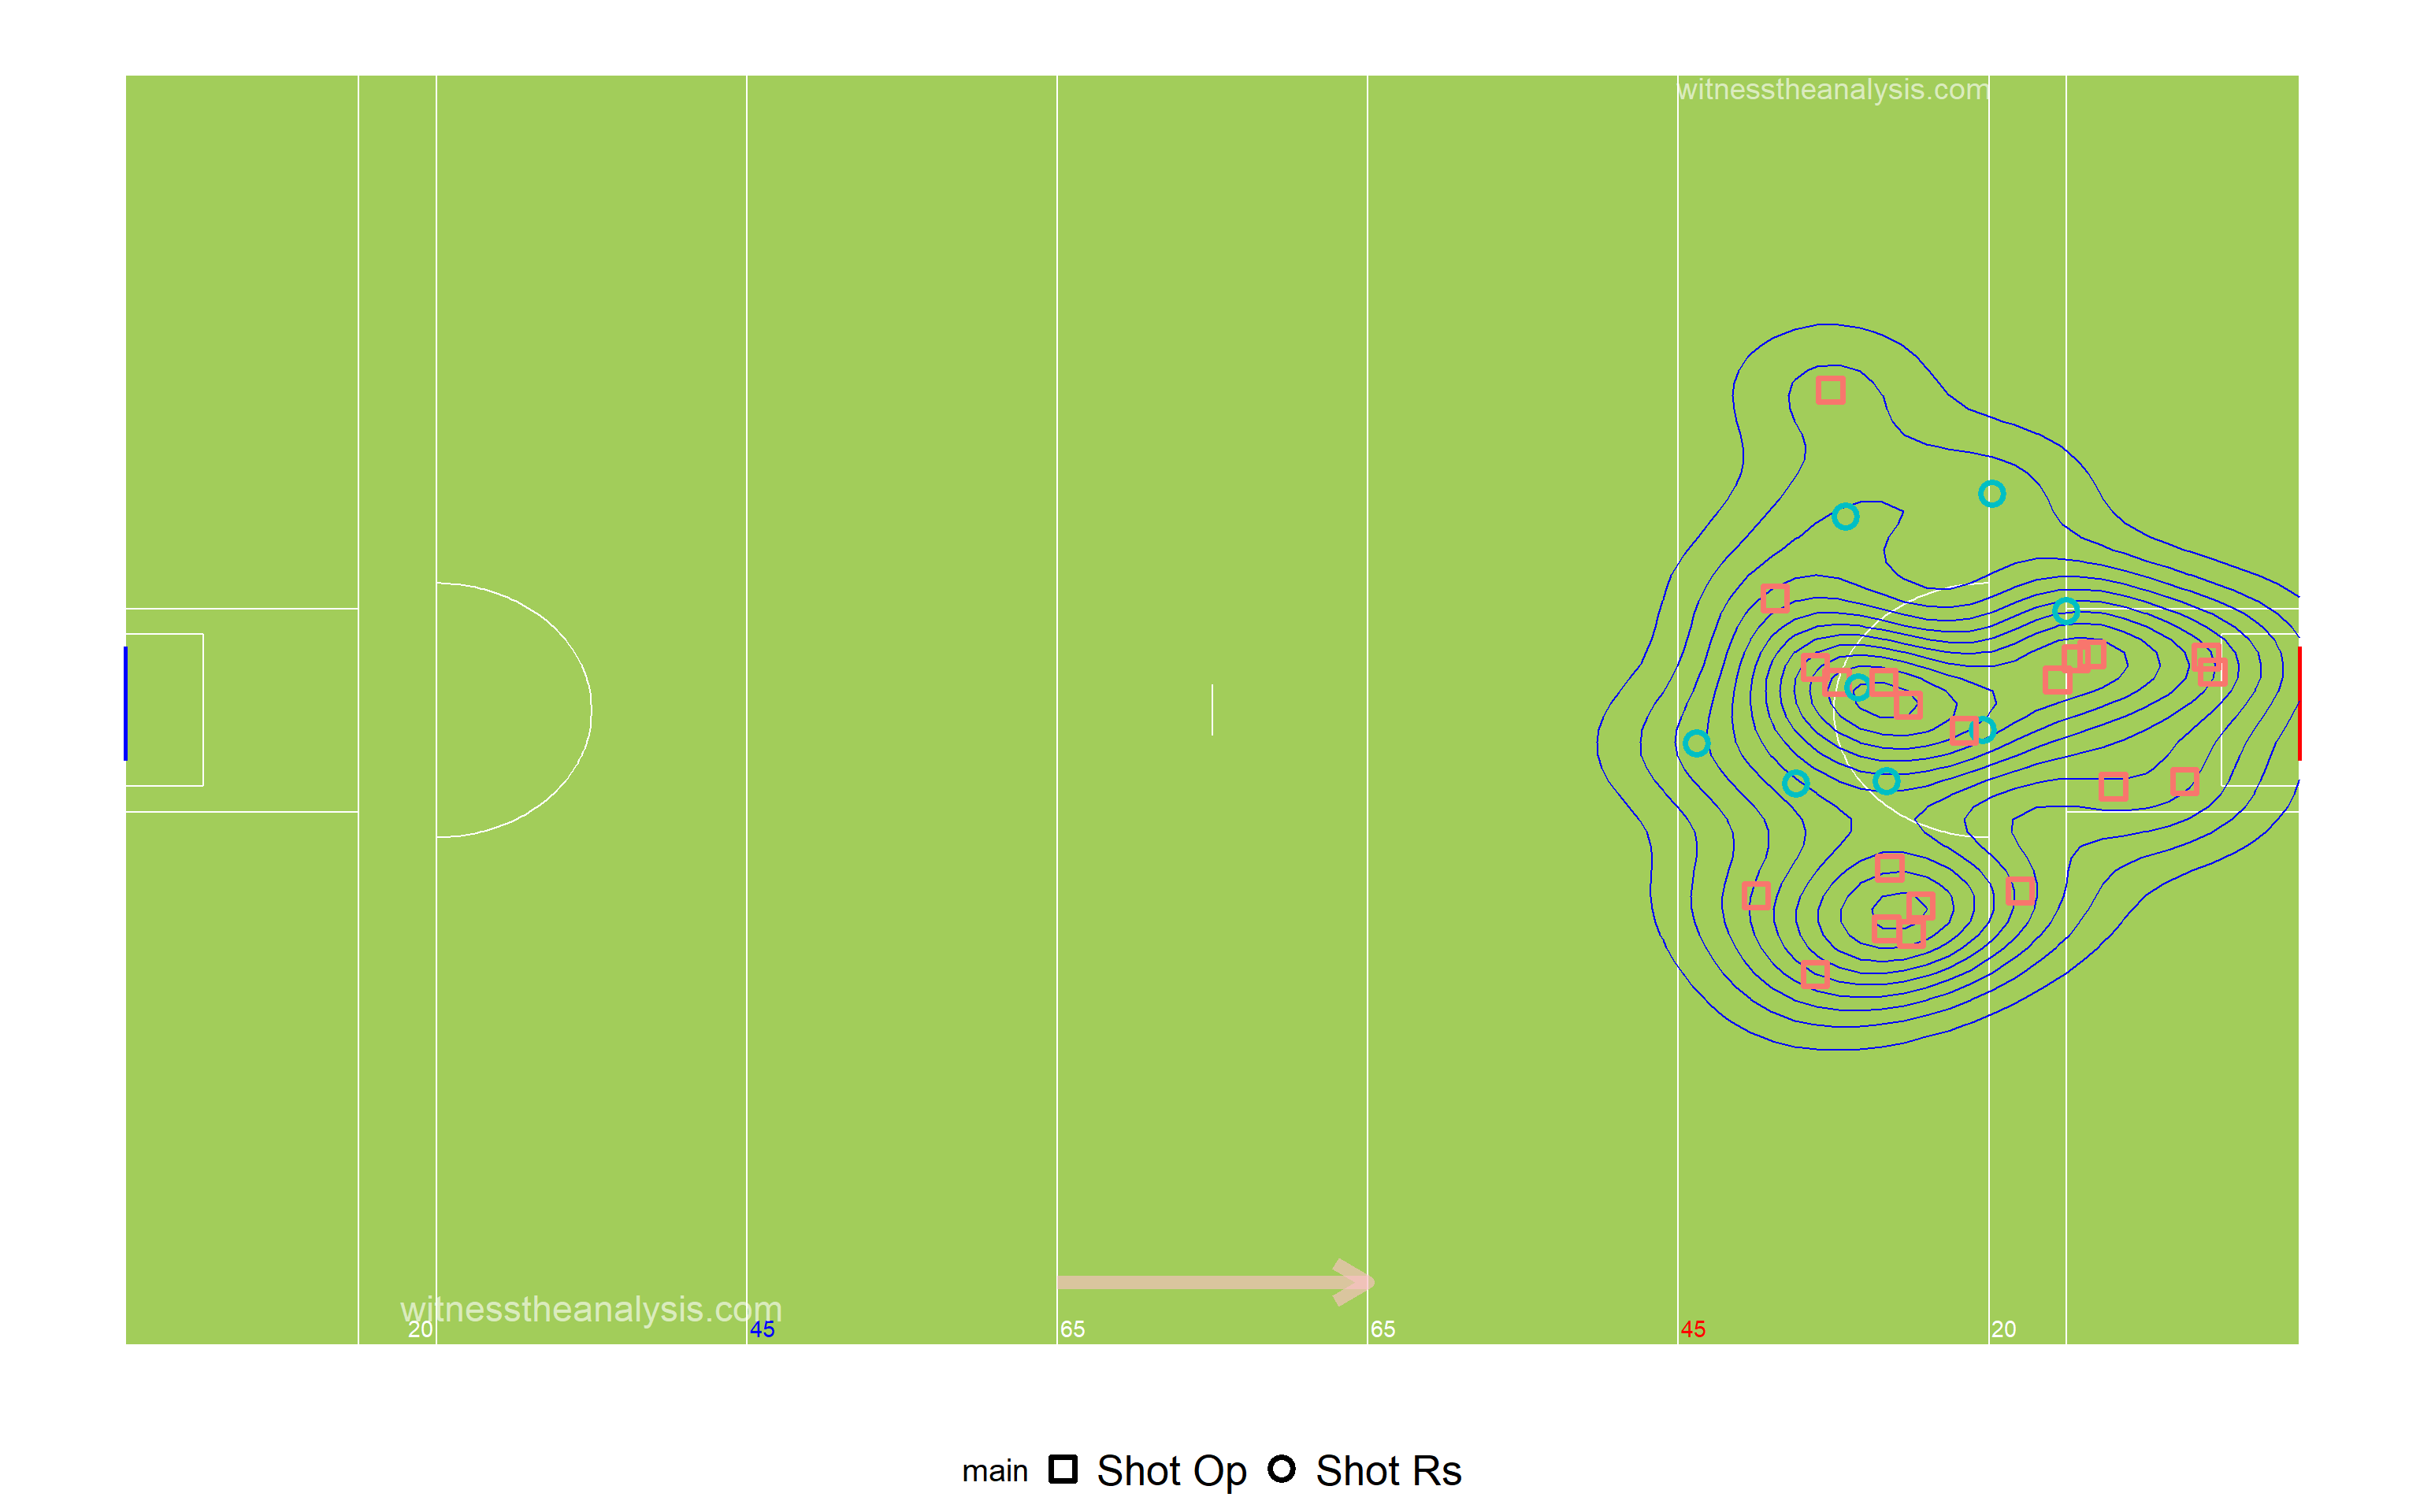
###Free Kick Shot Efficiency - Ballyboden 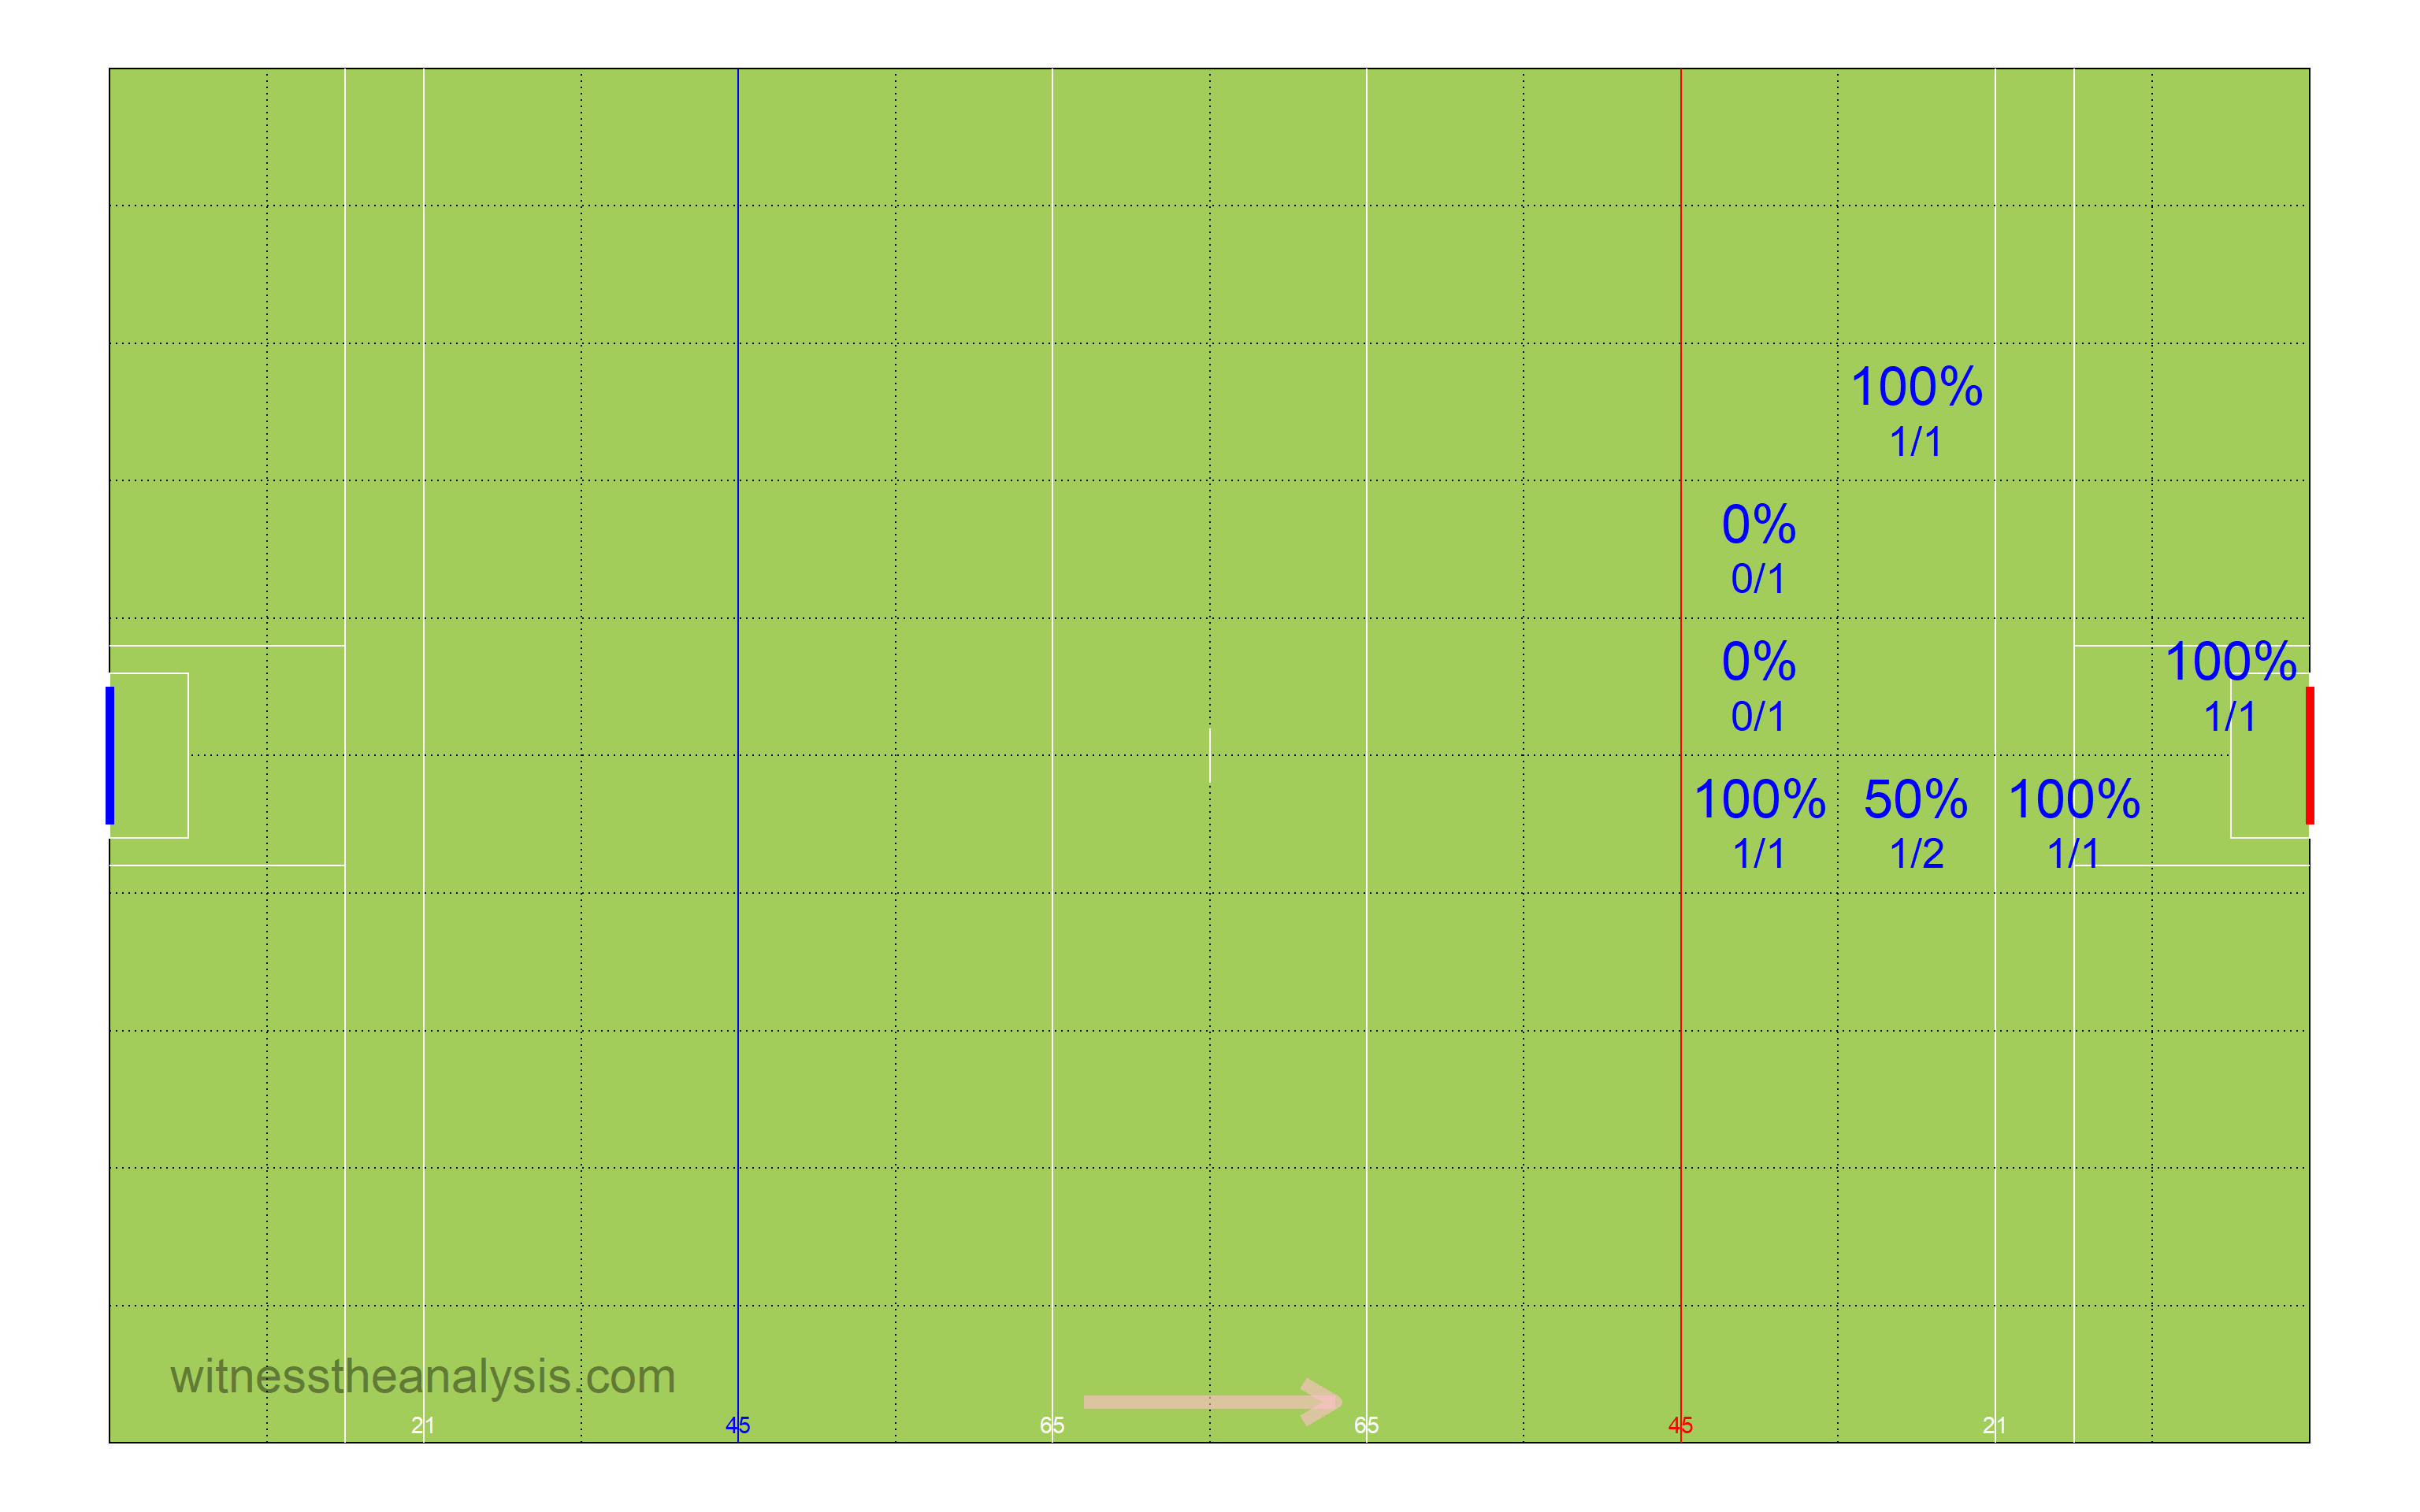
##All Shots Origin by Possession ###Thomas Davis (Blue = Score) 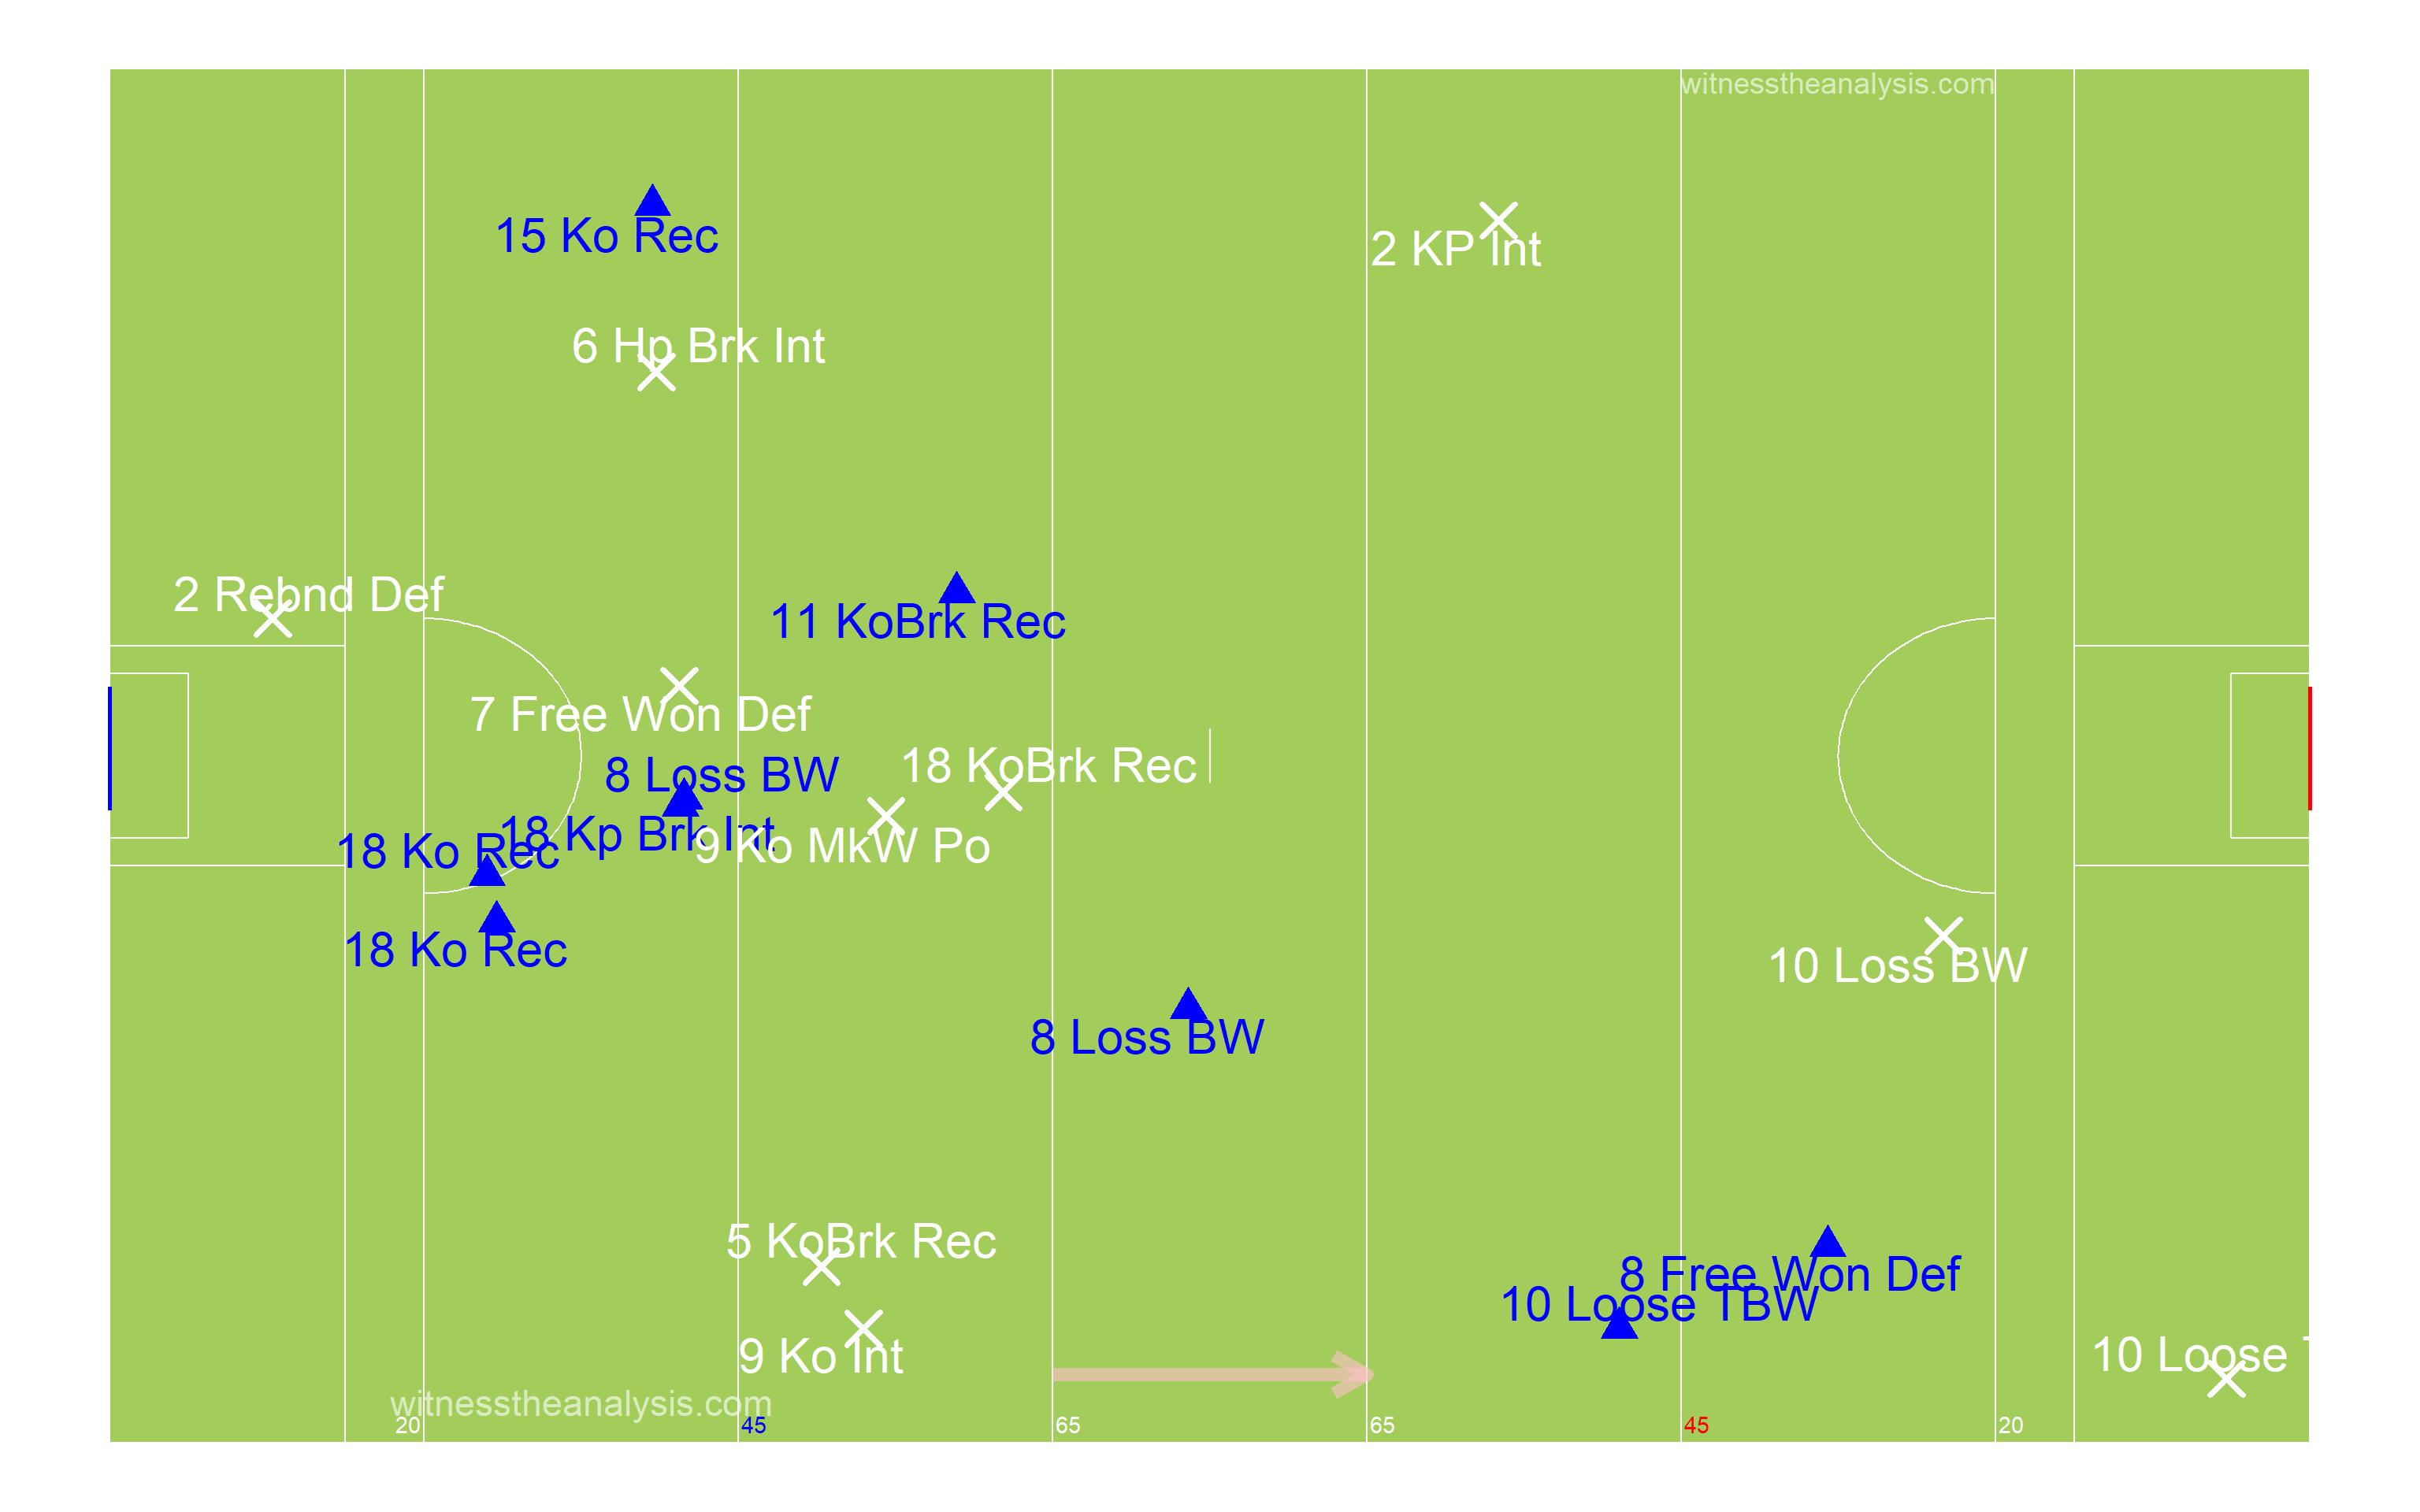
###Ballyboden (Blue = Score) 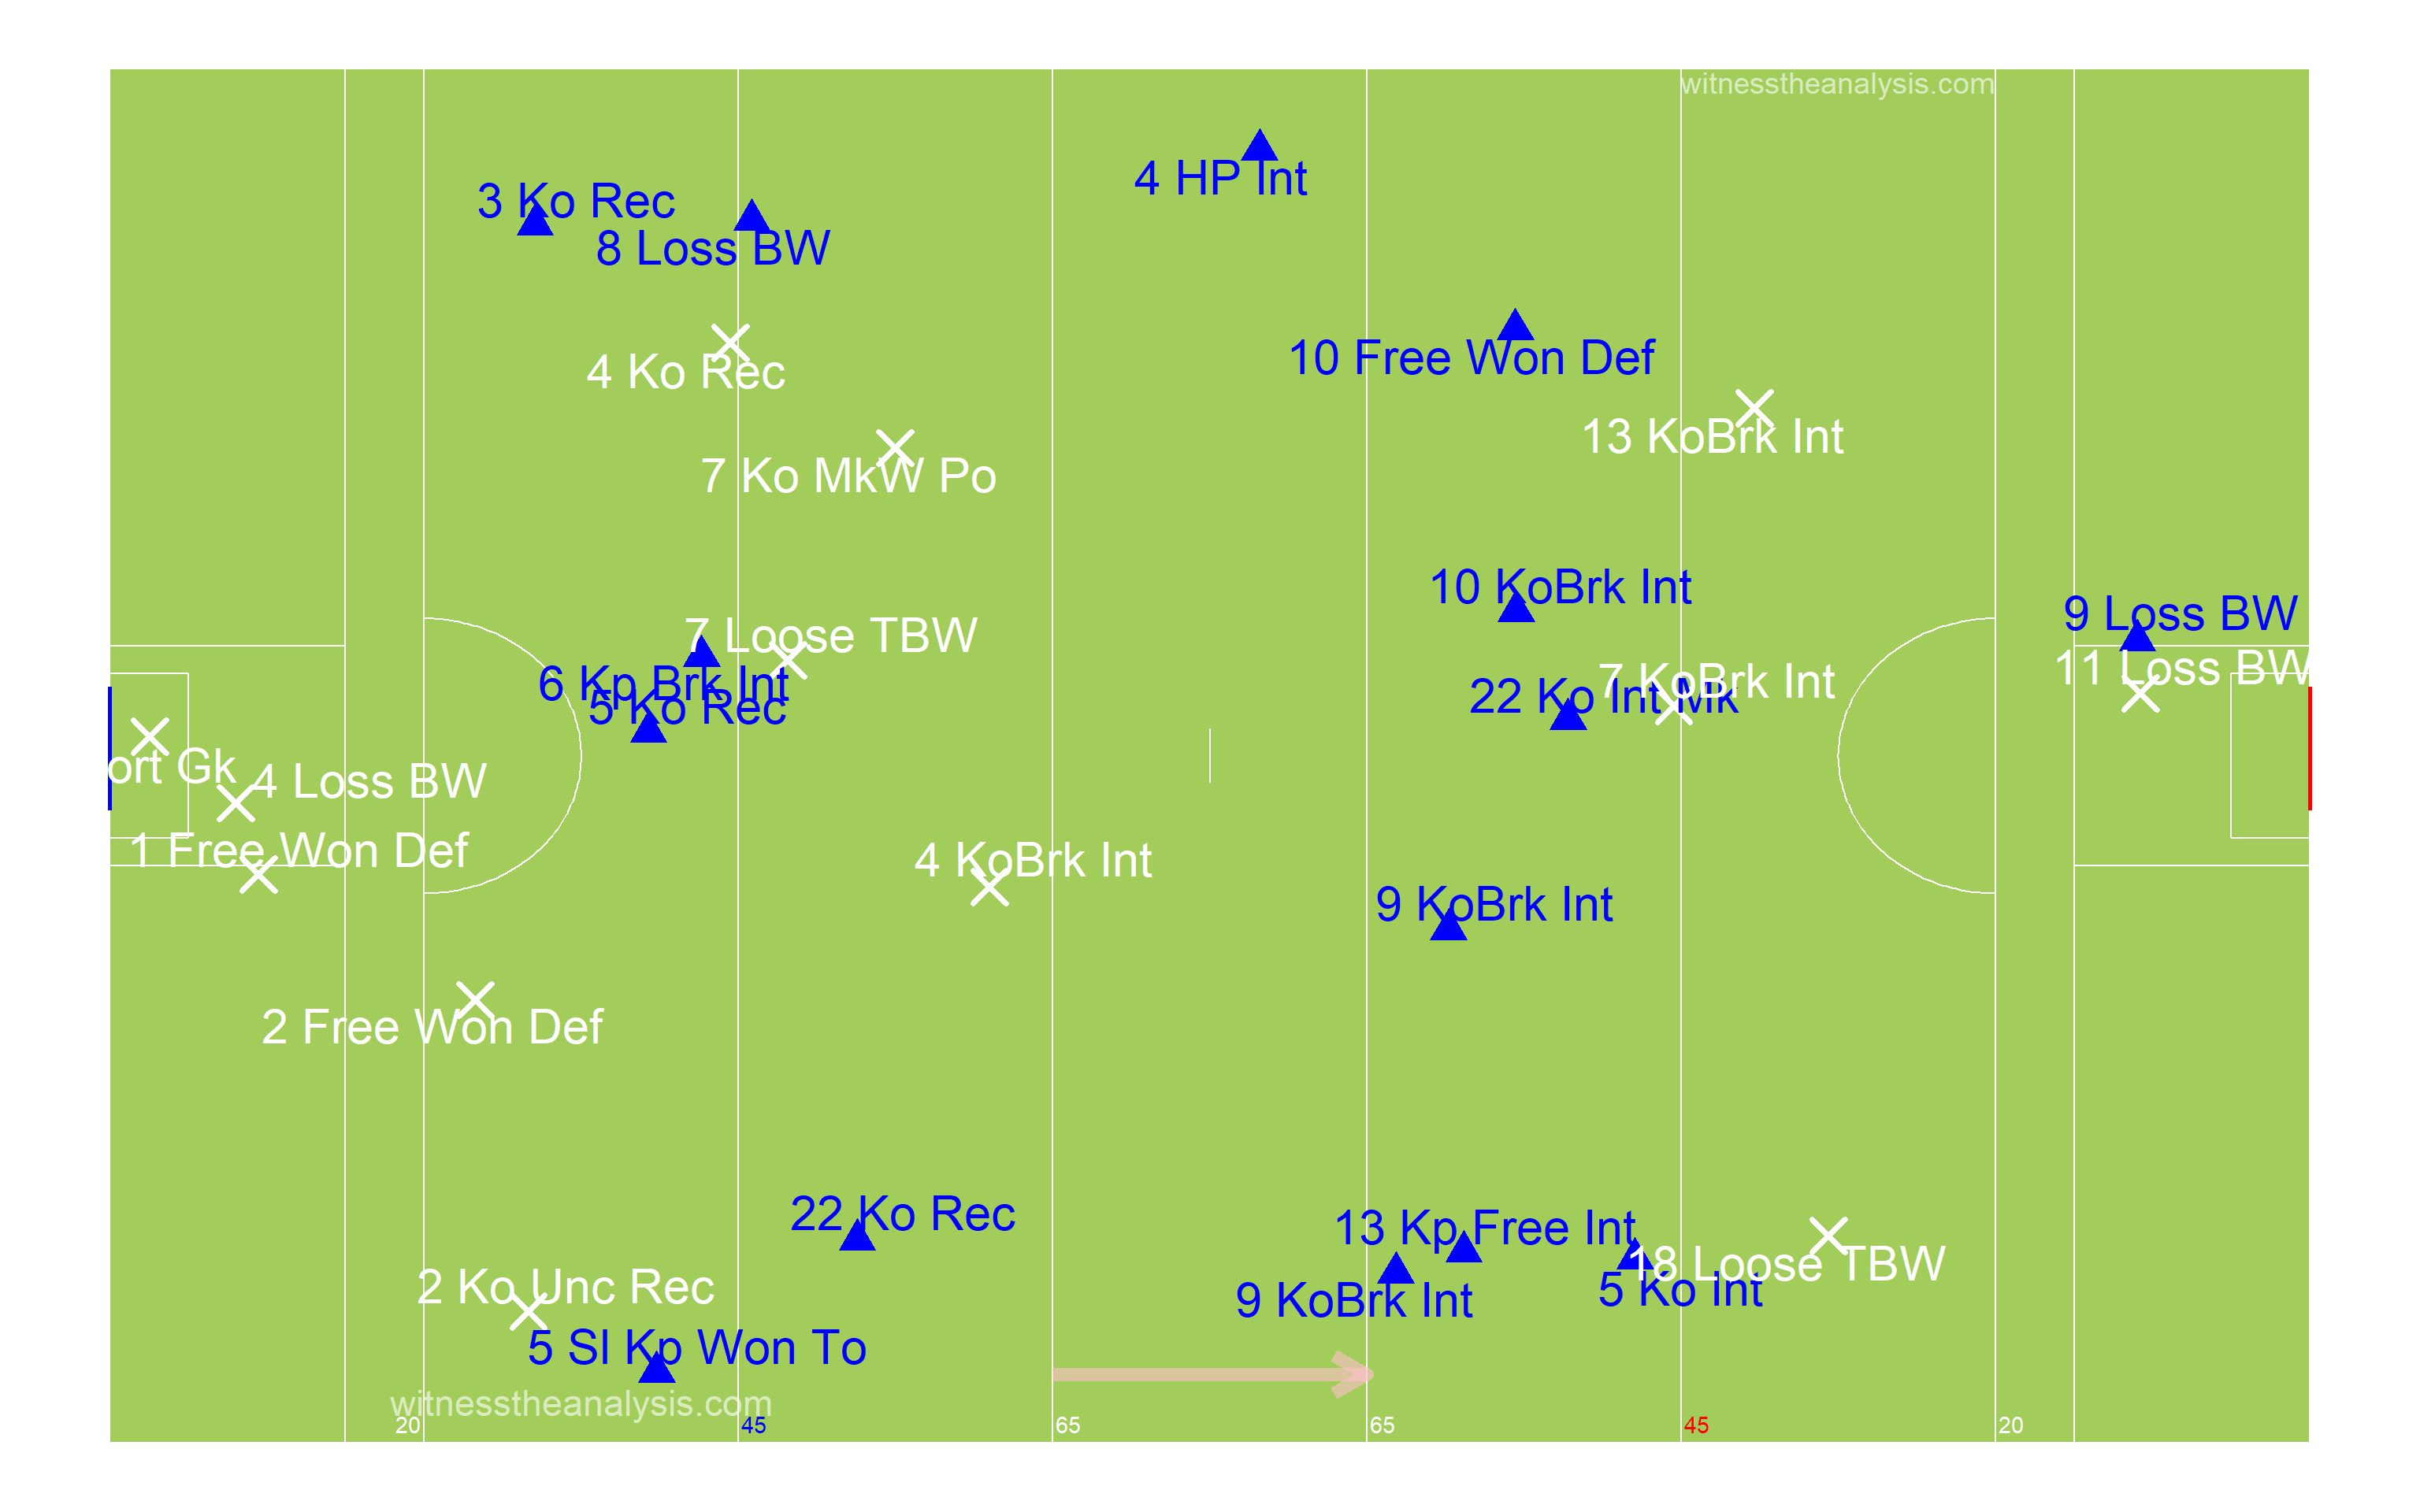
##Open Play Shot Origin by Phase ###Thomas Davis (Blue = Score) 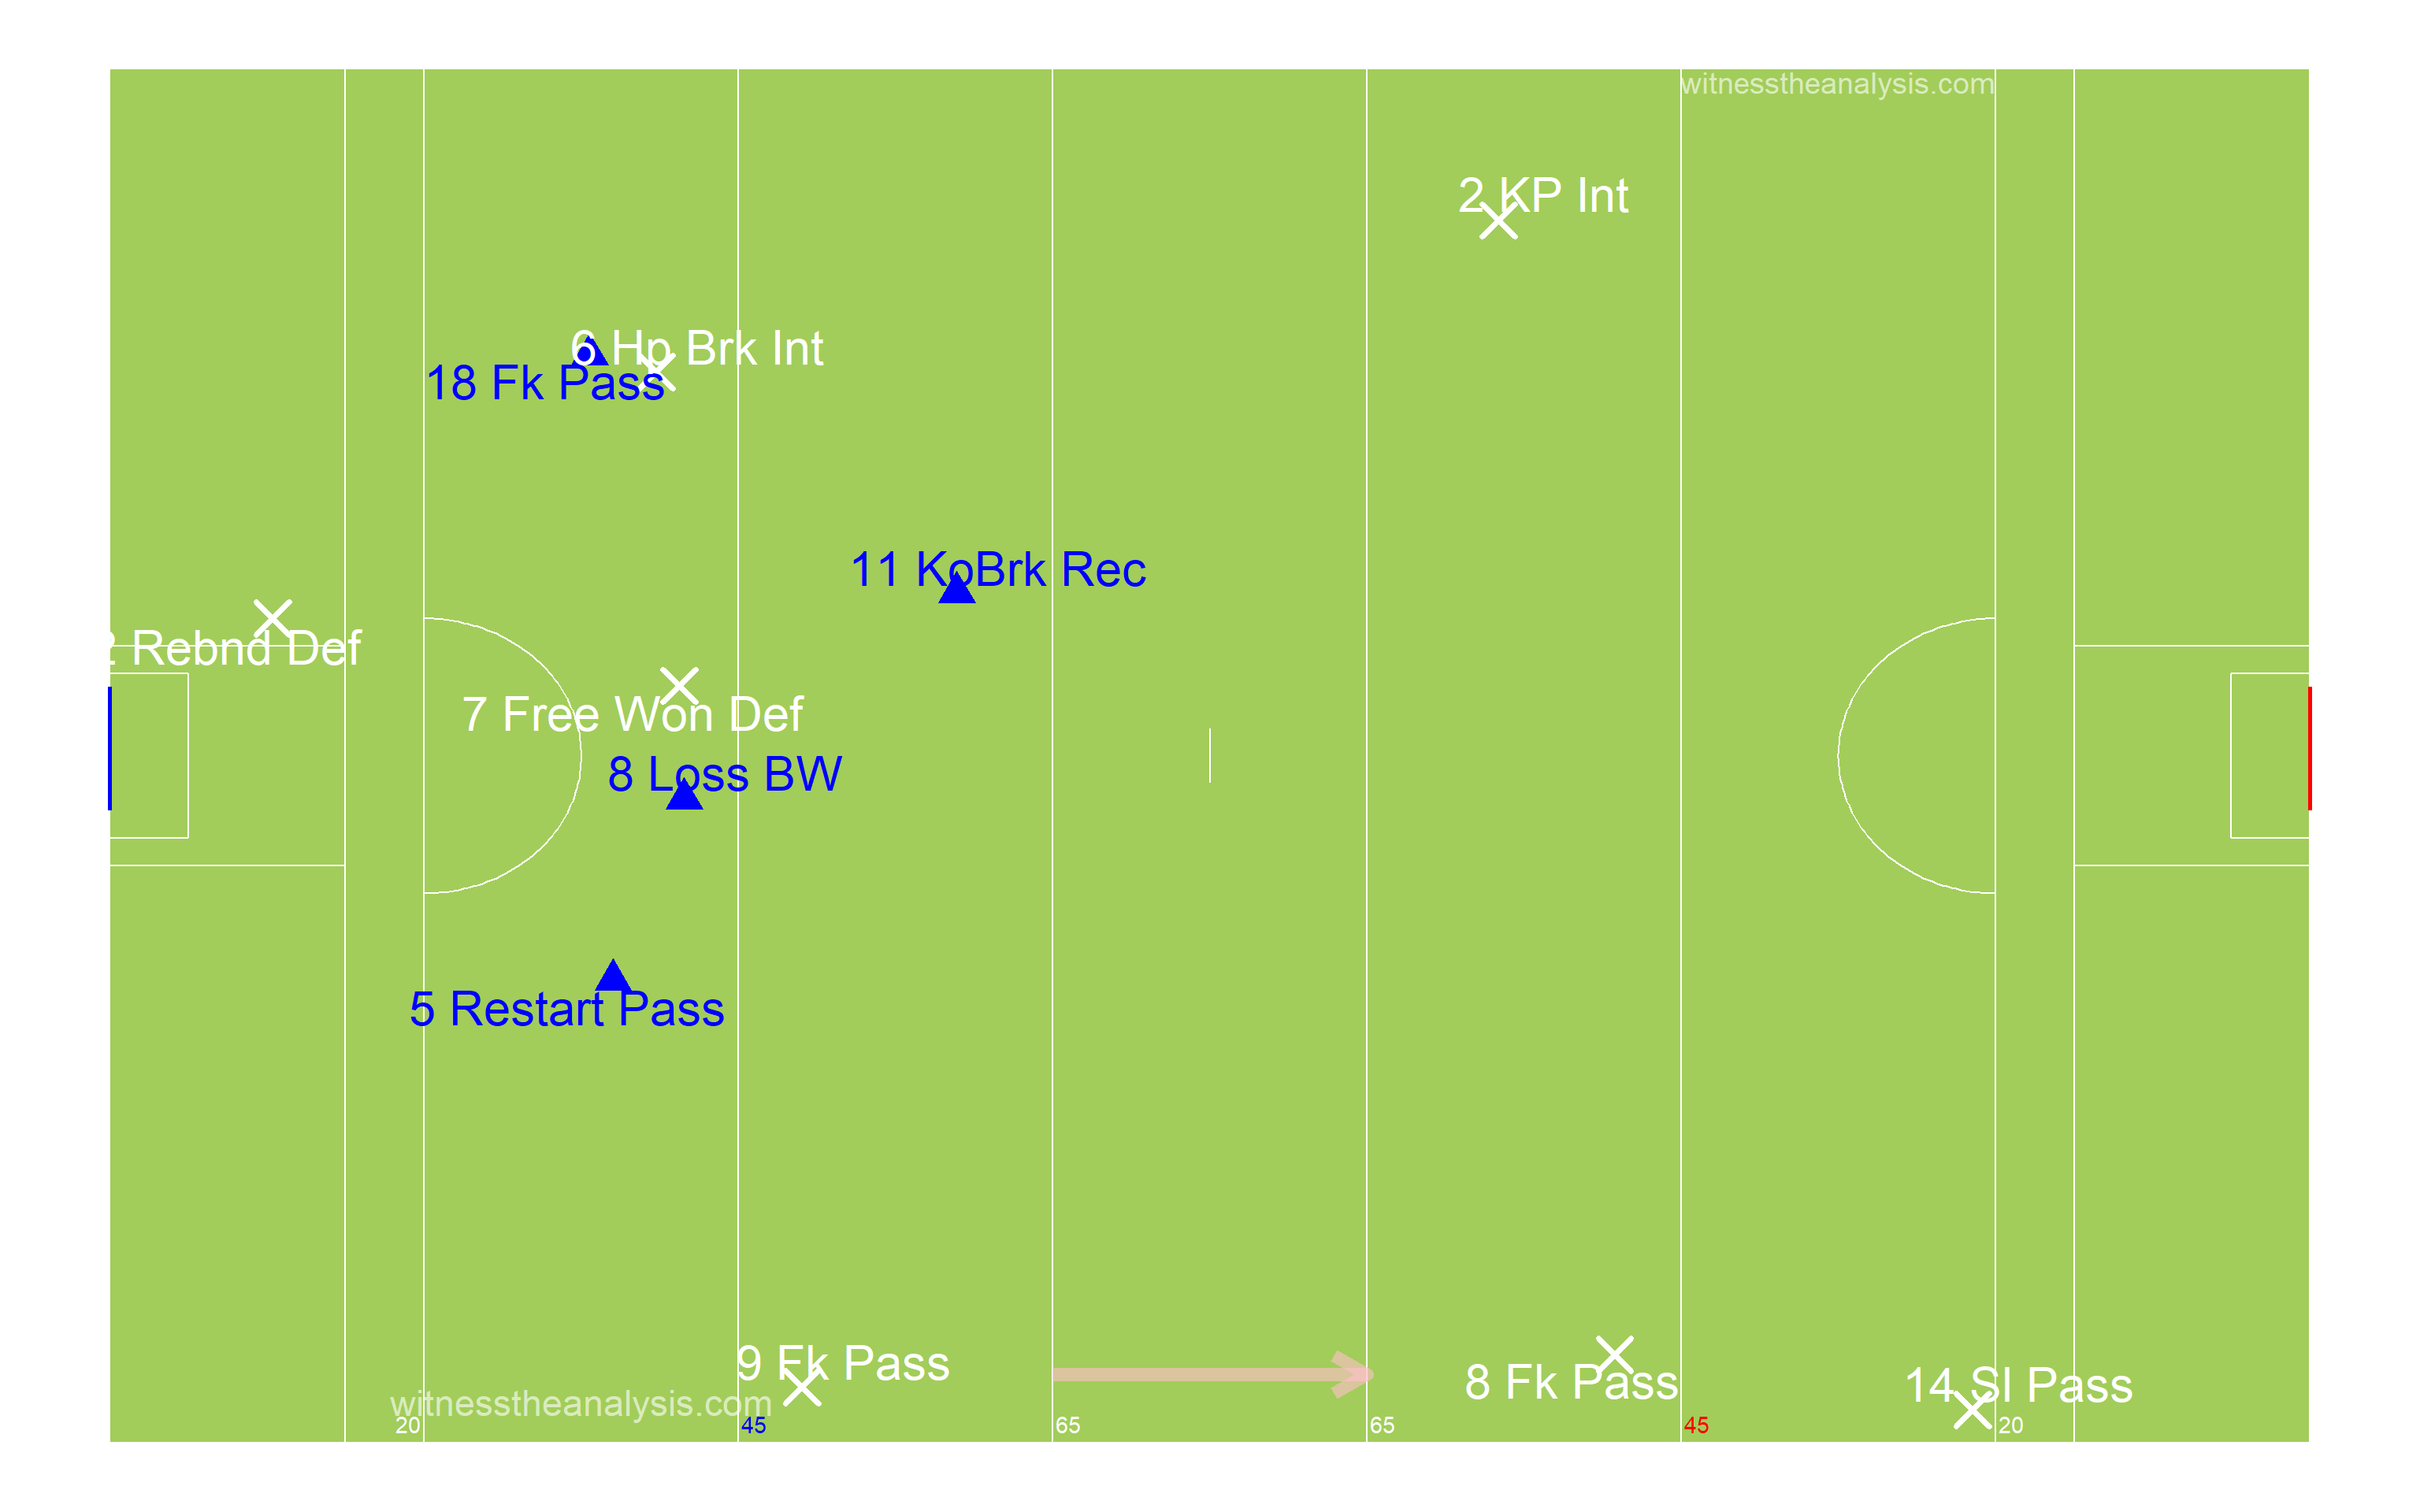
###Ballyboden (Blue = Score) 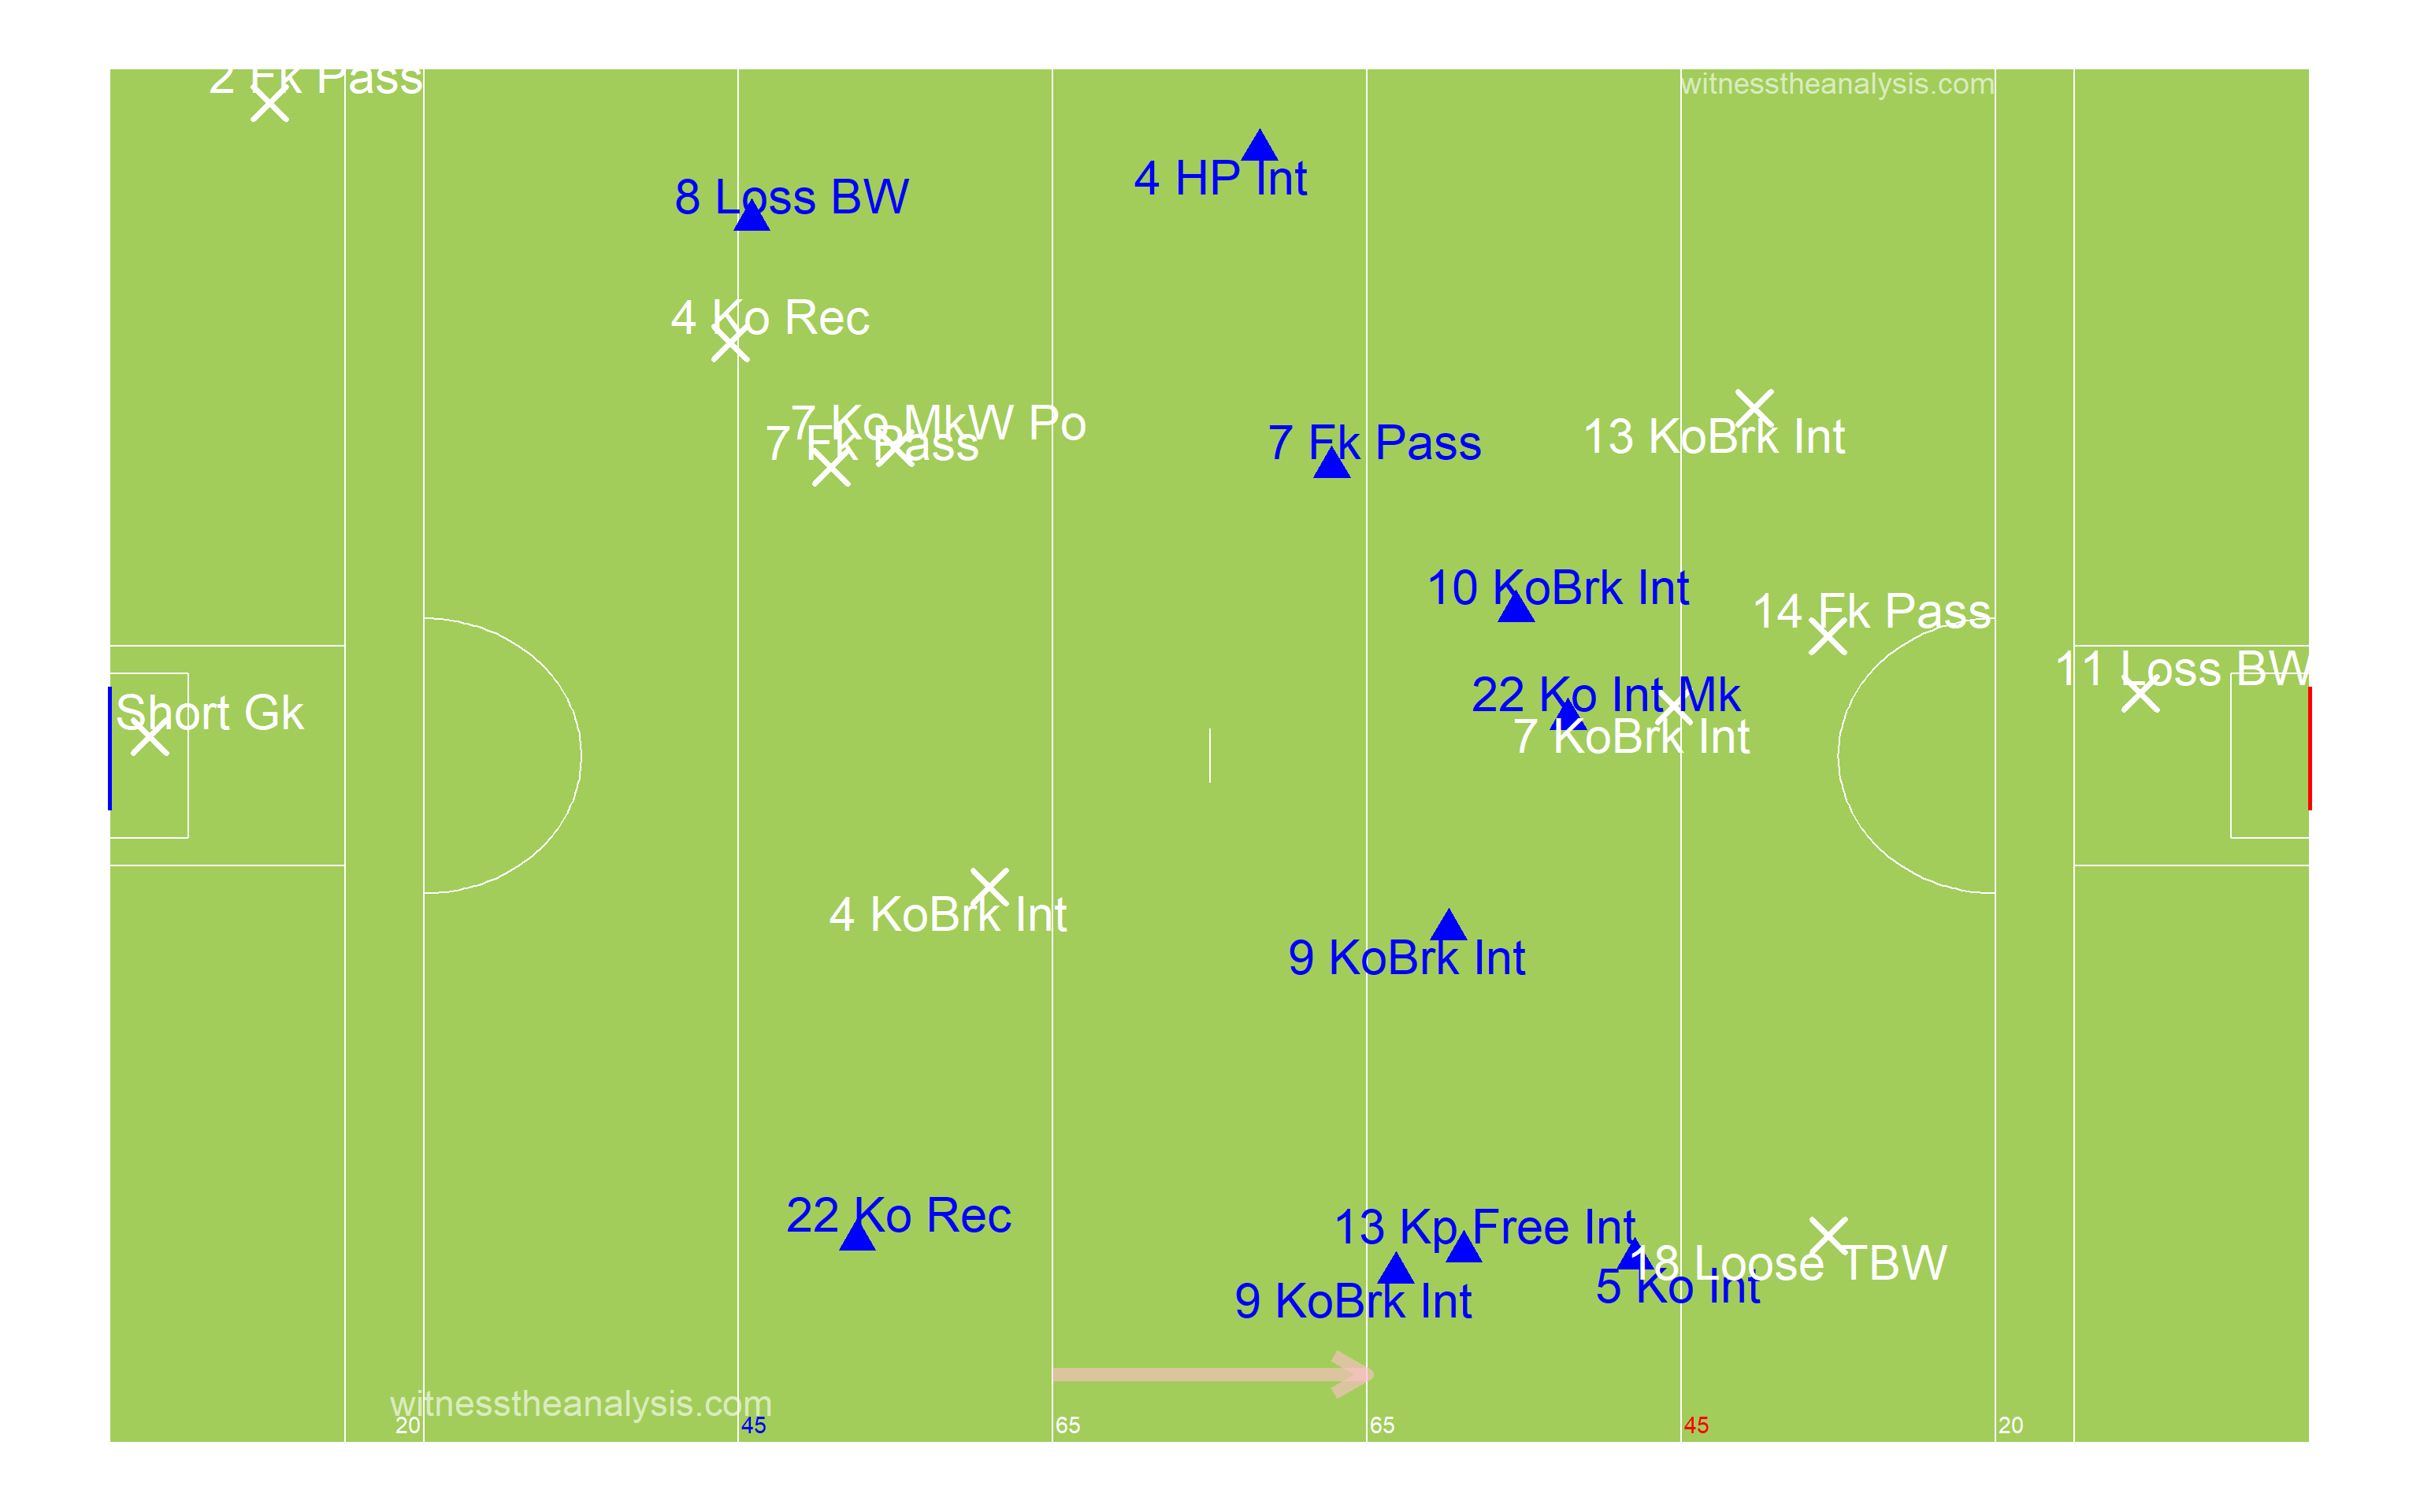
##Shot Network ###Thomas Davis 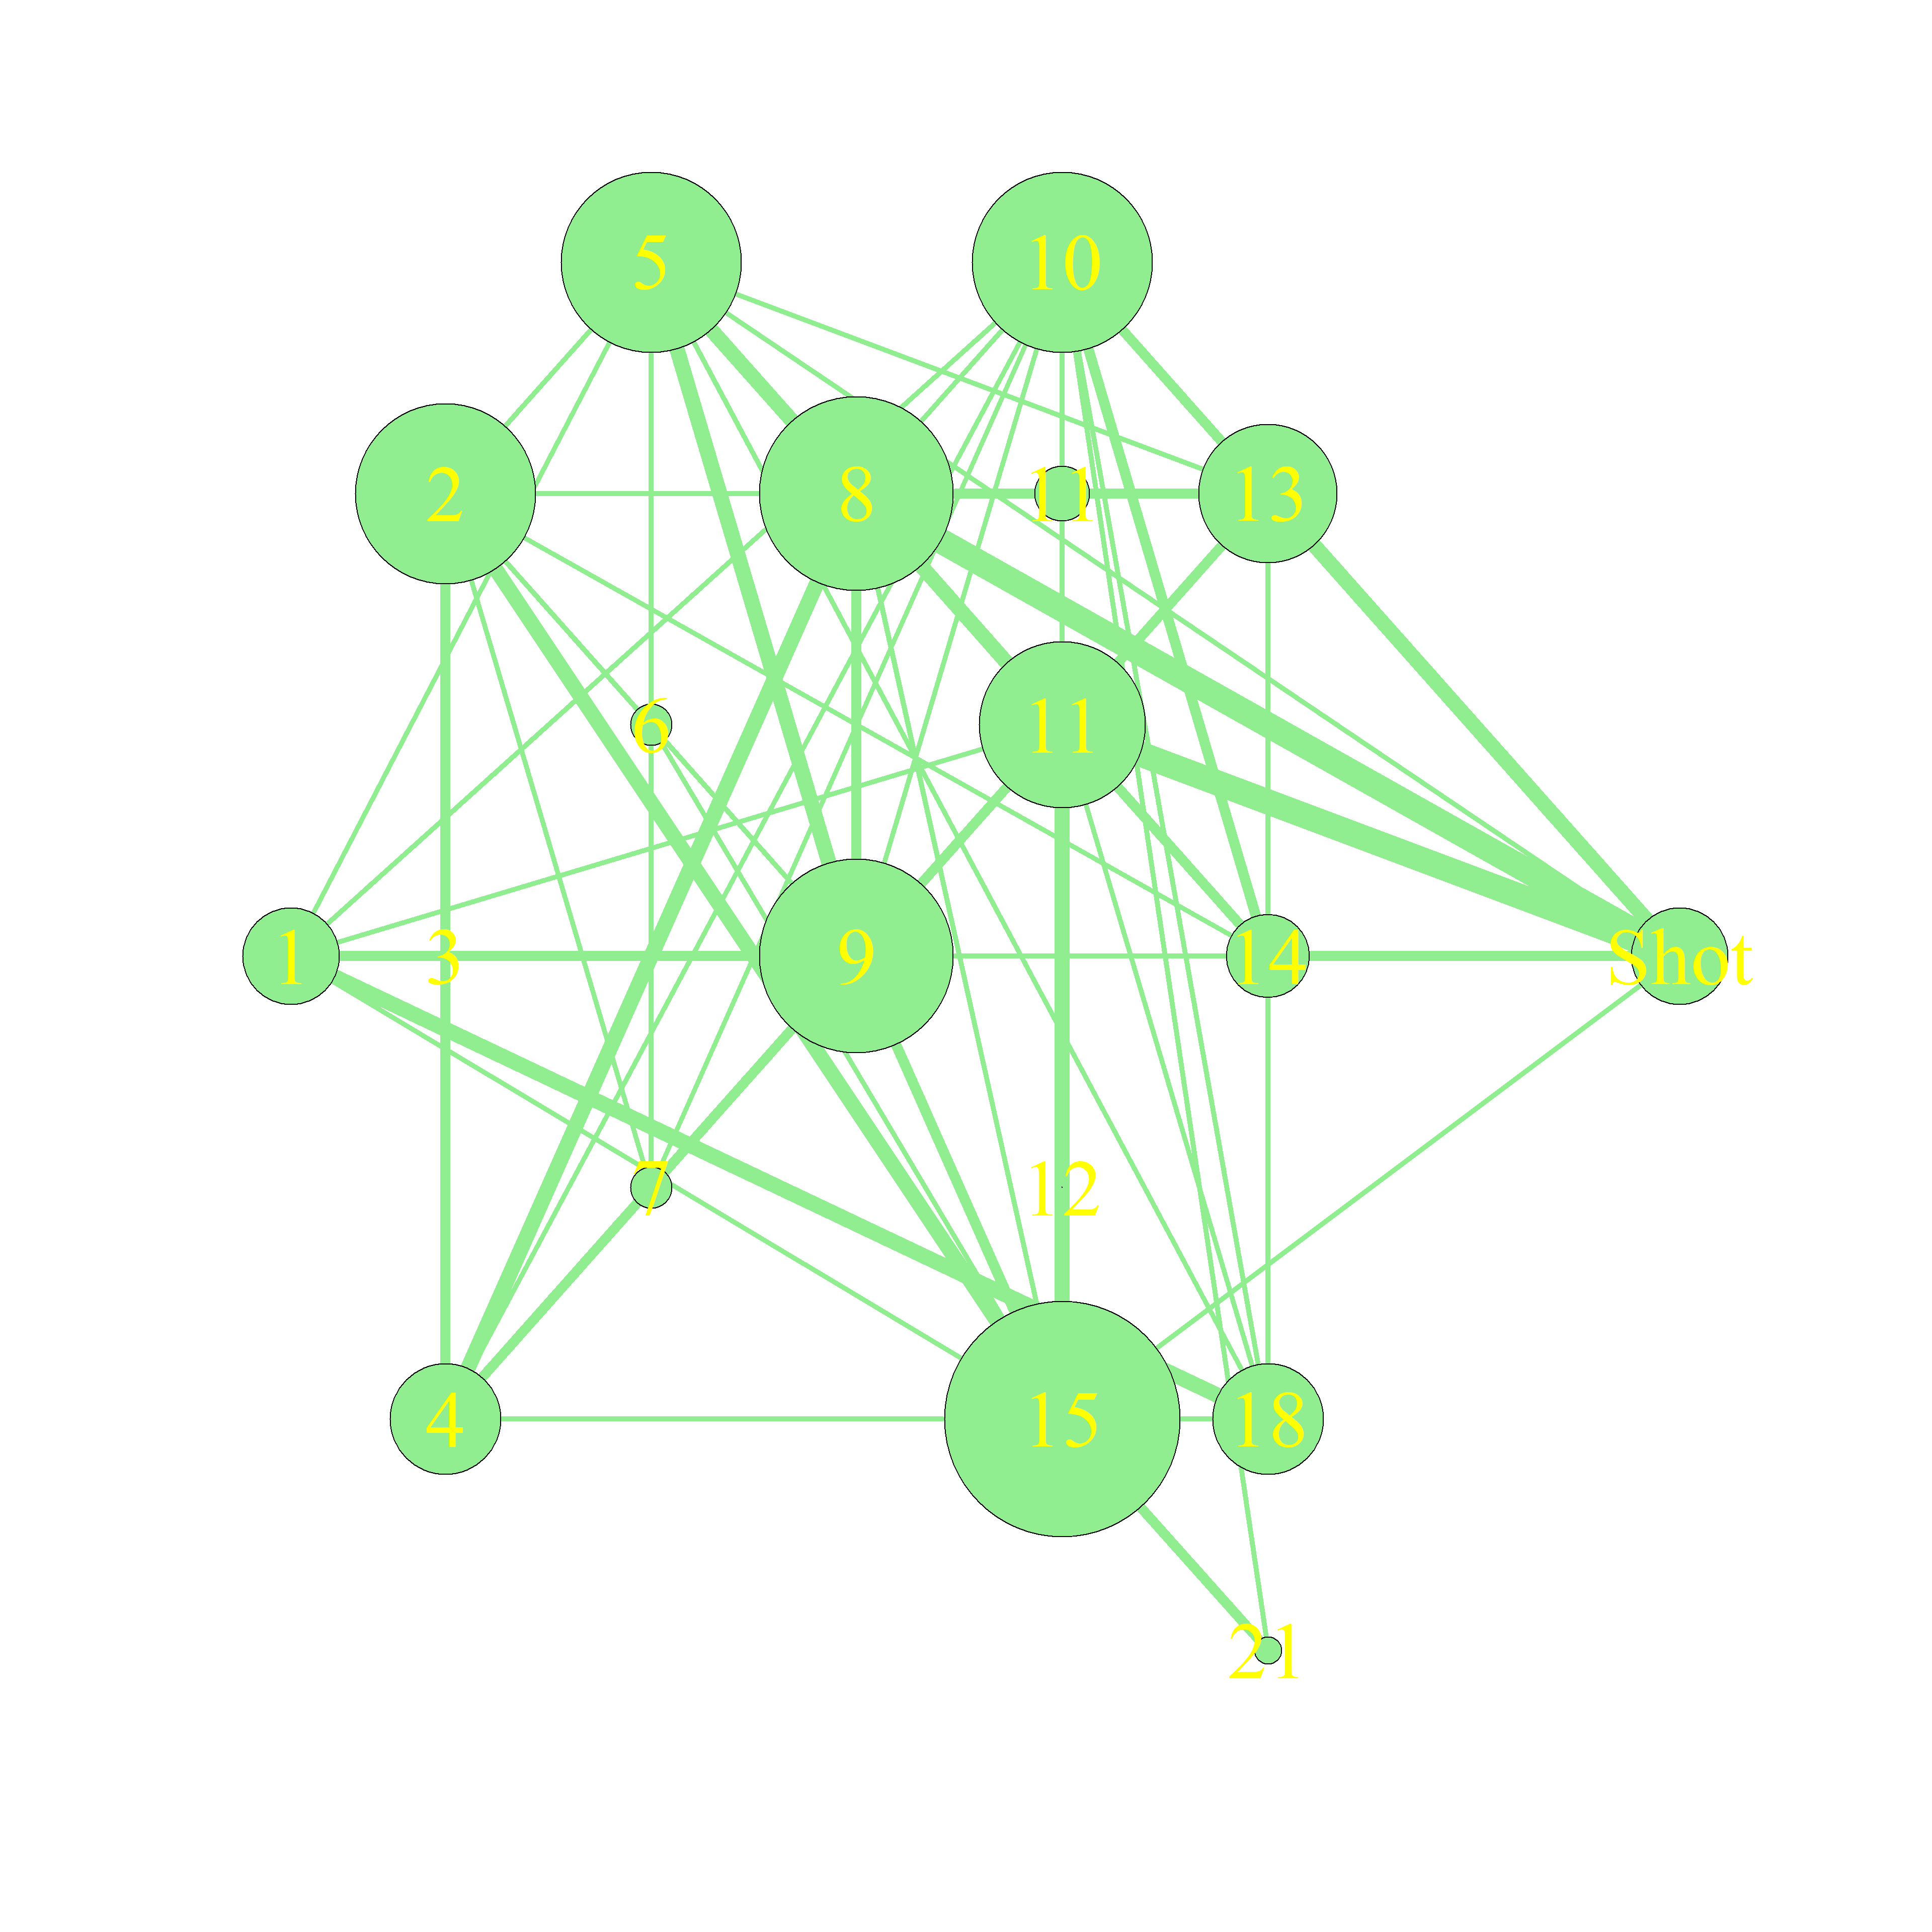
###Ballyboden 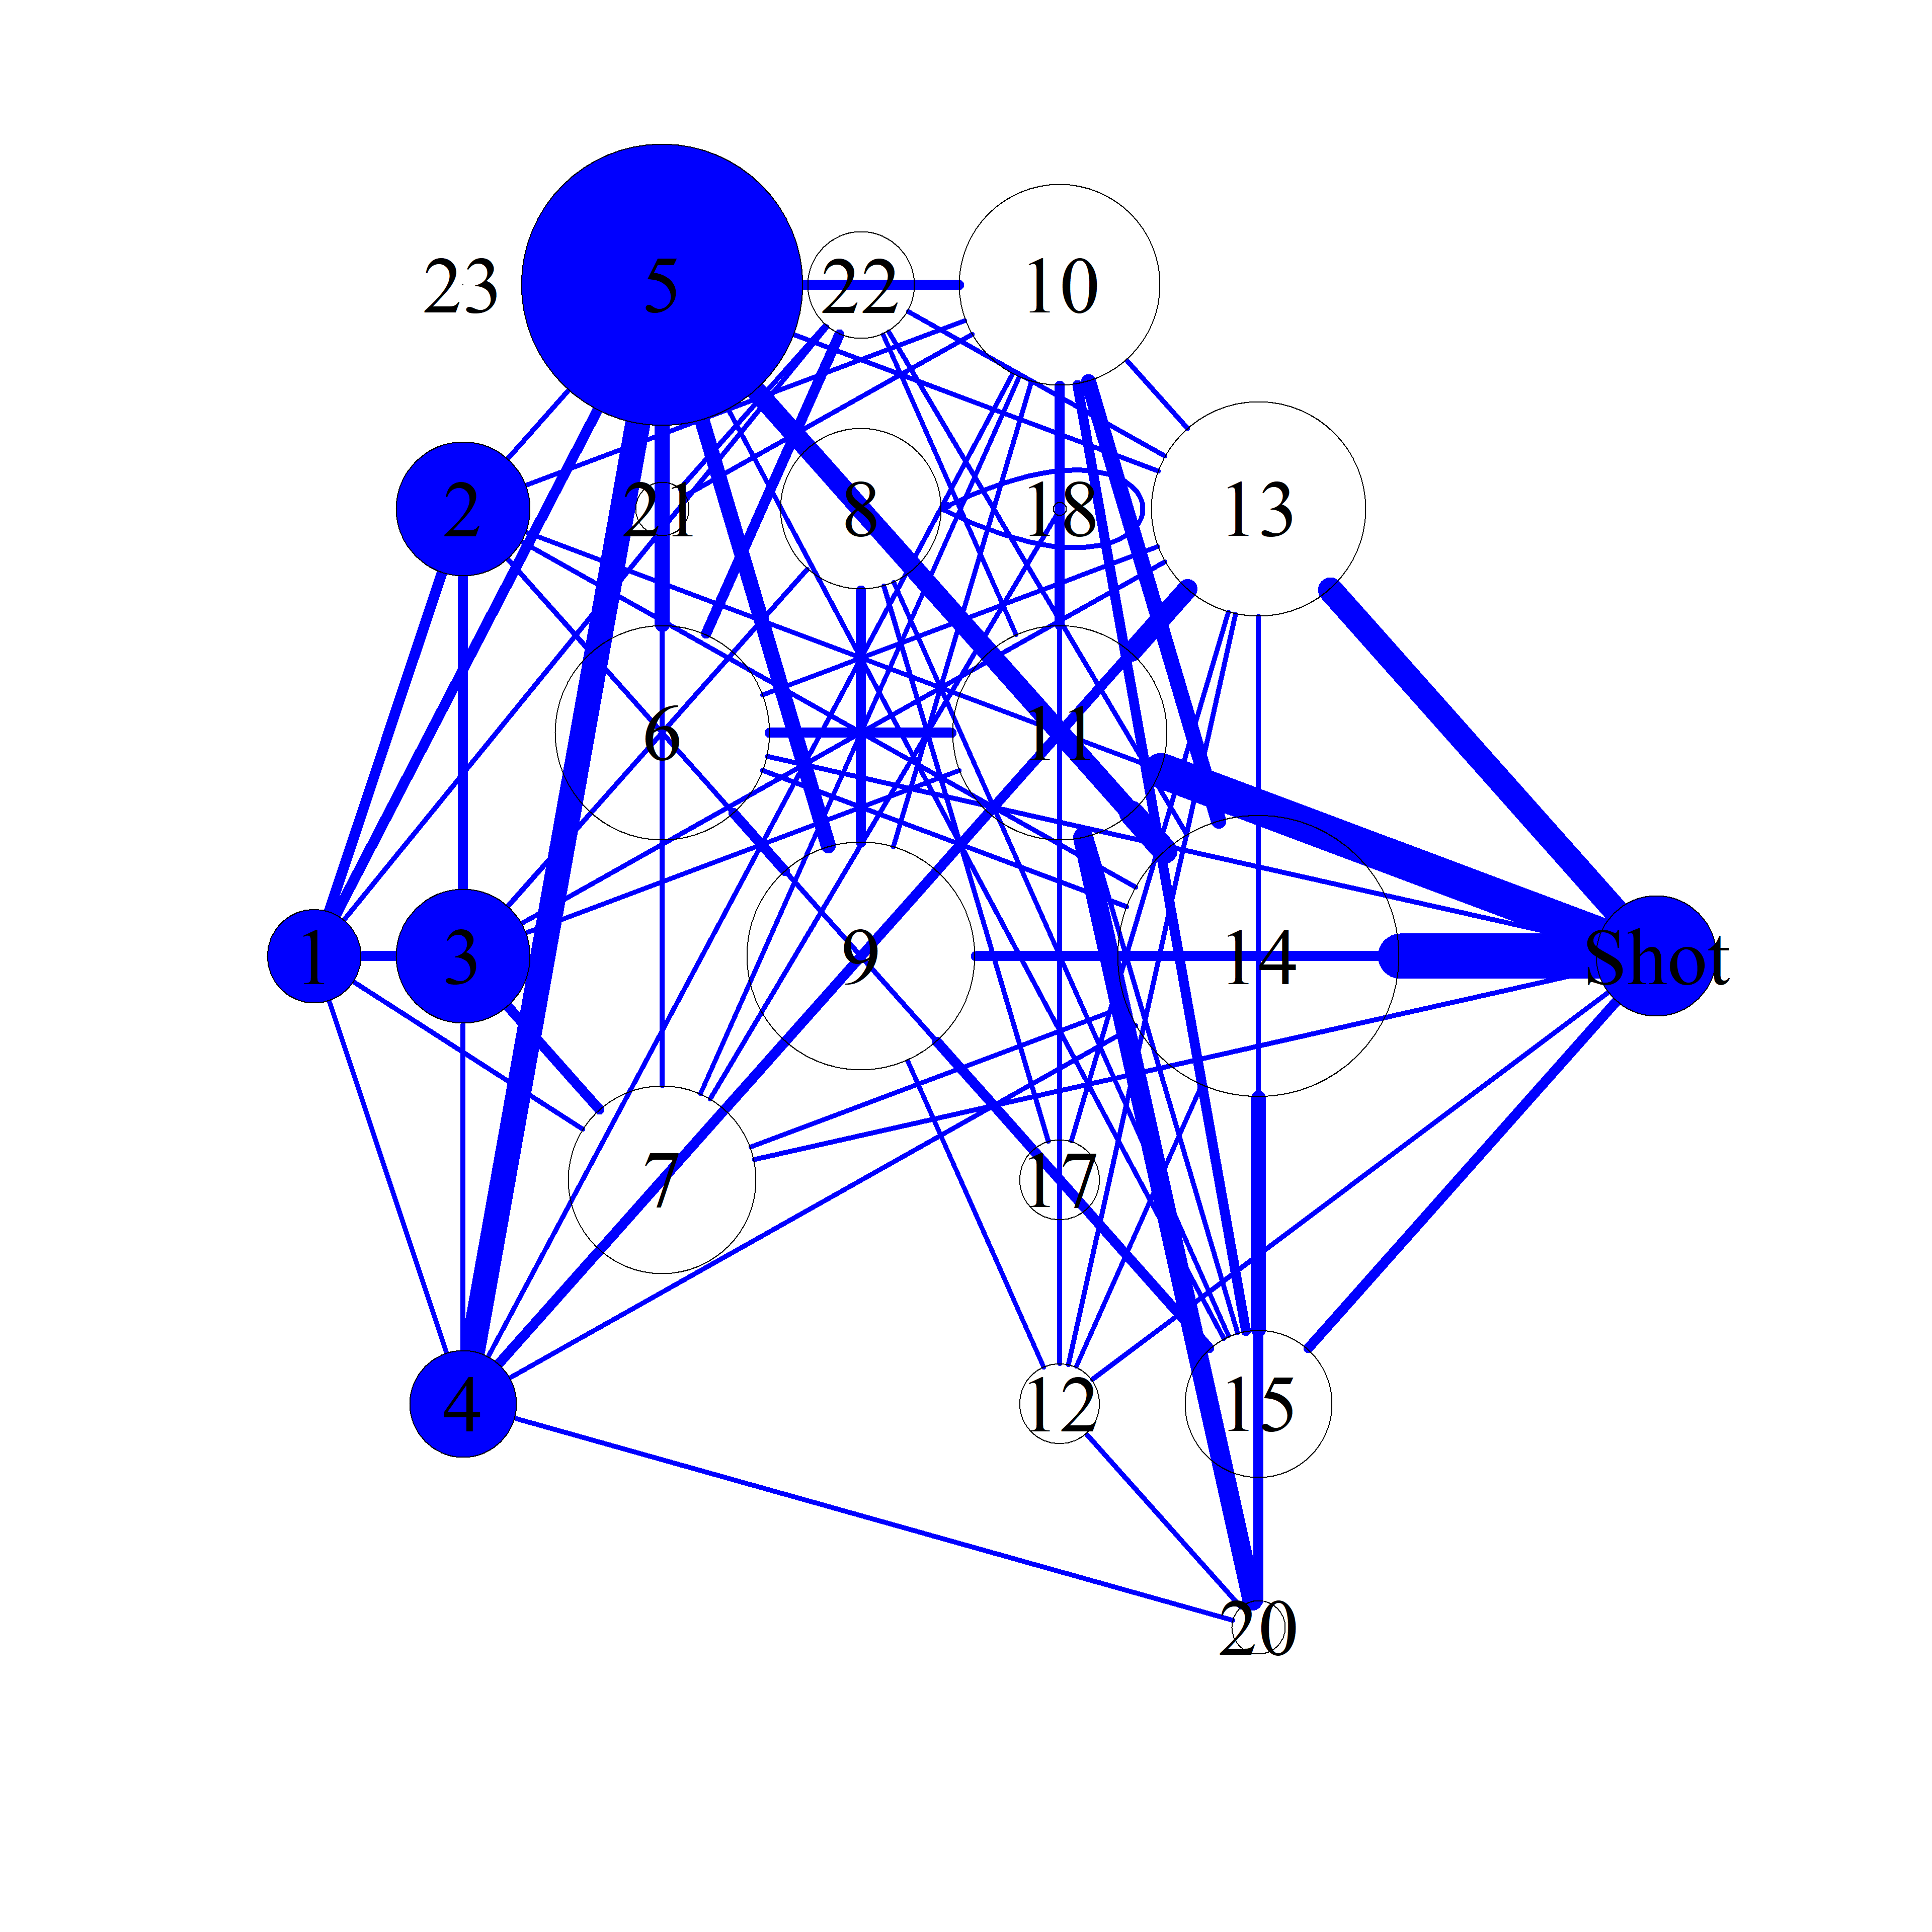
##Score Network ###Thomas Davis 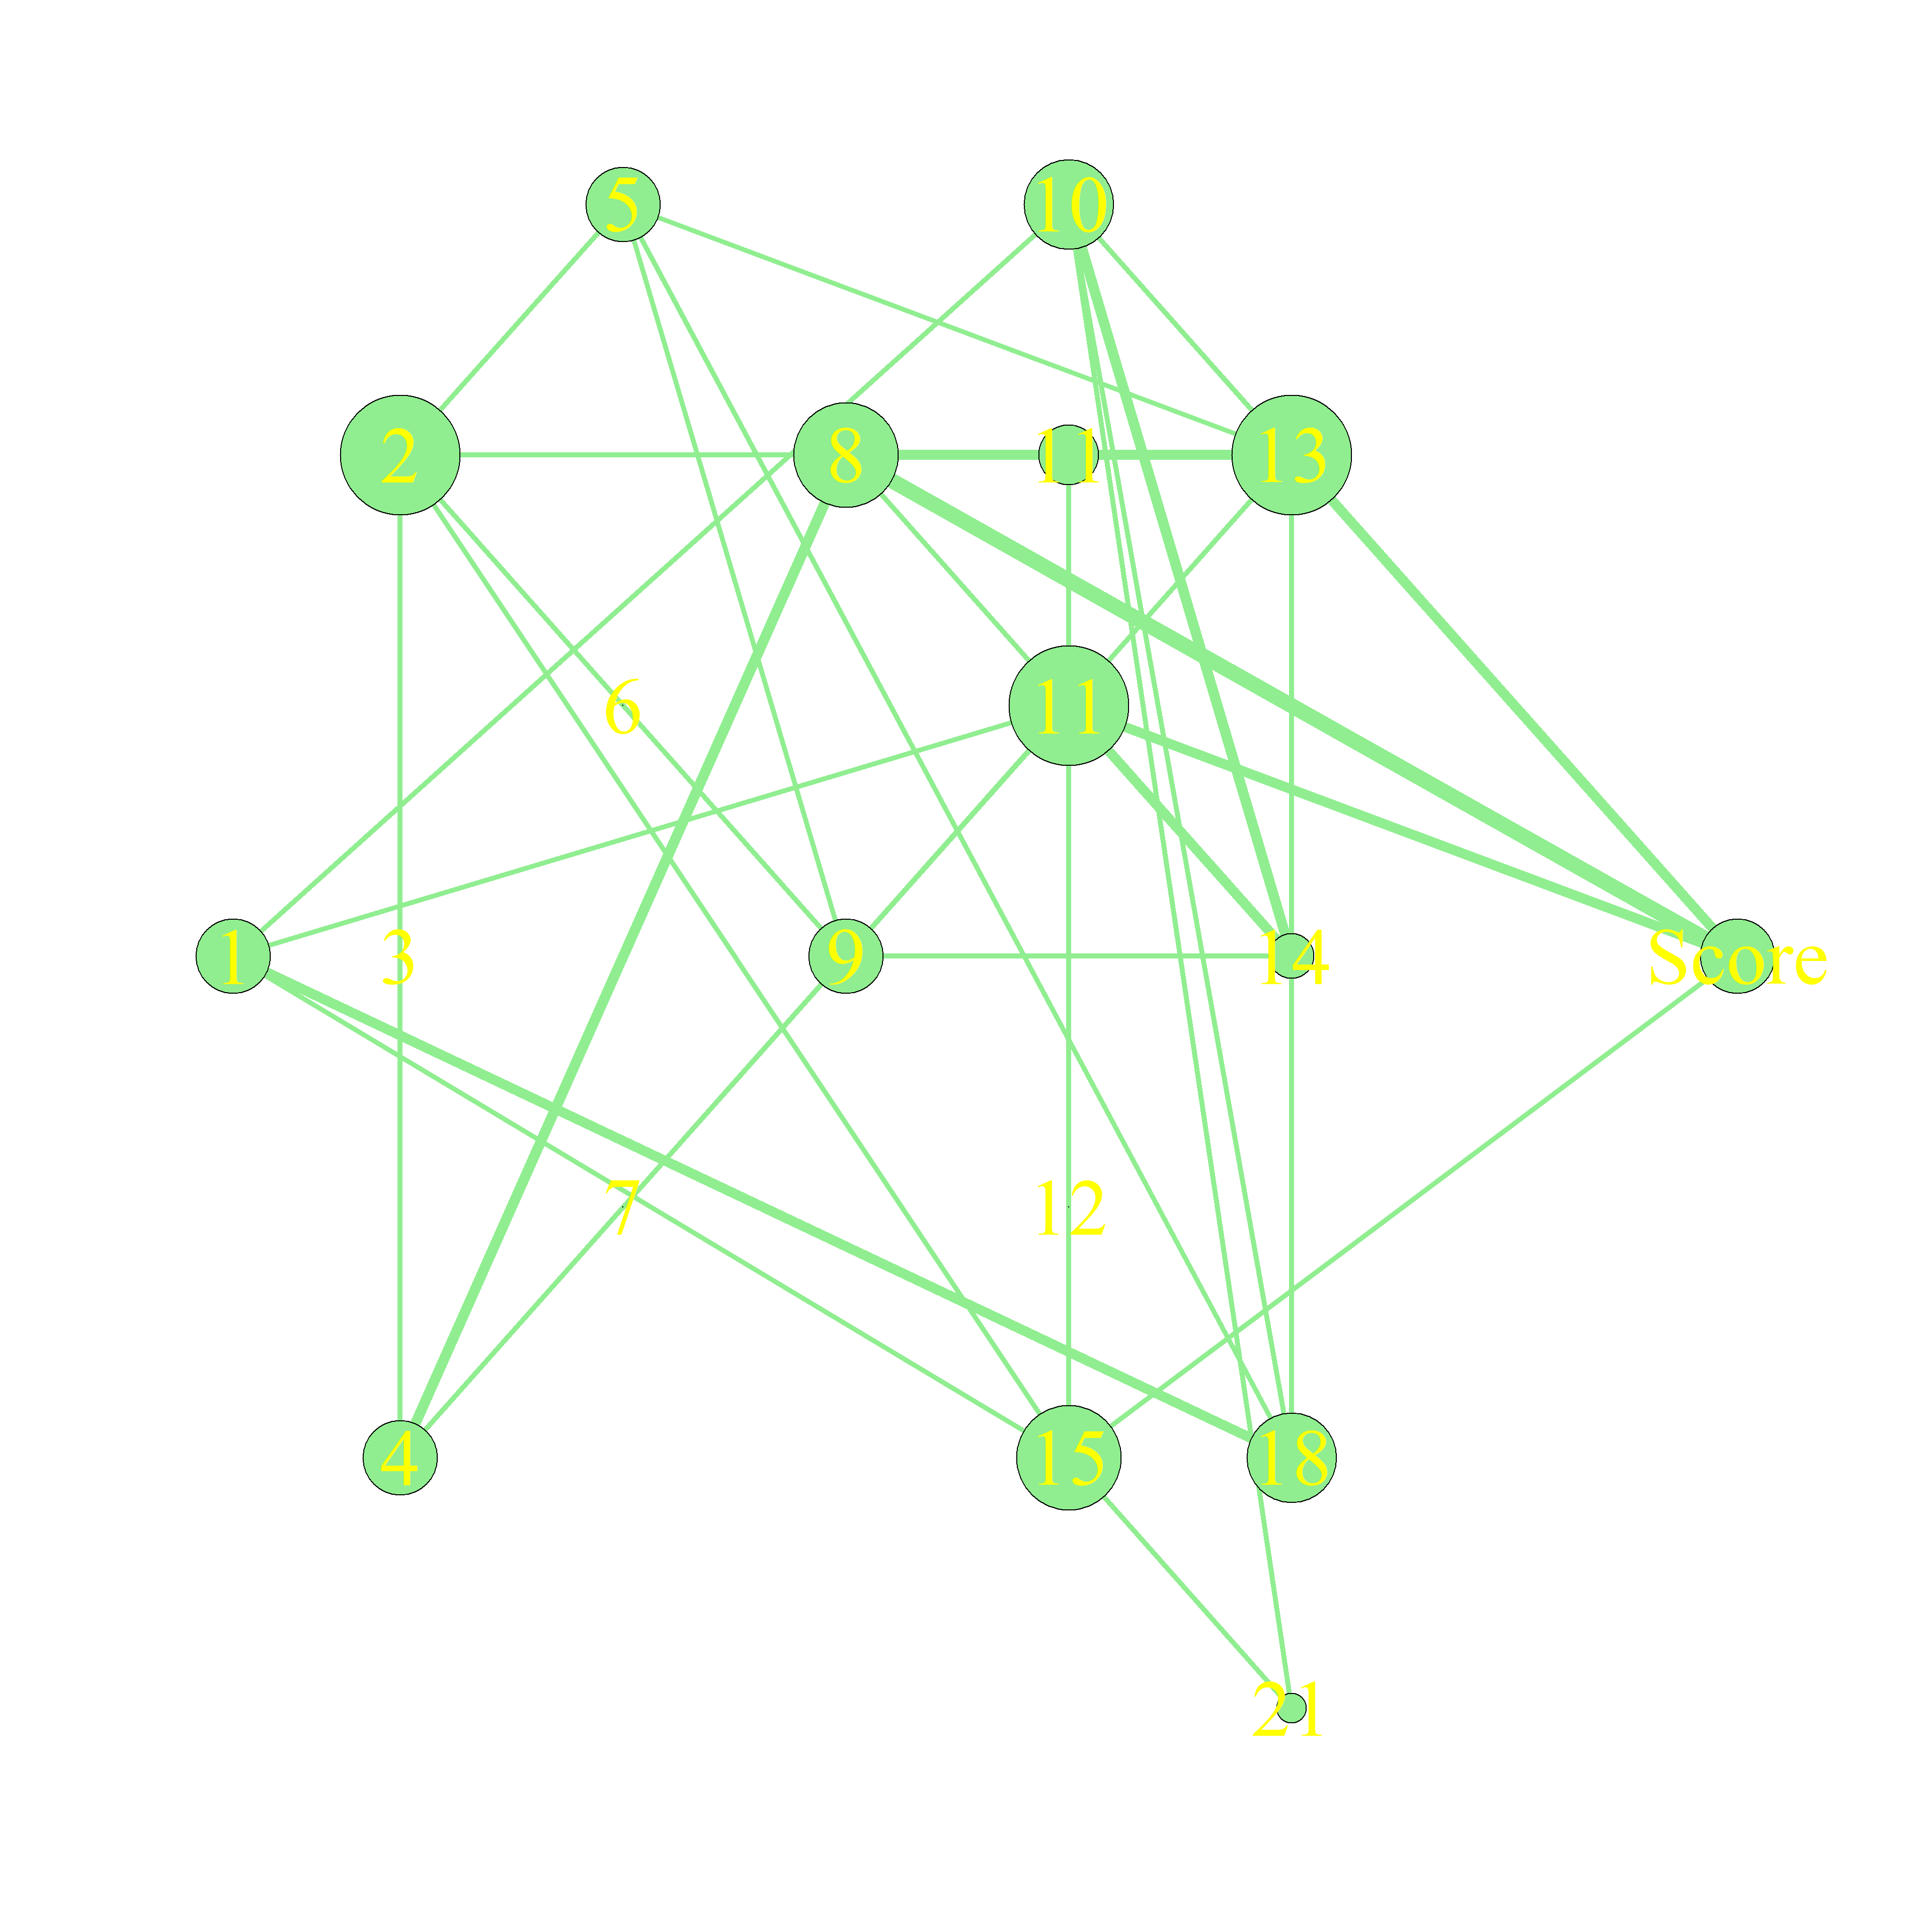
###Ballyboden 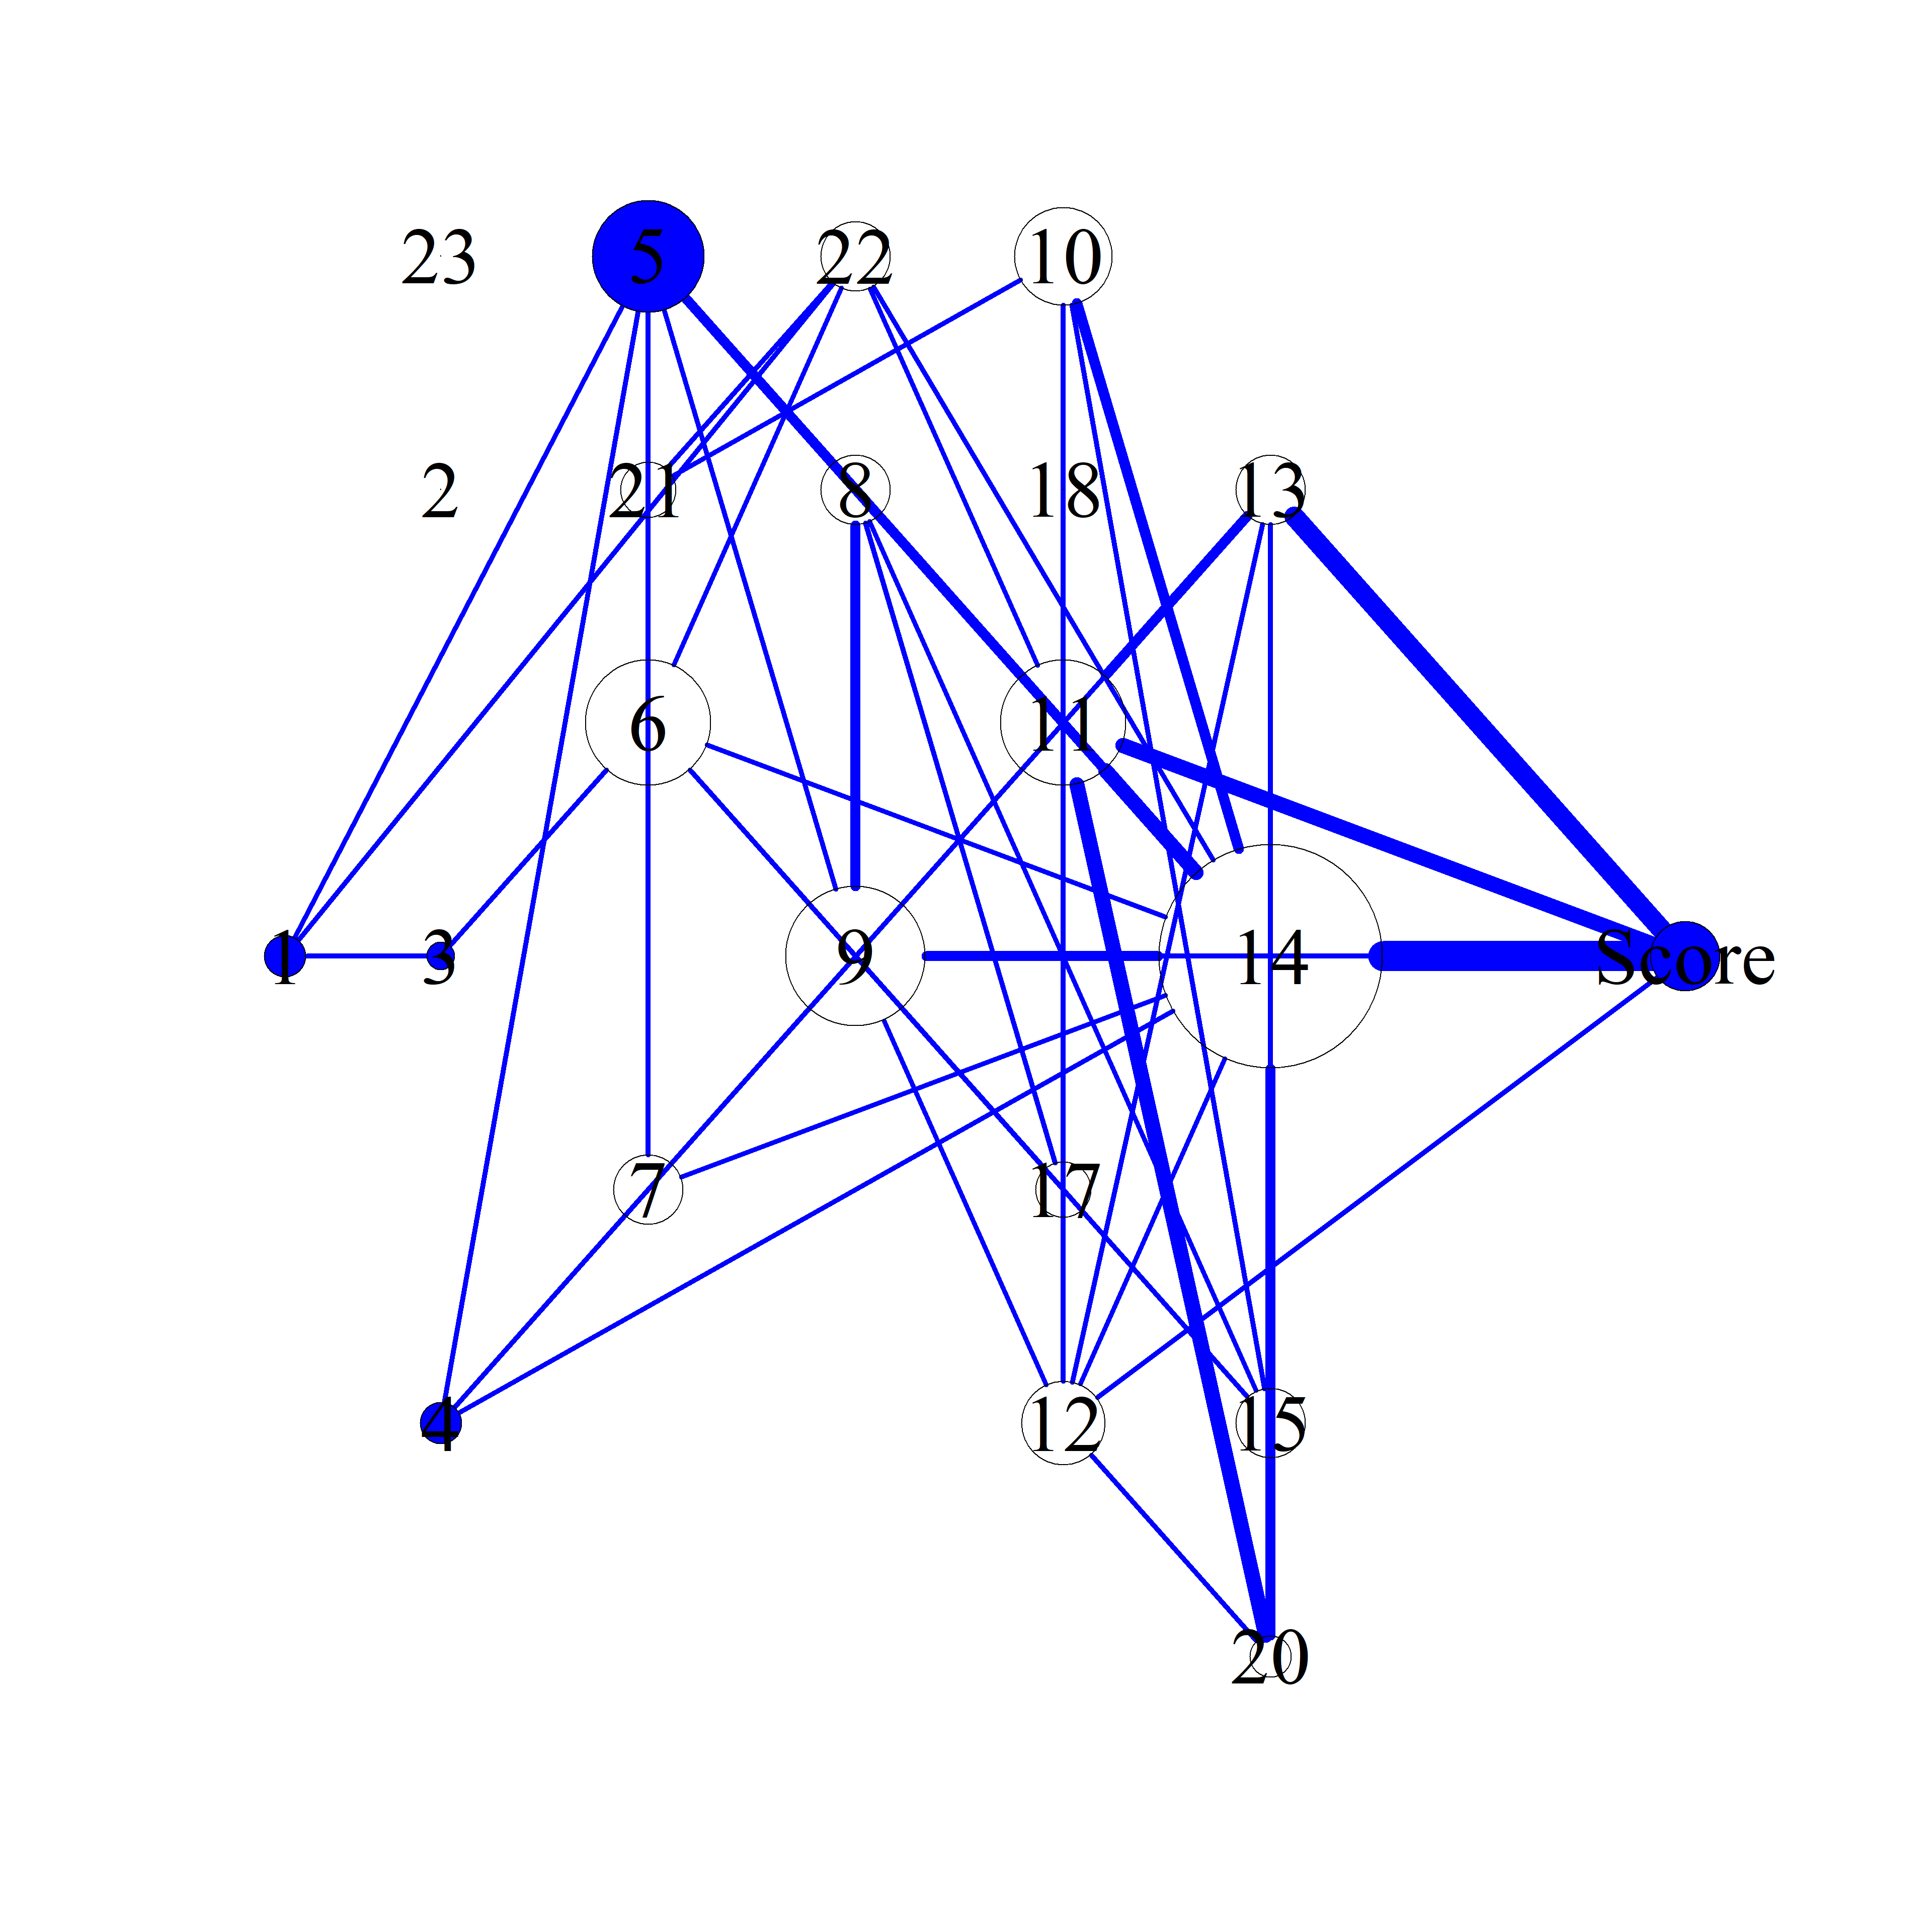
#Passing
##Pass Breakdown| . | Thomas.Davis | Ballyboden |
|---|---|---|
| Hp | 99 | 152 |
| Kp | 0 | 0 |
| Kp Left | 3 | 10 |
| Kp Right | 16 | 18 |
| Fk Pass | 12 | 13 |
| Sl Pass | 1 | 2 |
| Mk Kp | 0 | 0 |
| Mk Hp | 0 | 0 |
| Sl Kp Won To | 0 | 0 |
| 45 Pass | 0 | 0 |
| Hp Assist | 3 | 8 |
| Kp L Assist | 0 | 0 |
| Kp R Assist | 1 | 1 |
| Hp Key | 6 | 8 |
| Kp L Key | 0 | 0 |
| Kp R Key | 0 | 2 |
| Mk Kp Key | 0 | 0 |
| Mk Kp Key | 0 | 0 |
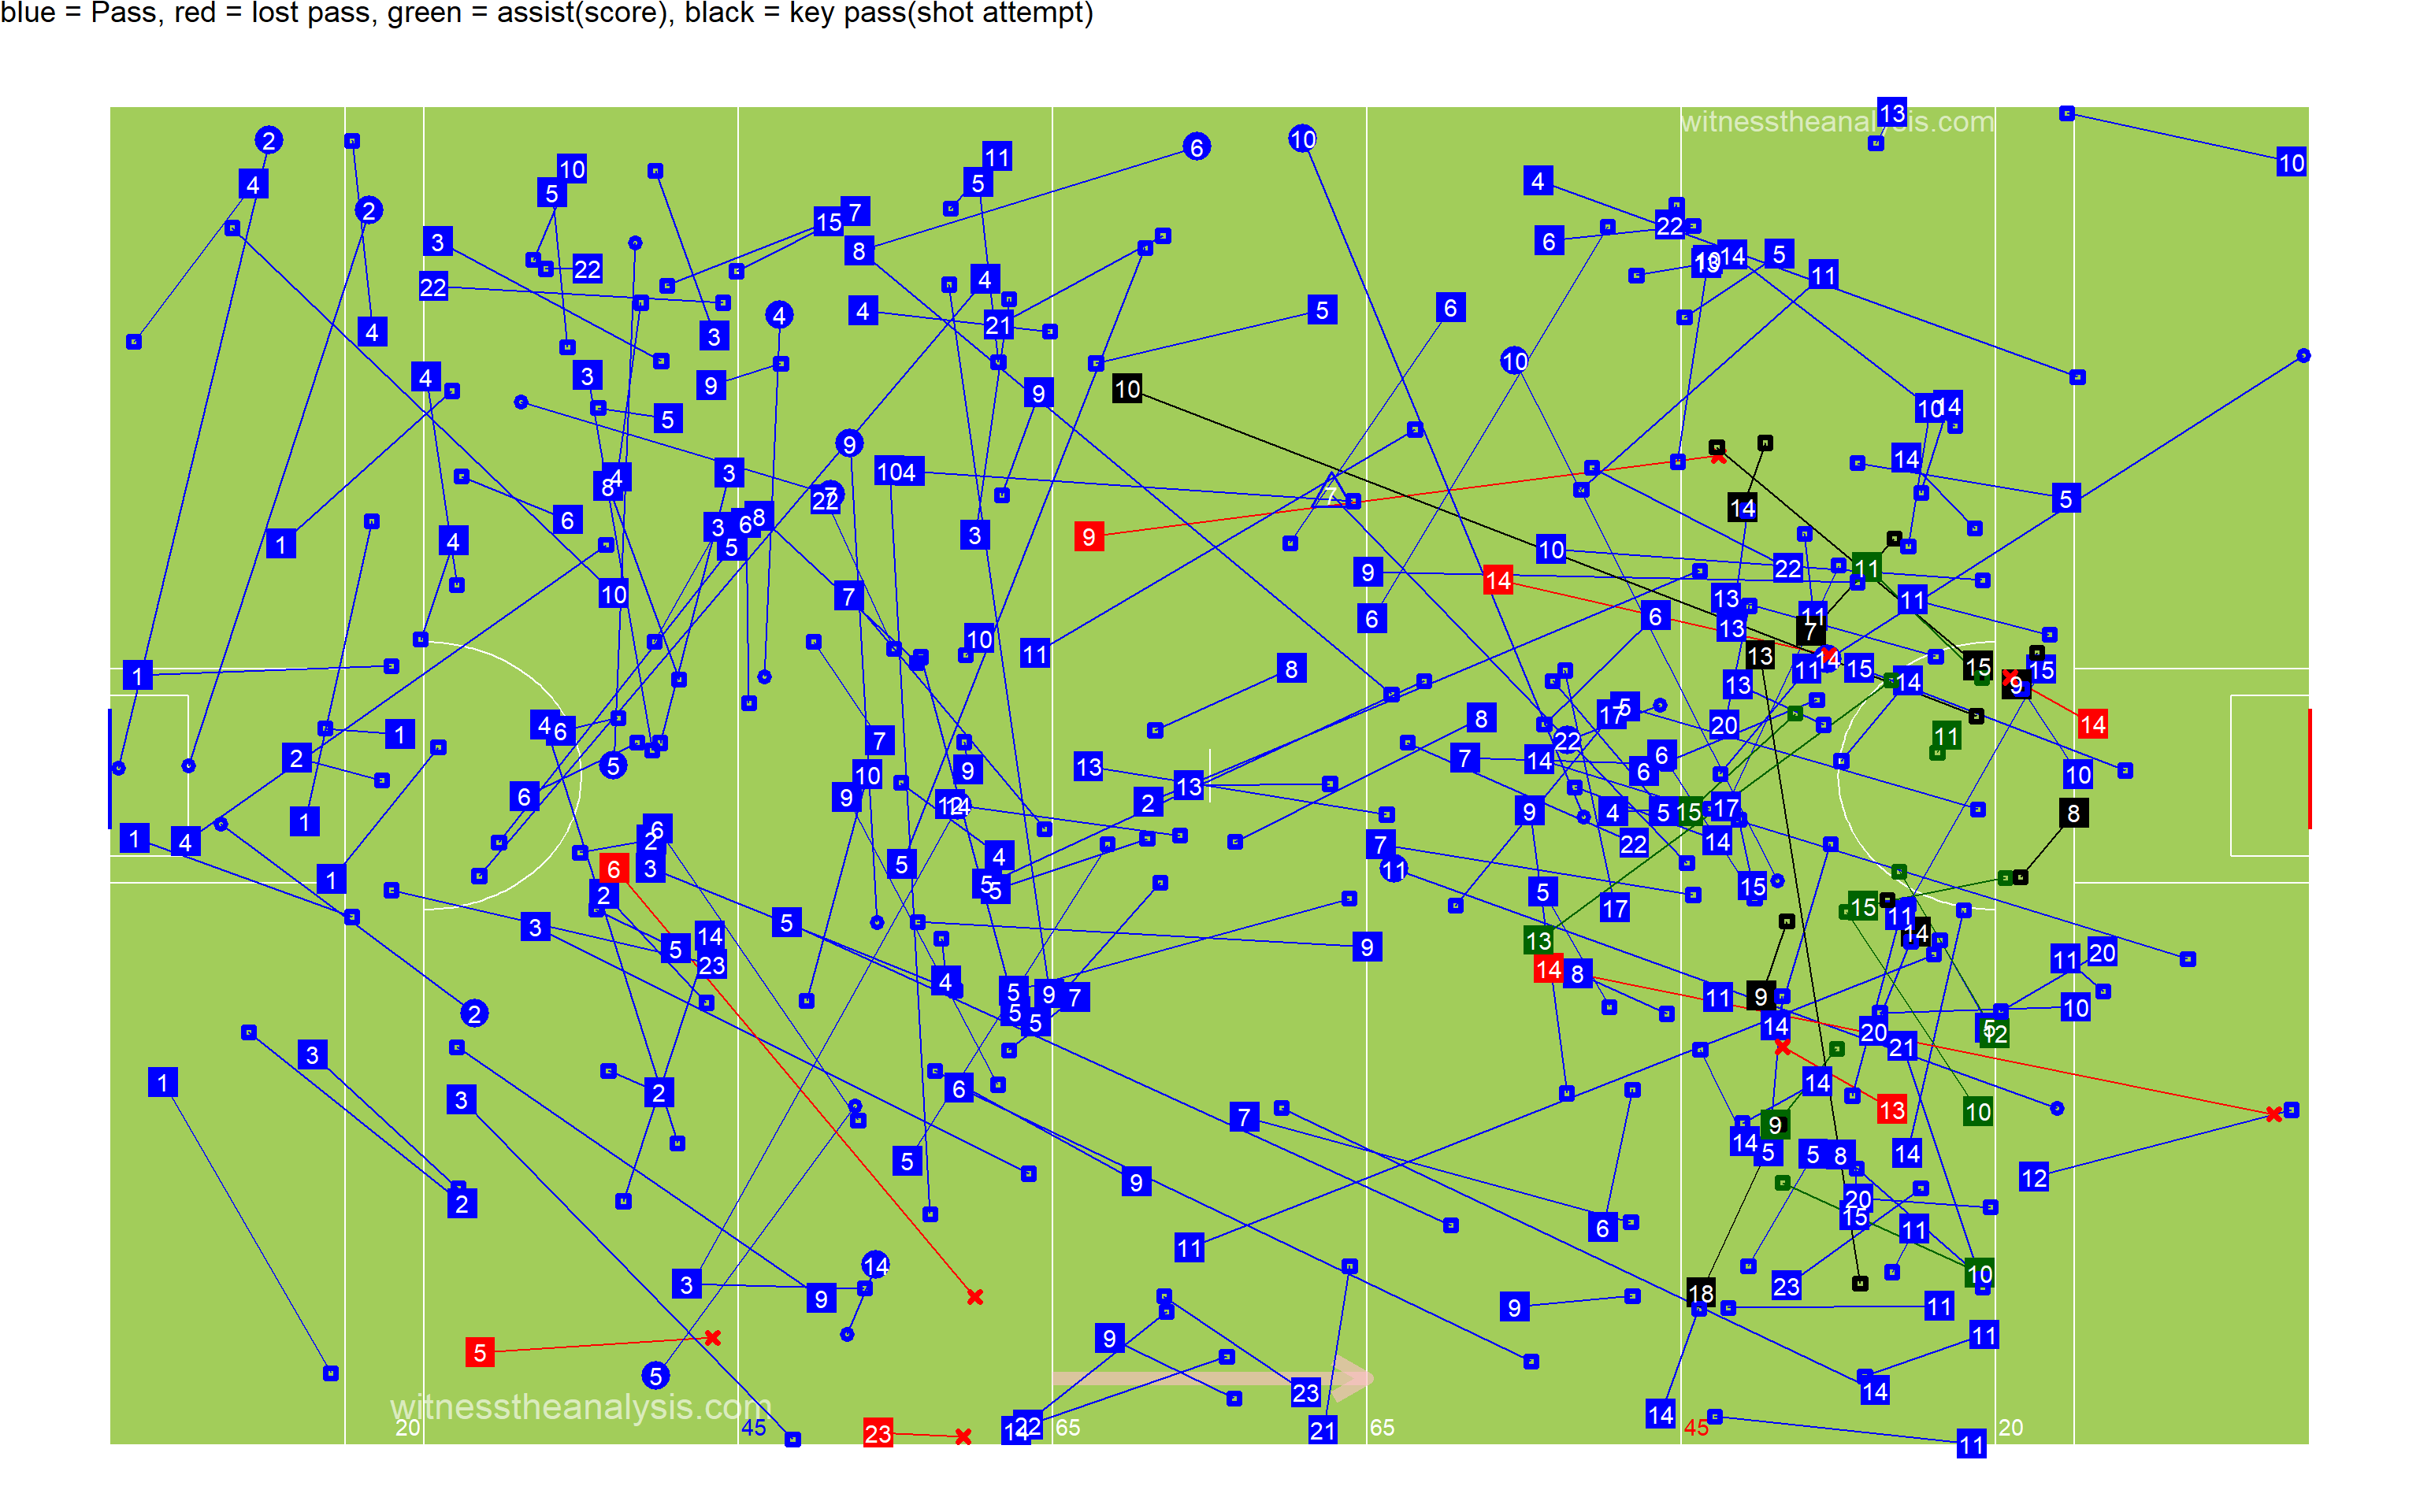
##All Passes ###Thomas Davis
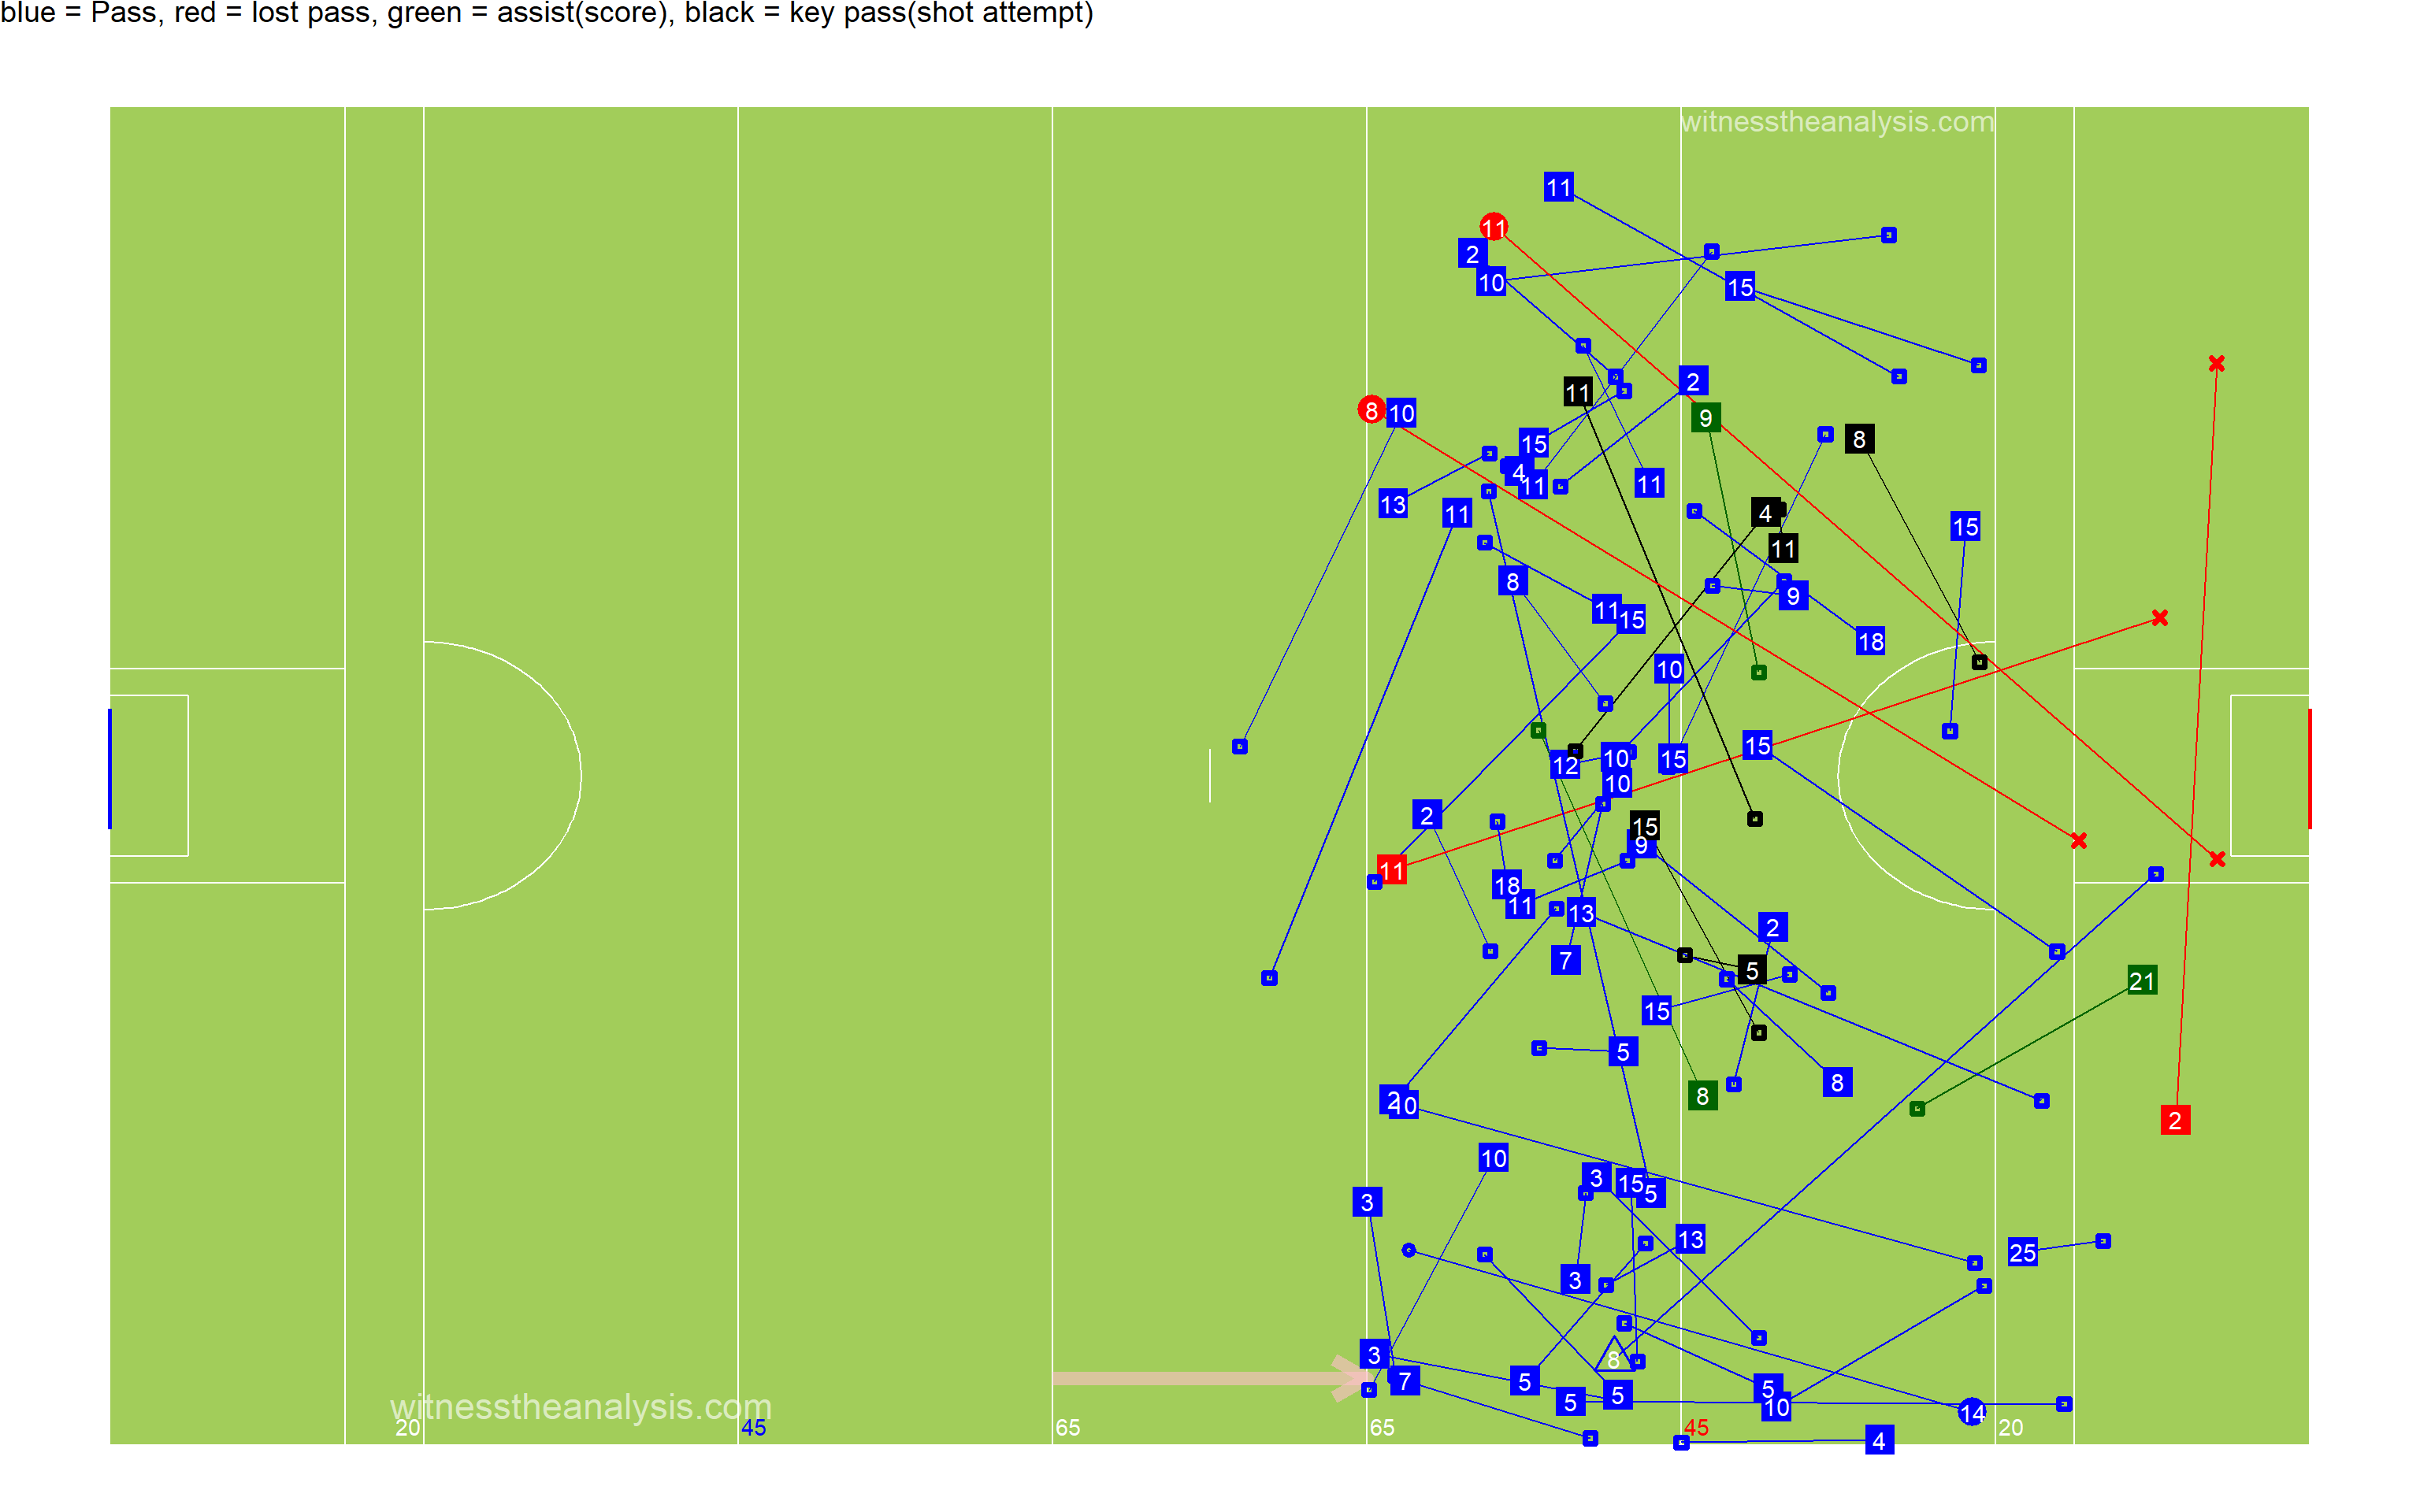
###Ballyboden
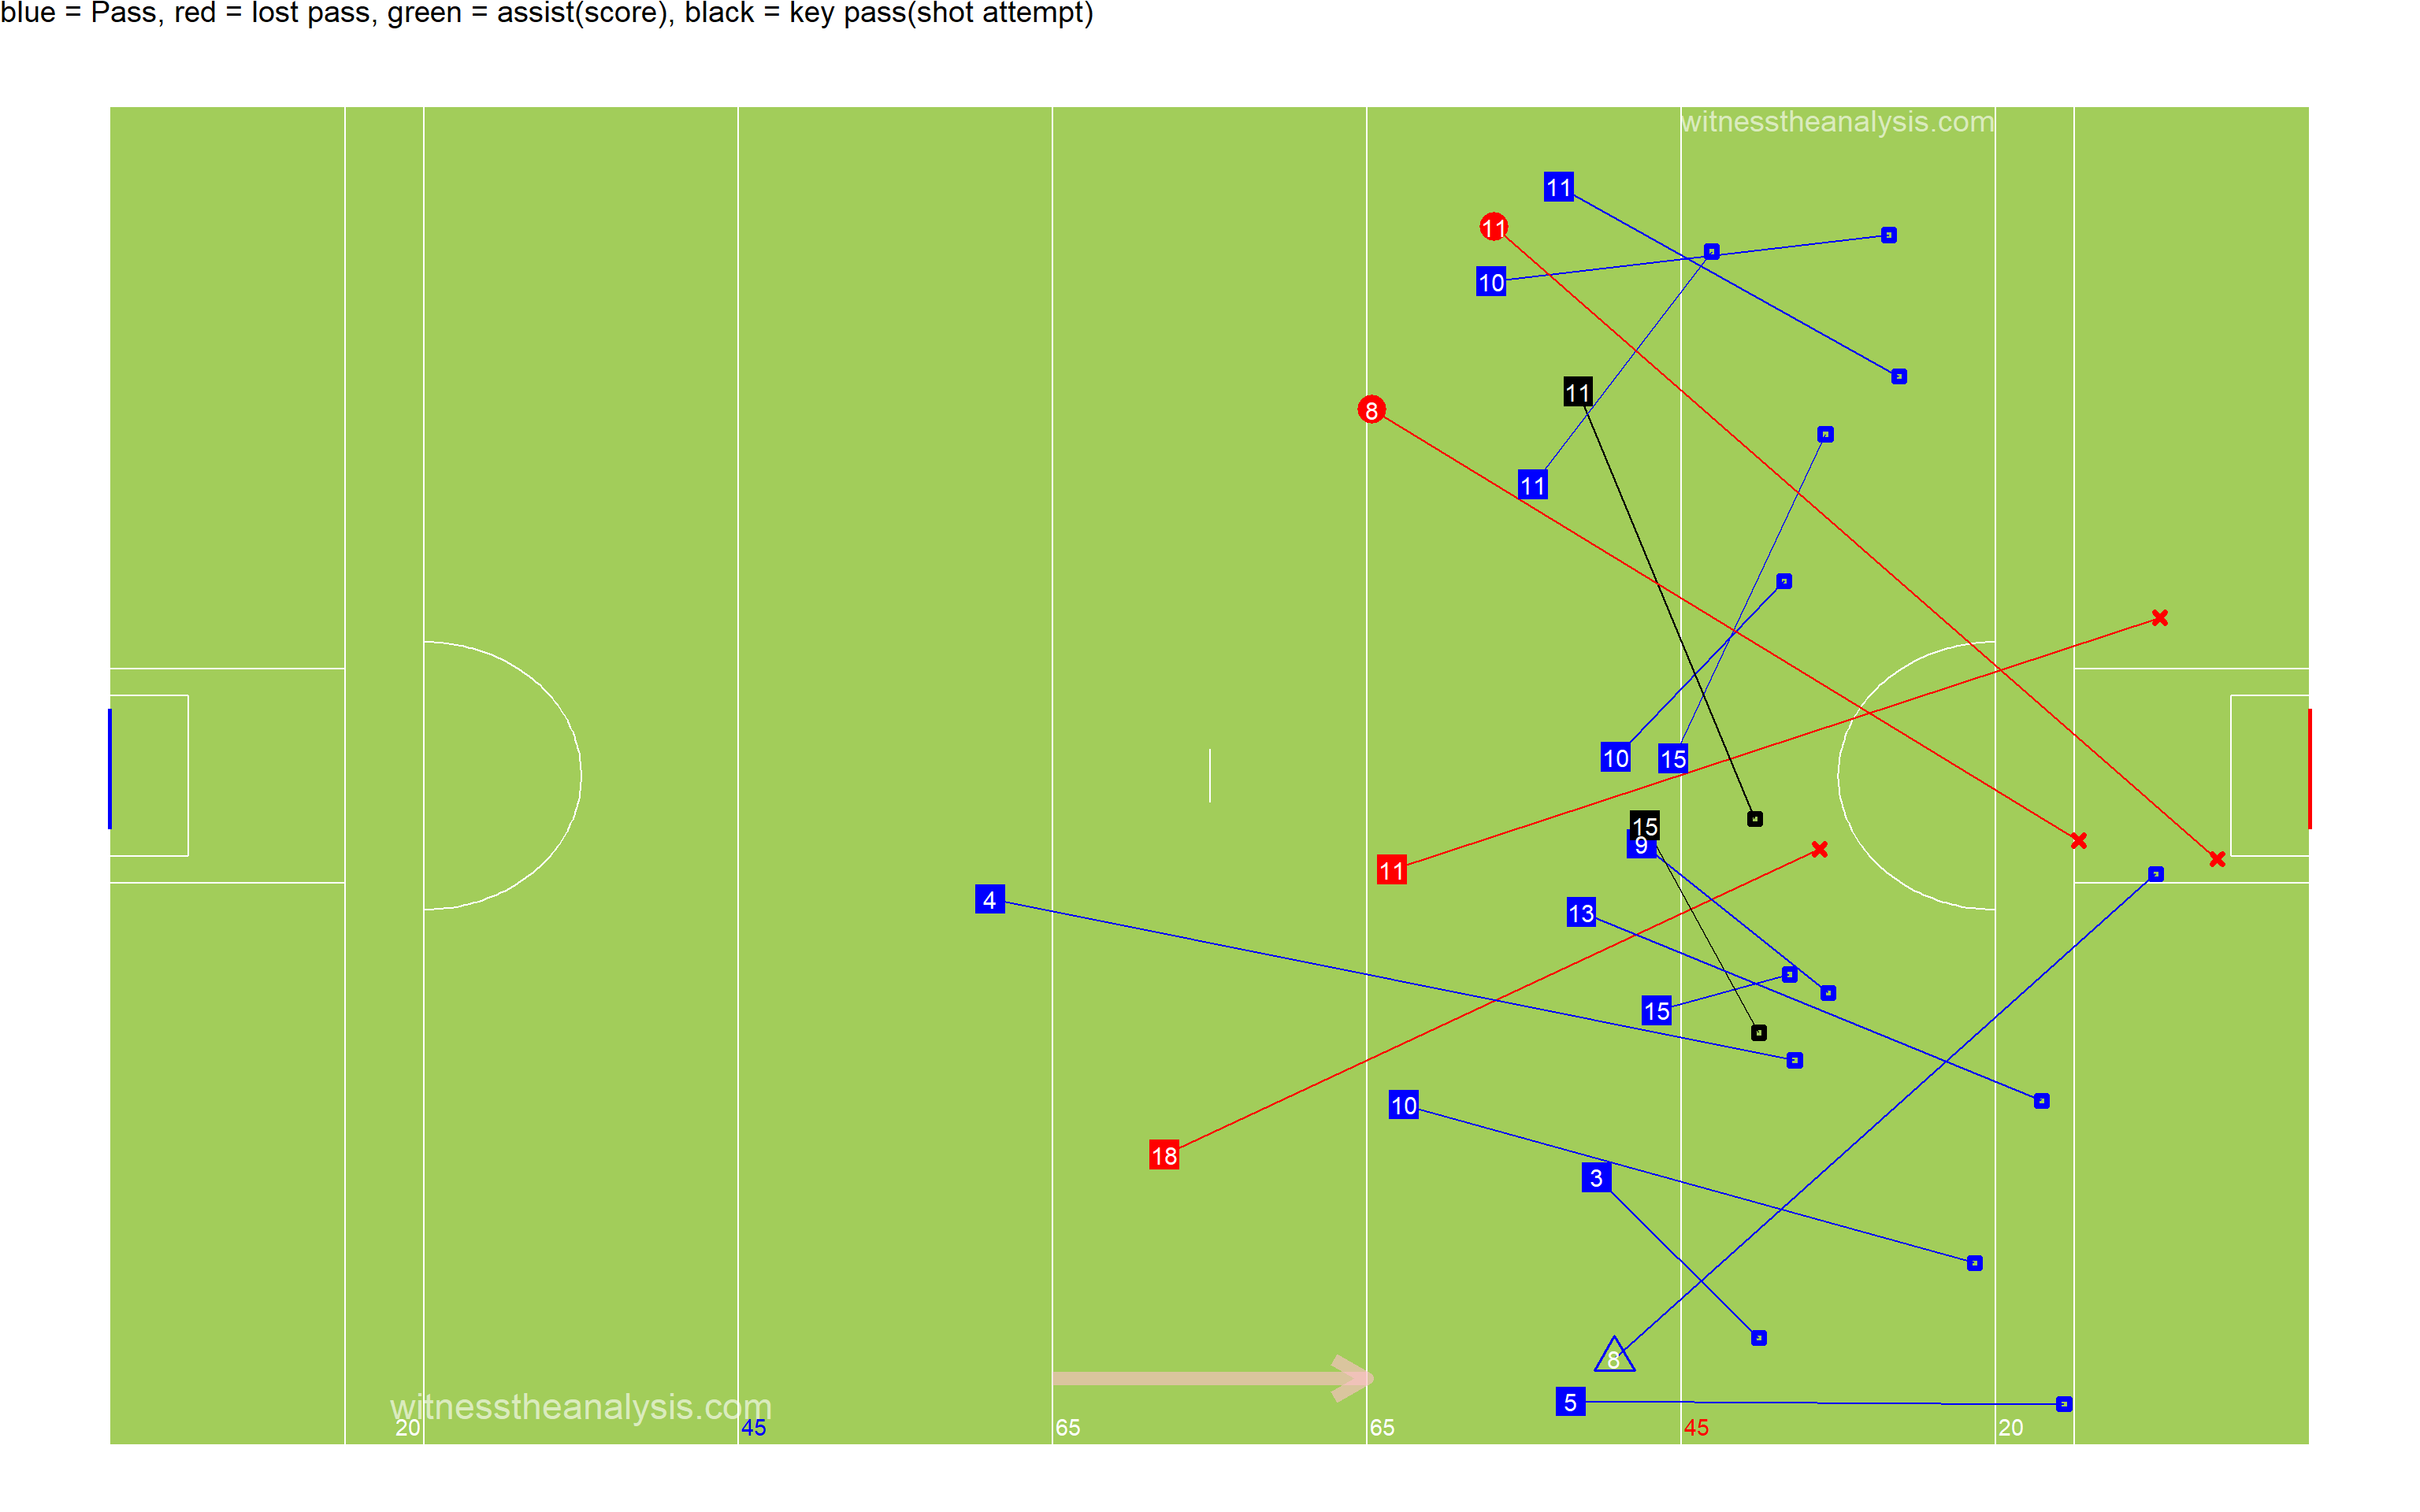
##Passes into 45 ###Thomas Davis
###Ballyboden
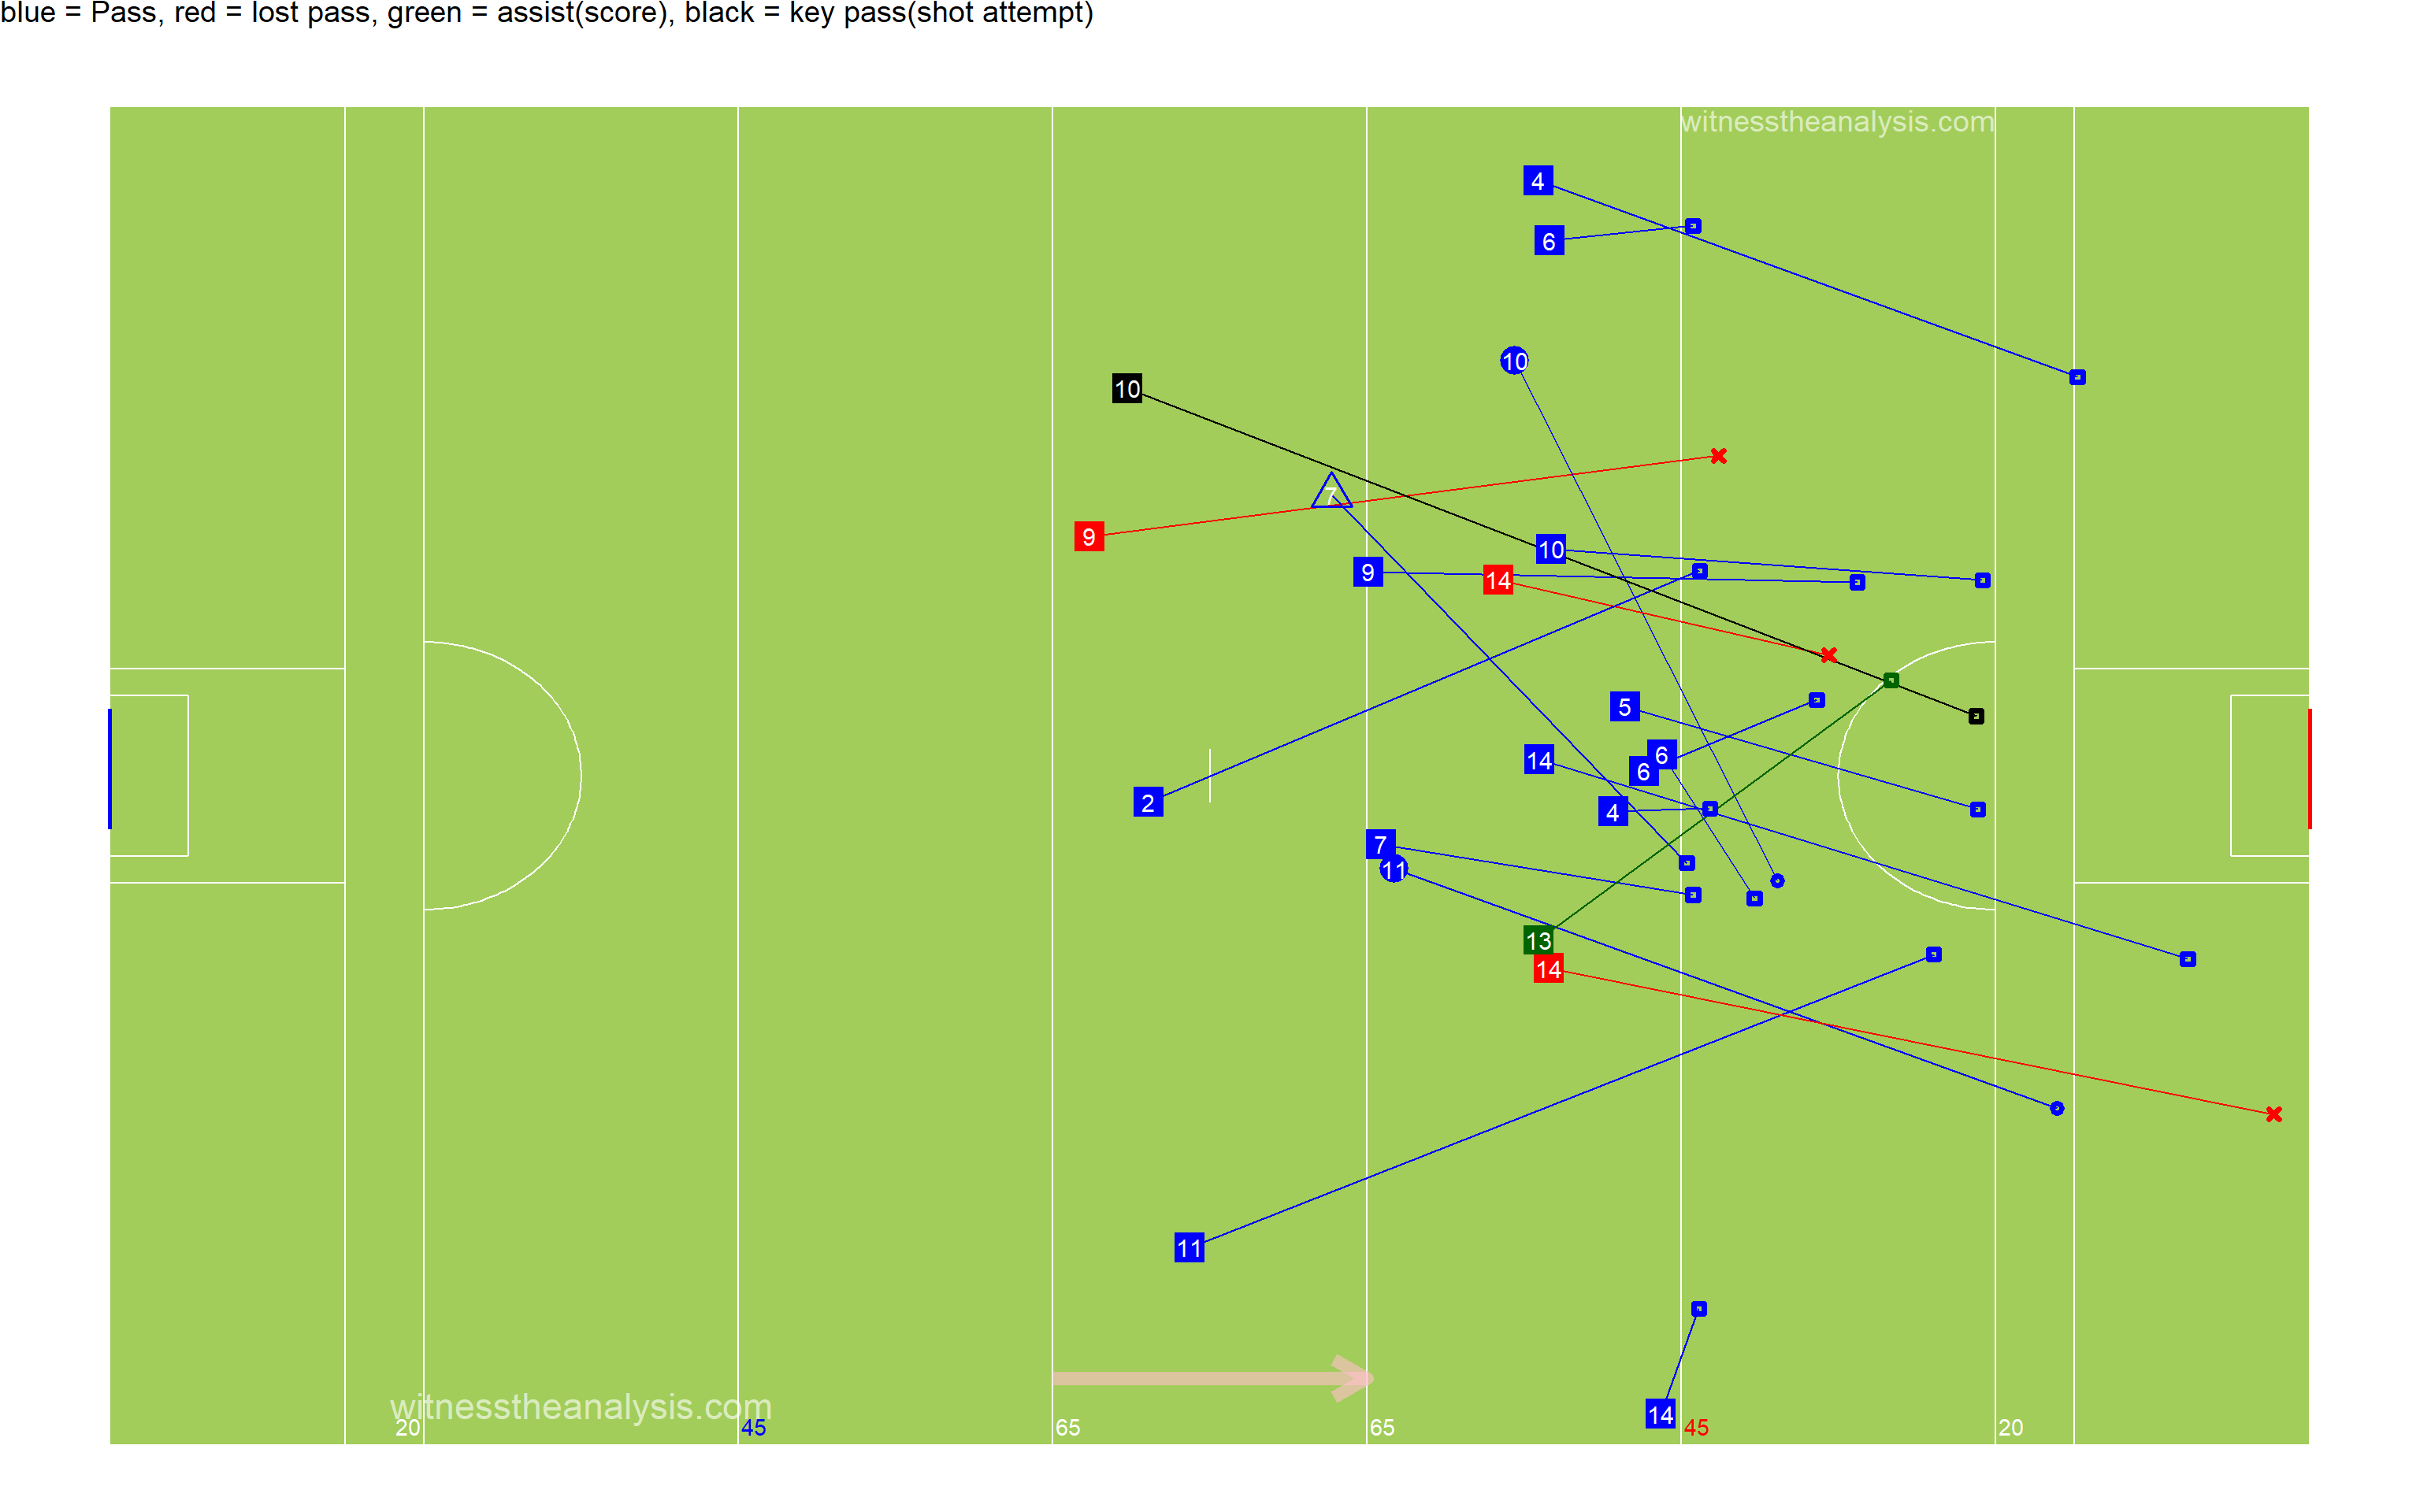
##Passes Inside Opp 65 ###Thomas Davis
###Ballyboden
##Pass Network ###Thomas Davis
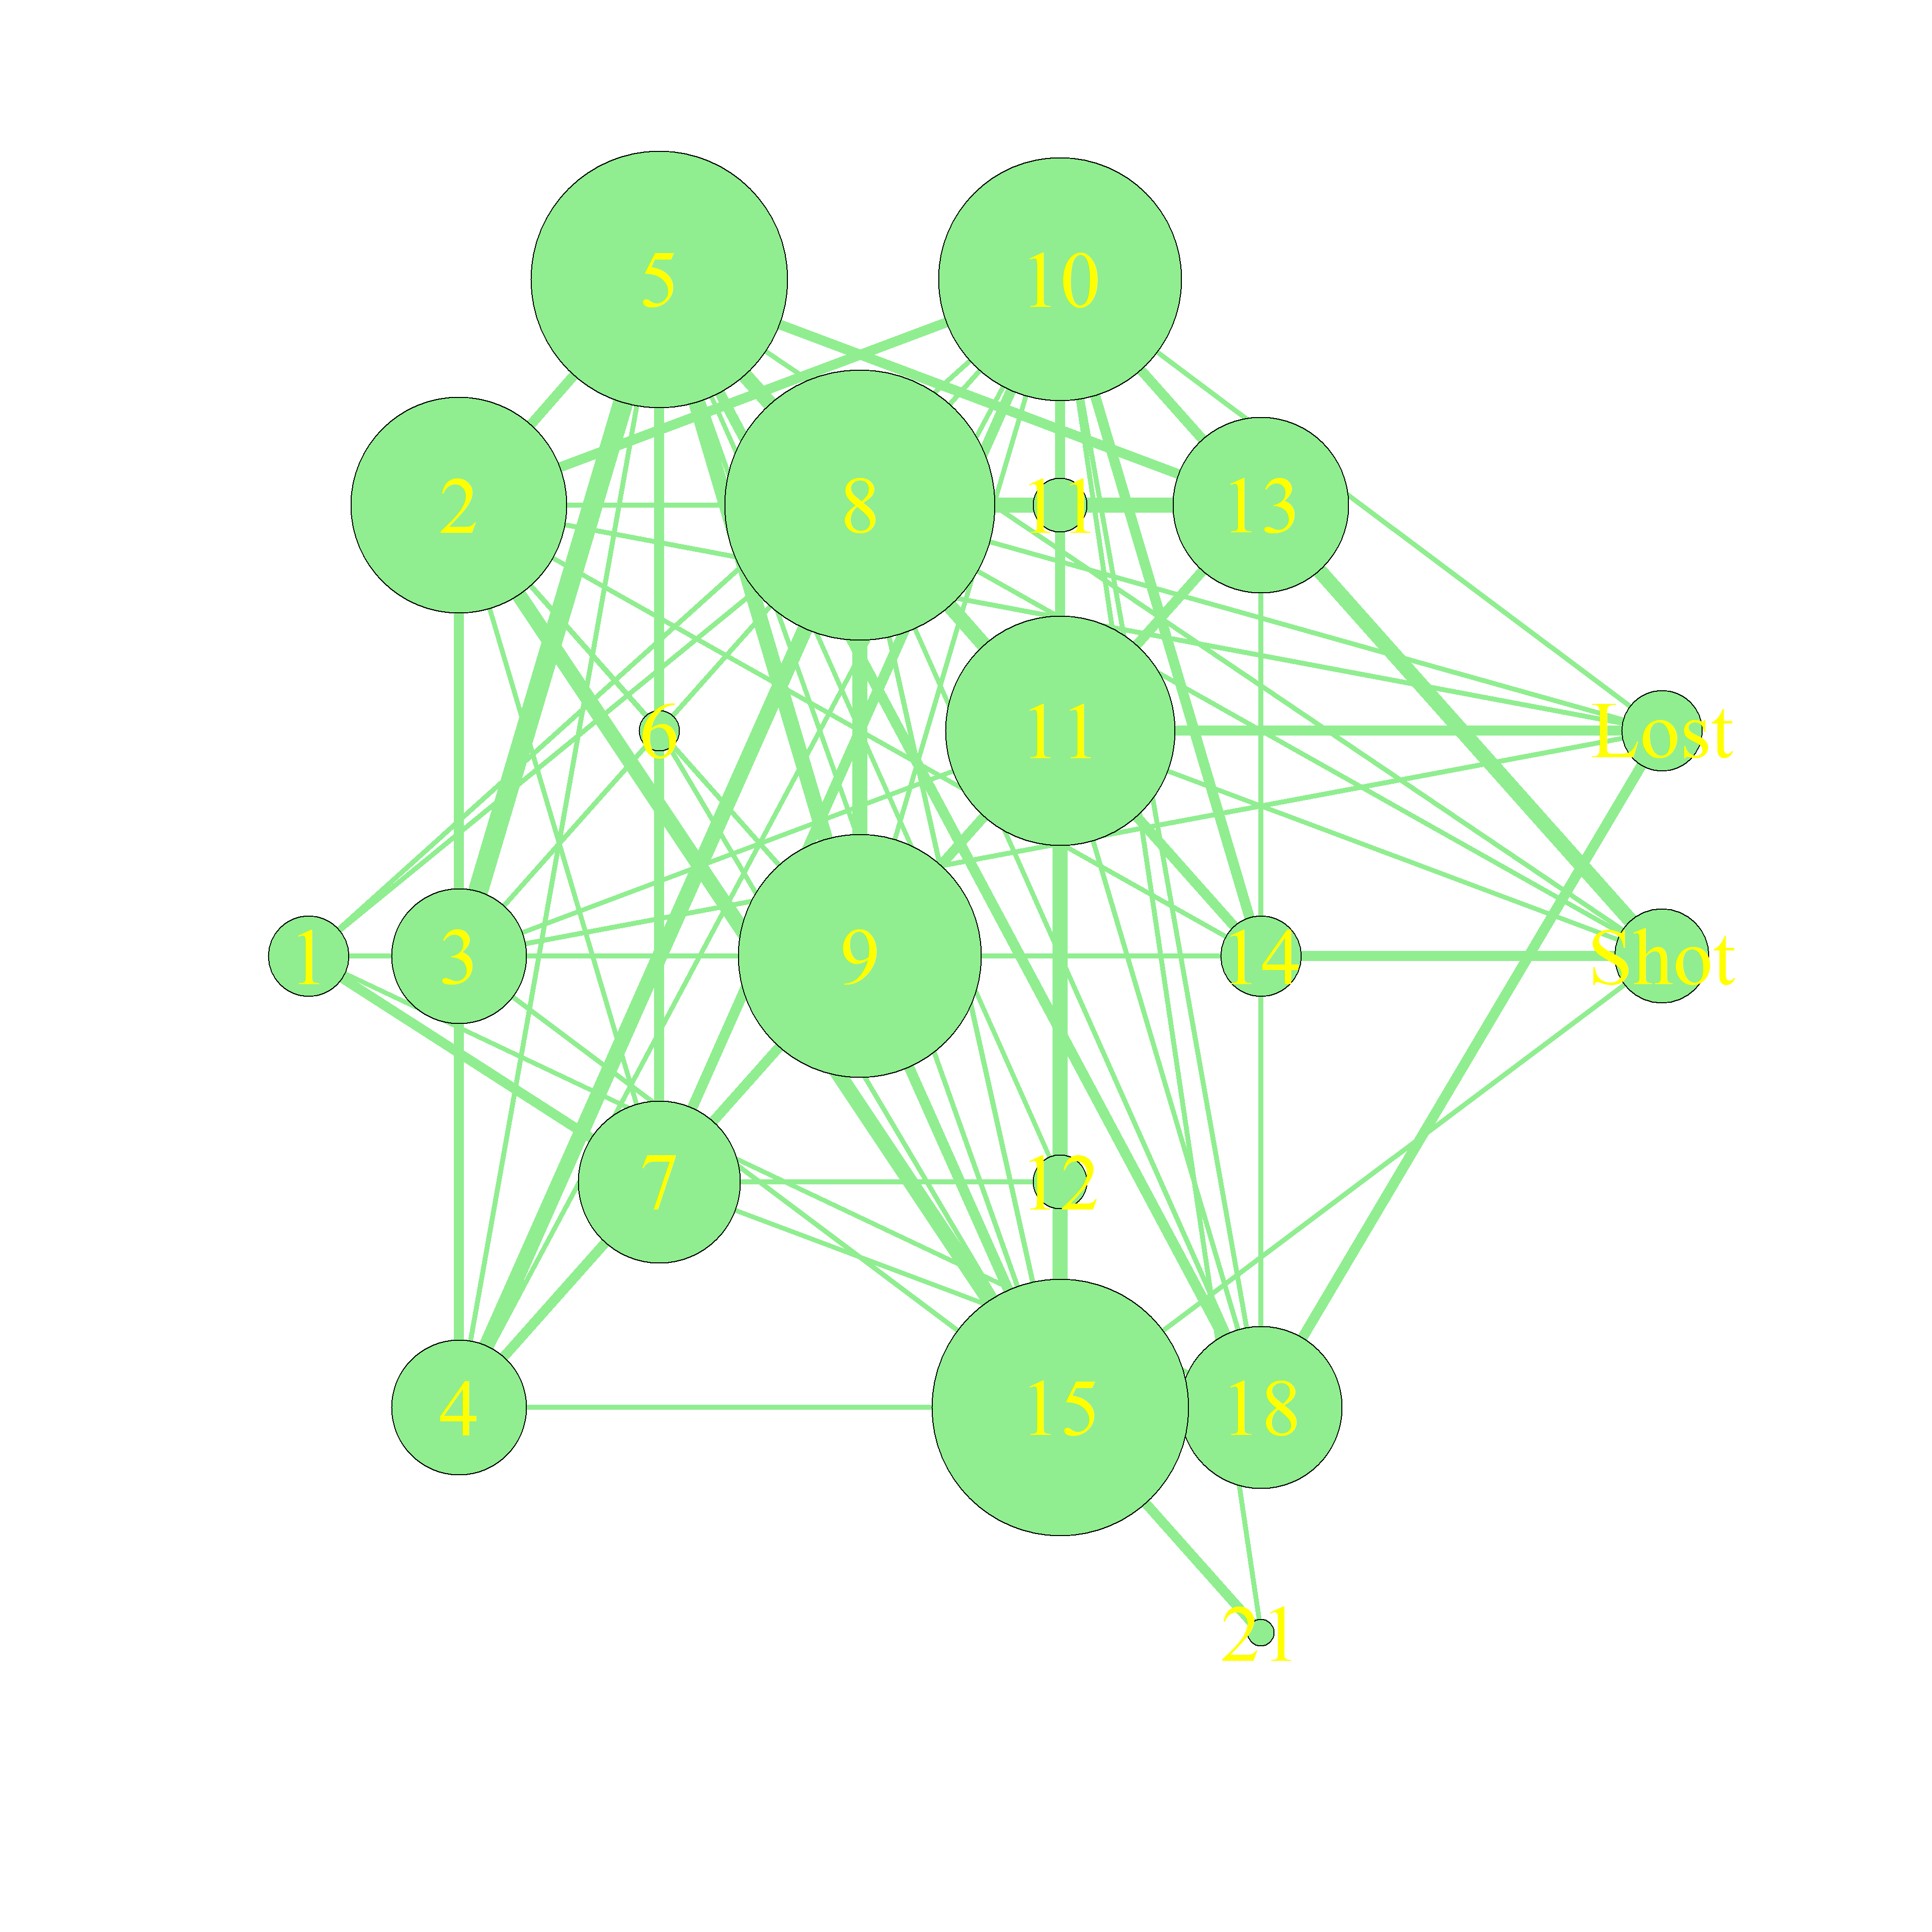
###In Degree (Number of Players a Player Received a Pass from)
##    Fallon Bre Kirby   McGrath  O Toole    Kennedy   E Kirby    Deegan     Keogh      Shot    Murphy      Lost Bri Kirby   Shorten   Lambert  Farrelly    Crilly     Kelly
##         9         9         9         9         8         8         8         7         7         6         6         5         5         4         3         2         2
##     Nolan     Quinn   Reilly
##         2         1         1
###Out Degree (Number of Players a Player Made a Pass to)
##   E Kirby    Fallon  O Toole  Bre Kirby   McGrath    Deegan   Kennedy   Lambert   Shorten     Keogh Bri Kirby    Crilly    Murphy  Farrelly     Quinn     Kelly     Nolan
##        12        10        10         9         9         9         8         8         7         6         5         4         4         3         2         2         2
##   Reilly       Lost      Shot
##         1         0         0
###Strength in (Number of Passes Received by a Player)
##    Fallon   E Kirby  O Toole  Bre Kirby   McGrath    Deegan     Keogh      Shot   Kennedy      Lost    Murphy   Shorten Bri Kirby  Farrelly   Lambert    Crilly     Kelly
##        14        14        13        11        11        11        11        11        10         8         7         7         6         6         5         2         2
##   Reilly      Nolan     Quinn
##         2         2         1
###Strength Out (Number of Passes/Shots Made by a Player)
##    Fallon   E Kirby    Deegan Bre Kirby  O Toole    McGrath   Kennedy   Shorten   Lambert Bri Kirby     Keogh    Murphy    Crilly  Farrelly     Quinn     Kelly     Nolan
##        17        17        14        13        13        12        11         9         9         8         8         7         5         4         2         2         2
##   Reilly       Lost      Shot
##         1         0         0
###Betweenness Centrality (Flow of Passes through a Player)
##      McGrath     O Toole       Kennedy      E Kirby       Deegan    Bre Kirby       Fallon      Shorten        Keogh      Lambert    Bri Kirby       Murphy         Shot
## 0.1294811905 0.1124019985 0.0795207556 0.0592868936 0.0510289990 0.0507049562 0.0463445268 0.0328991084 0.0288758691 0.0156805875 0.0119196131 0.0031352358 0.0026600940
##       Crilly     Farrelly         Lost        Nolan        Kelly        Quinn      Reilly
## 0.0026373122 0.0017325511 0.0013844586 0.0011432089 0.0007415883 0.0000000000 0.0000000000
###Closeness Centrality (How Well connected and central a Player is within the Teams Network)
##   McGrath   E Kirby    Deegan  O Toole    Kennedy    Fallon Bre Kirby Bri Kirby   Shorten     Keogh   Lambert    Murphy      Shot  Farrelly      Lost    Crilly     Kelly
## 0.8636364 0.7916667 0.7600000 0.7600000 0.7307692 0.7307692 0.7307692 0.6551724 0.6551724 0.6551724 0.6551724 0.6333333 0.6129032 0.5937500 0.5937500 0.5428571 0.5277778
##   Reilly      Quinn     Nolan
## 0.5277778 0.5135135 0.5135135
###Entropy (The Unpredictability in who a Player Passes to/Takes shot)
##   Reilly  Bri Kirby      Shot   E Kirby     Keogh    Fallon    Murphy Bre Kirby    Deegan  O Toole       Lost   Kennedy    Crilly  Farrelly   Shorten   McGrath   Lambert
## 0.9182958 0.9311066 0.9487695 0.9539175 0.9558017 0.9573573 0.9578792 0.9645390 0.9647709 0.9660970 0.9671320 0.9700450 0.9755038 0.9756150 0.9763003 0.9805403 0.9823368
##     Quinn     Kelly     Nolan
## 1.0000000 1.0000000 1.0000000
###Global clustering coefficient (Groups of Players who pass to each other)
## [1] 0.5659679###eigen_centrality (How well connected the well connected are)
##    Fallon   E Kirby Bre Kirby  O Toole     Deegan   Kennedy     Keogh   McGrath    Murphy Bri Kirby   Lambert   Shorten      Shot  Farrelly      Lost    Crilly     Kelly
## 1.0000000 0.9961407 0.8462285 0.8036087 0.7733909 0.6461521 0.6388974 0.5977445 0.5539191 0.5447248 0.4779200 0.4613589 0.3608959 0.3404421 0.2590472 0.1960036 0.1387737
##     Nolan     Quinn   Reilly
## 0.1339878 0.1124885 0.1080287
##Ballyboden 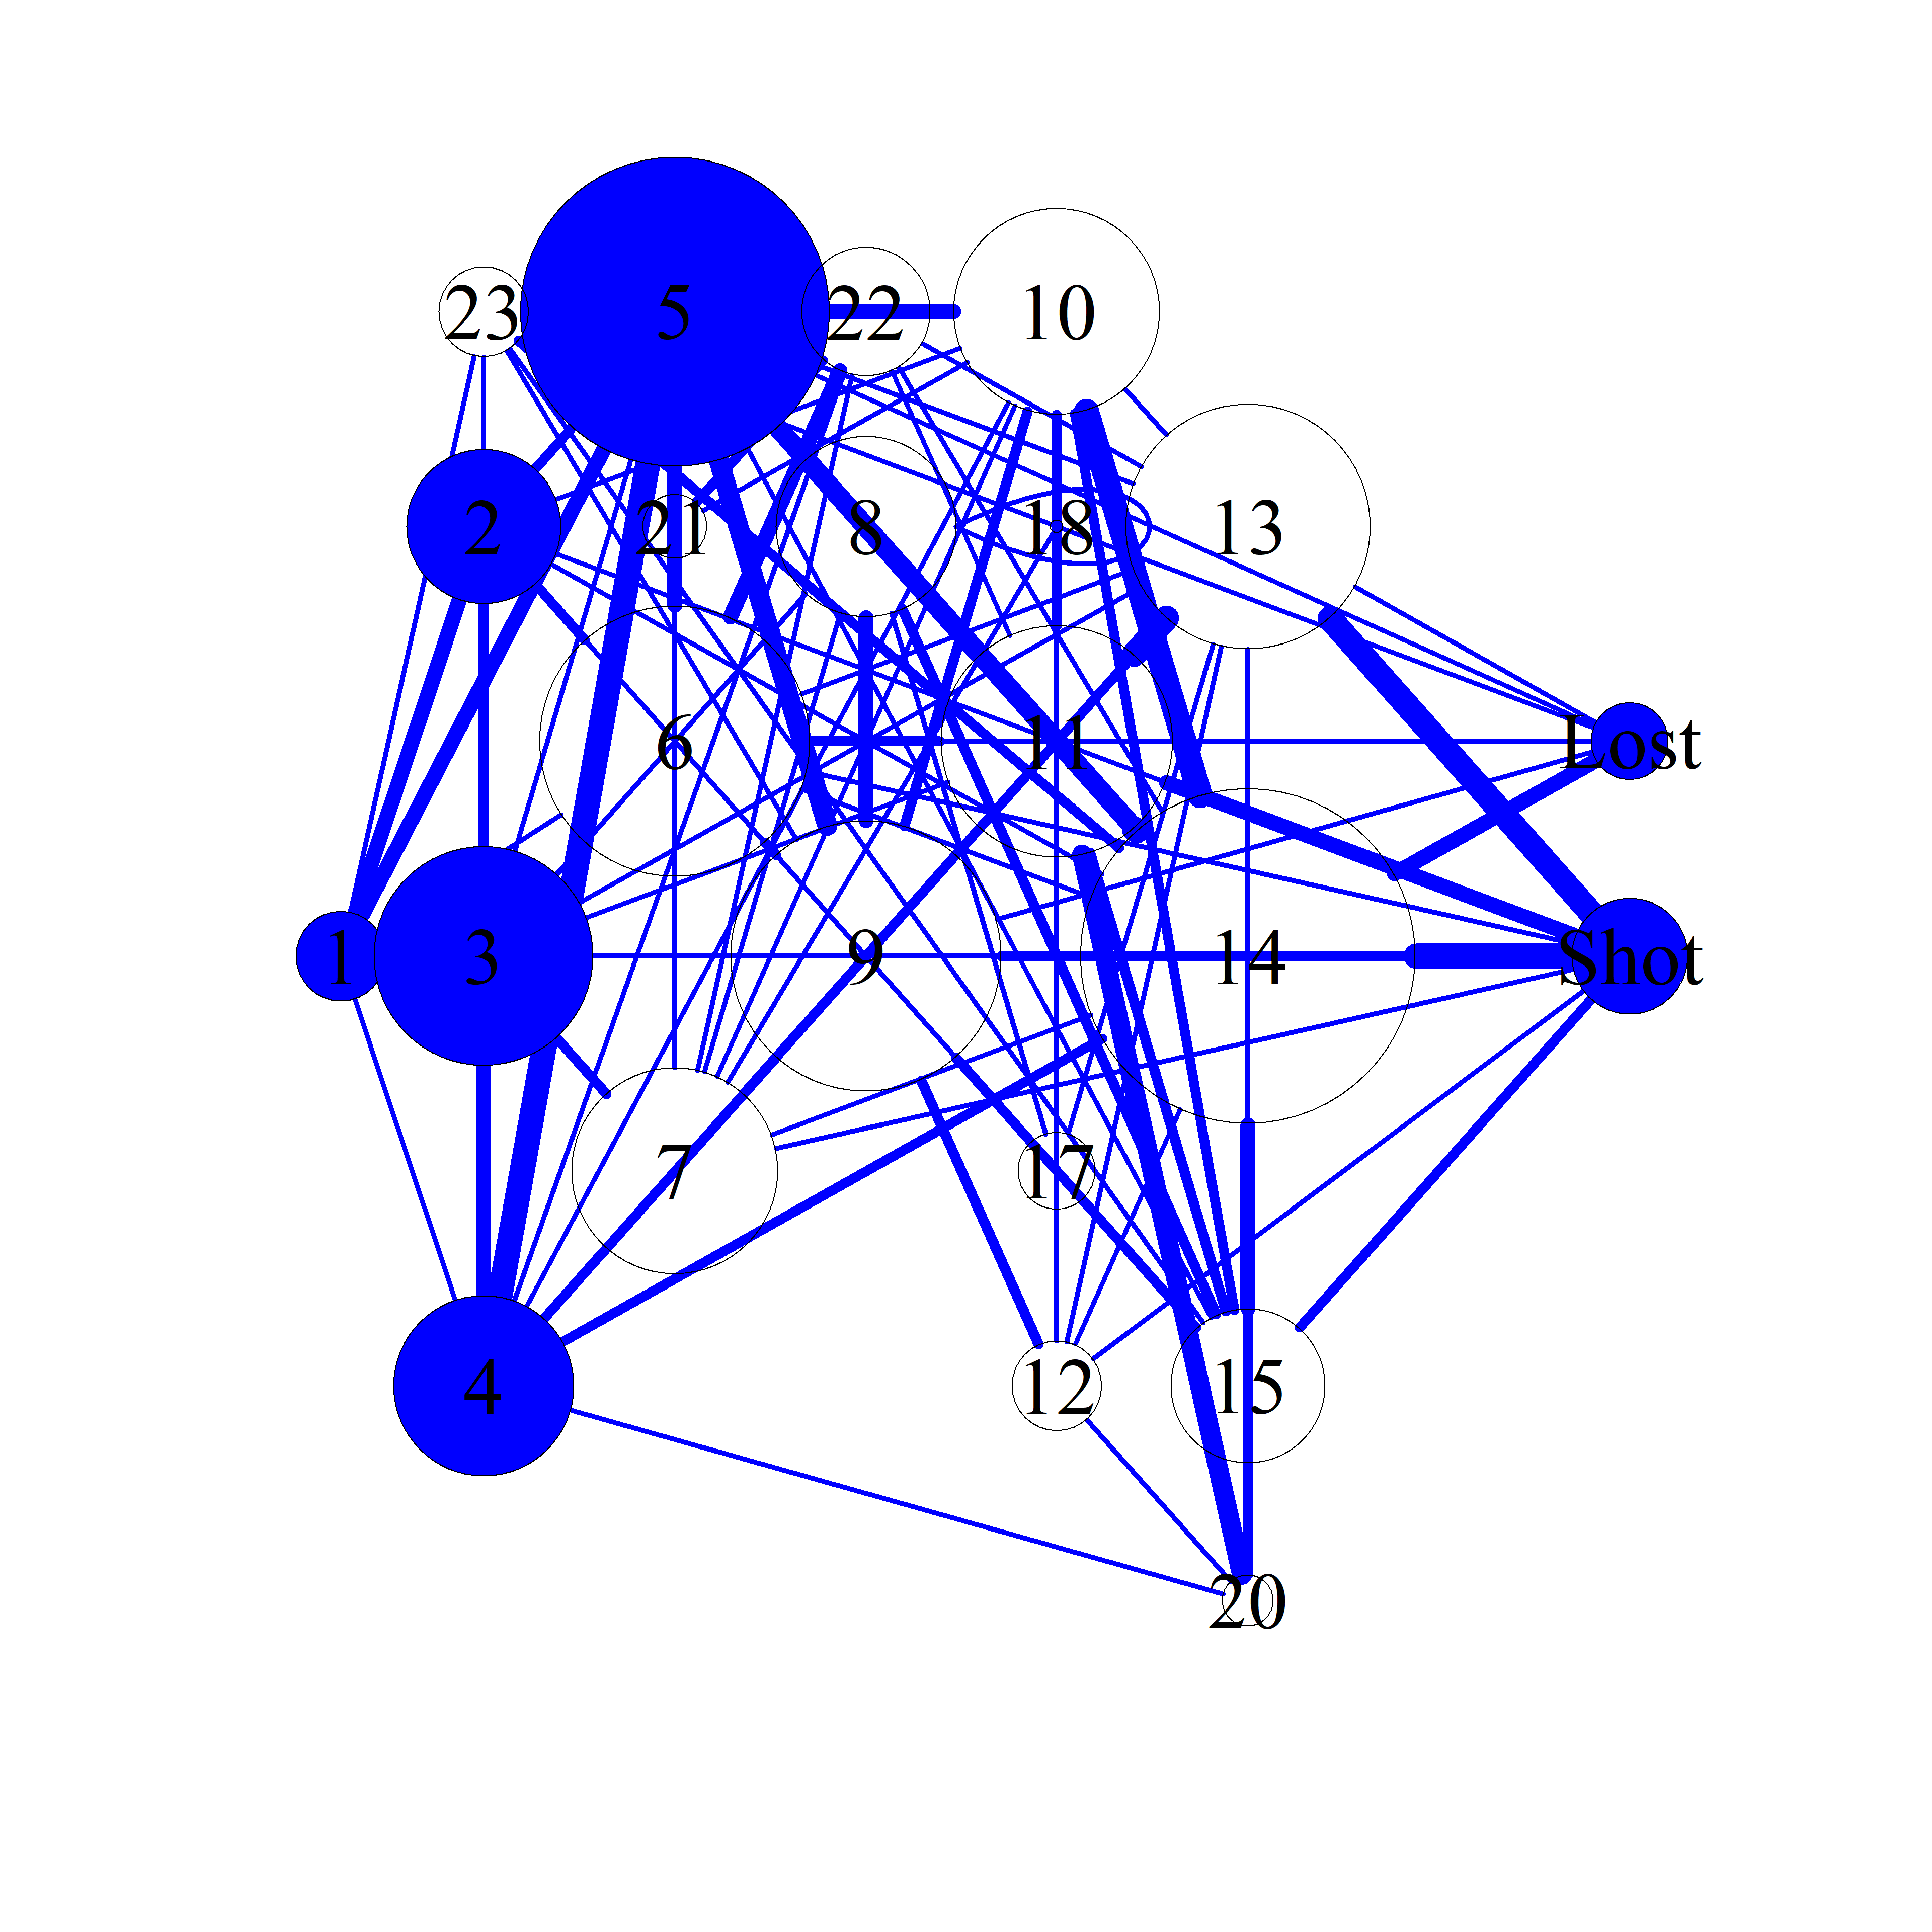
###In Degree (Number of Players a Player Received a Pass from)
## R Basquel      Nelson     McDaid  O Mahony  C Basquel     Clayton    McGarry       Shot   Macauley   O Reilly     Waters       Dwan       Egan       Lost   Flaherty
##         14         10         10         10         10          9          9          9          8          8          7          6          6          6          4
##      Gogan    Gibbons      Flood     Hayes     Bobbett   Kennedy    Holland      Keaney
##          3          3          3          3          3          3          2          0
###Out Degree (Number of Players a Player Made a Pass to)
##     Nelson R Basquel      McDaid  O Mahony    Flaherty    McGarry     Waters    Clayton   O Reilly C Basquel     Bobbett       Dwan   Macauley       Egan      Gogan
##         14         12         11         11         10         10          9          8          8          8          7          6          6          6          4
##      Flood   Kennedy     Gibbons   Holland      Hayes      Keaney       Lost       Shot
##          4          4          3          3          1          1          0          0
###Strength in (Number of Passes Received by a Player)
## R Basquel      Nelson C Basquel        Shot  O Mahony     McGarry     McDaid   O Reilly    Clayton   Macauley       Egan       Dwan   Flaherty     Waters       Lost
##         27         22         21         21         17         14         13         13         11          9          9          8          8          8          8
##      Gogan    Bobbett      Flood     Hayes    Kennedy     Gibbons   Holland      Keaney
##          5          5          4          4          4          3          3          0
###Strength Out (Number of Passes/Shots Made by a Player)
## R Basquel      Nelson C Basquel   O Mahony      McDaid   O Reilly   Flaherty    McGarry    Clayton     Waters       Dwan       Egan   Macauley    Bobbett      Gogan
##         27         25         20         19         16         16         15         15         11         11         10         10          8          8          7
##      Flood     Hayes    Kennedy     Gibbons   Holland      Keaney       Lost       Shot
##          4          4          4          3          3          1          0          0
###Betweenness Centrality (Flow of Passes through a Player)
##       Waters   R Basquel        McDaid      McGarry       Nelson    O Mahony      O Reilly   C Basquel      Flaherty      Clayton     Macauley         Dwan      Bobbett
## 0.1154694345 0.1060384741 0.0839608087 0.0549079498 0.0527548021 0.0502661401 0.0404513729 0.0372208539 0.0333006687 0.0307281550 0.0129003572 0.0114483225 0.0098949415
##         Egan     Kennedy          Shot        Flood        Gogan         Lost       Hayes       Gibbons     Holland        Keaney
## 0.0084125110 0.0073466495 0.0072870248 0.0057078479 0.0028623571 0.0020975057 0.0014995305 0.0005411255 0.0002278423 0.0000000000
###Closeness Centrality (How Well connected and central a Player is within the Teams Network)
## R Basquel   O Mahony      Nelson     McDaid    McGarry    Clayton     Waters   O Reilly C Basquel    Flaherty   Macauley    Bobbett       Shot       Dwan       Egan
##  0.8461538  0.7857143  0.7586207  0.7586207  0.7586207  0.6875000  0.6875000  0.6875000  0.6875000  0.6470588  0.6285714  0.6285714  0.6285714  0.6111111  0.6111111
##       Lost      Gogan      Flood   Kennedy     Gibbons     Hayes    Holland      Keaney
##  0.5641026  0.5500000  0.5500000  0.5500000  0.5238095  0.5238095  0.5238095  0.4150943
###Entropy (The Unpredictability in who a Player Passes to/Takes shot)
##     Hayes        Shot    McGarry       Lost   Flaherty      Gogan R Basquel  C Basquel      Nelson   O Reilly    Bobbett       Dwan       Egan     McDaid   Macauley
##  0.8750000  0.9053015  0.9226582  0.9306282  0.9327187  0.9353340  0.9412652  0.9412965  0.9429130  0.9462244  0.9575261  0.9655108  0.9683098  0.9685538  0.9692074
##   Holland   O Mahony     Clayton      Flood   Kennedy      Waters    Gibbons
##  0.9697239  0.9698905  0.9714029  0.9795698  0.9795698  0.9830345  1.0000000
###Global clustering coefficient (Groups of Players who pass to each other)
## [1] 0.5883347###eigen_centrality (How well connected the well connected are)
## R Basquel Nelson C Basquel O Reilly O Mahony McGarry McDaid Shot Flaherty Egan Clayton Macauley Dwan Waters Bobbett
## 1.00000000 0.90062363 0.85377269 0.68638522 0.68173968 0.54705175 0.51164063 0.46459776 0.45893282 0.43154256 0.35698116 0.31457515 0.30442167 0.30029390 0.23196691
## Hayes Lost Gogan Flood Kennedy Gibbons Holland Keaney
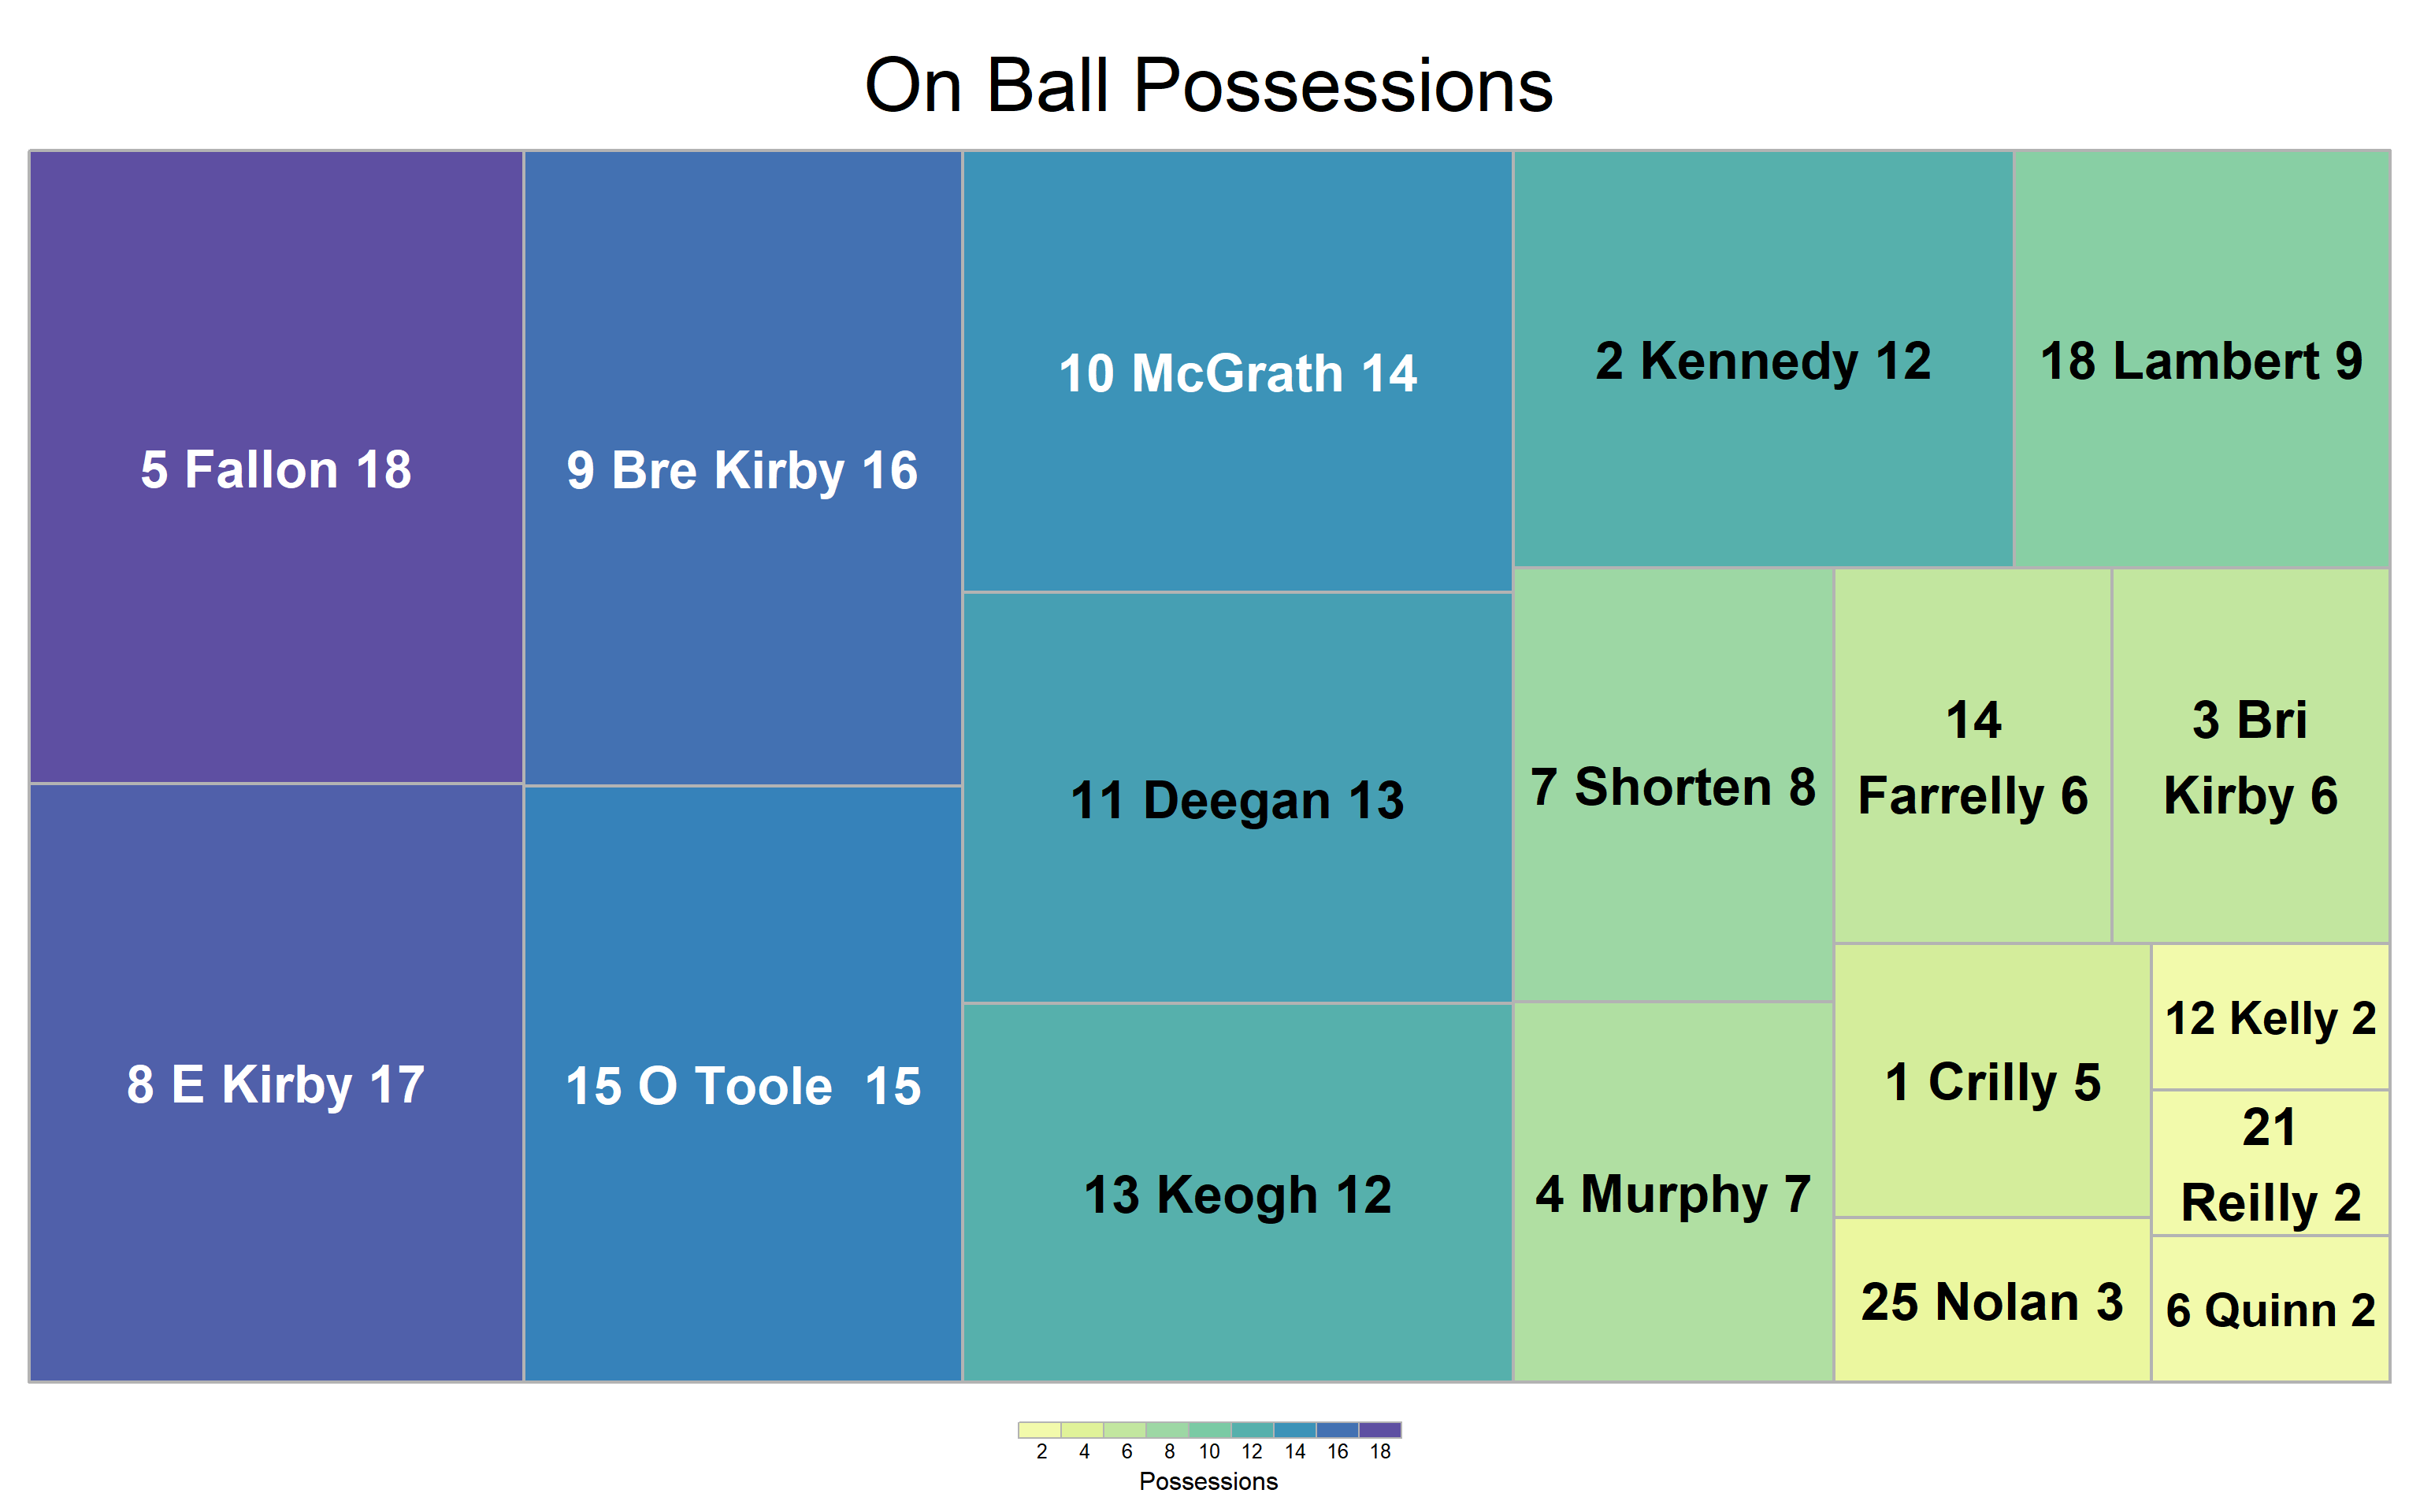
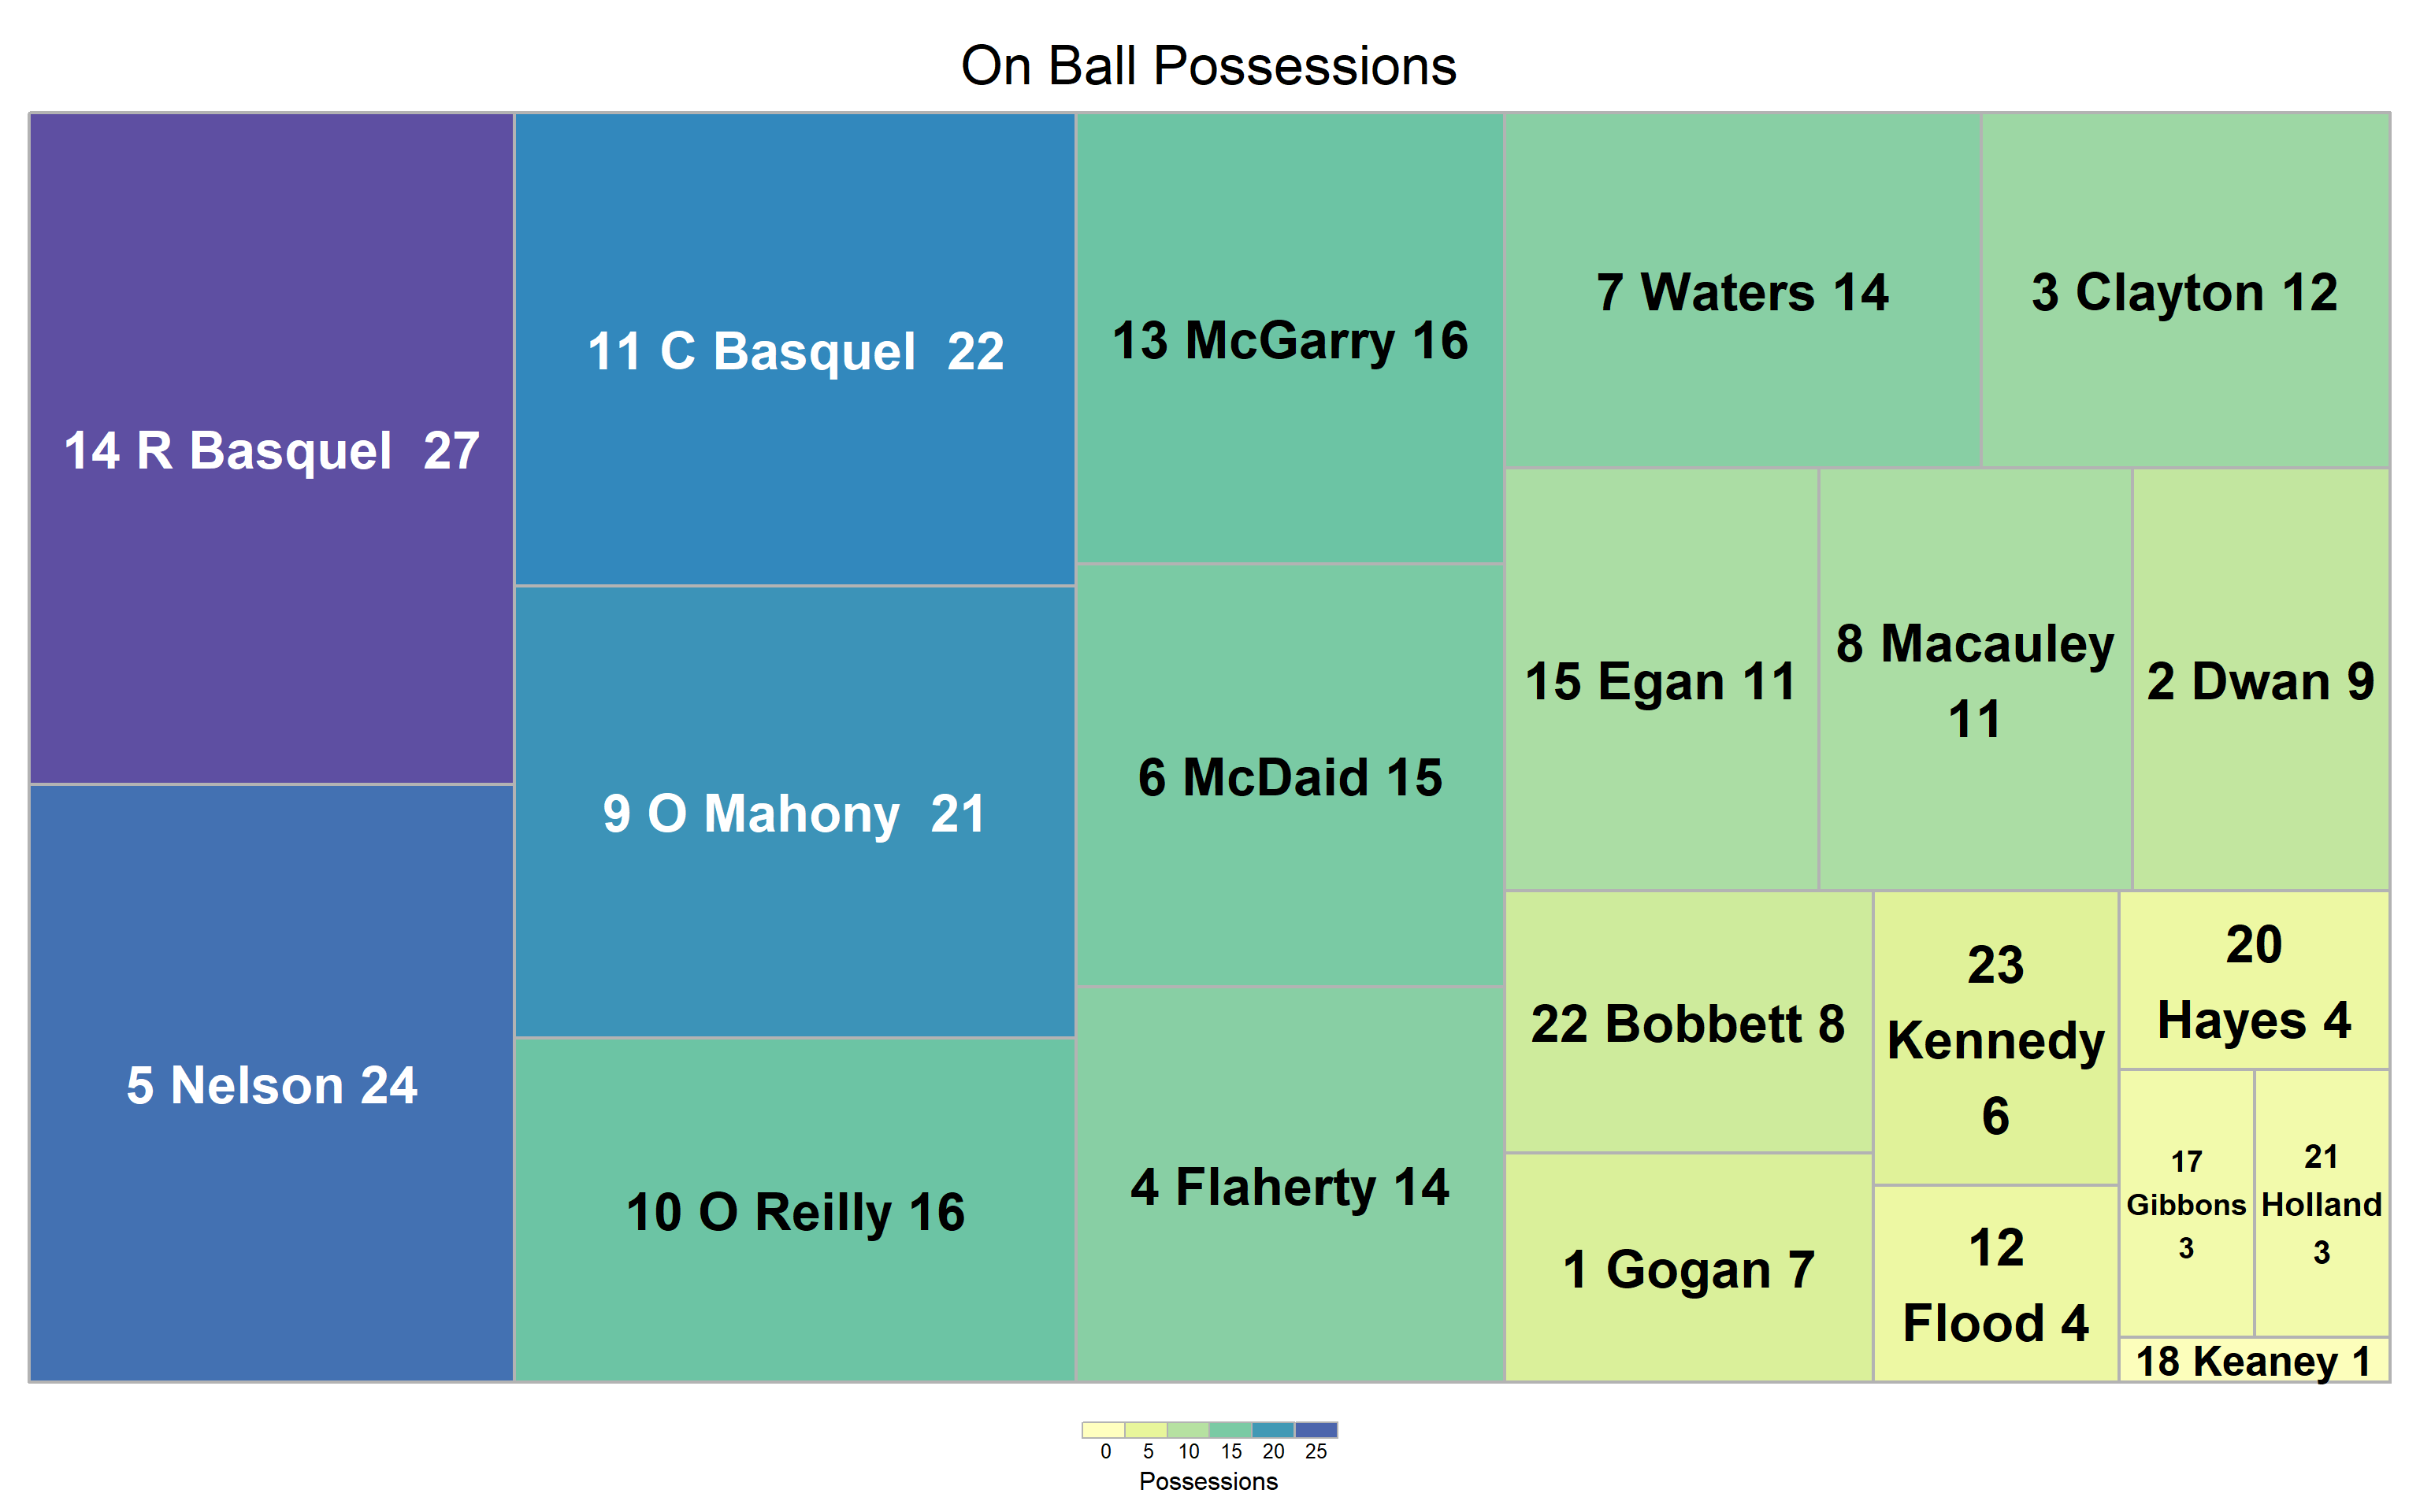
## 0.20327715 0.19471768 0.19170513 0.16661500 0.14522748 0.10274695 0.07613834 0.01010537#Player Stats ##Player On Ball Possession (Number, Player, Total) ###Thomas Davis
###Ballyboden
##Player Possession Involvement ###Thomas Davis 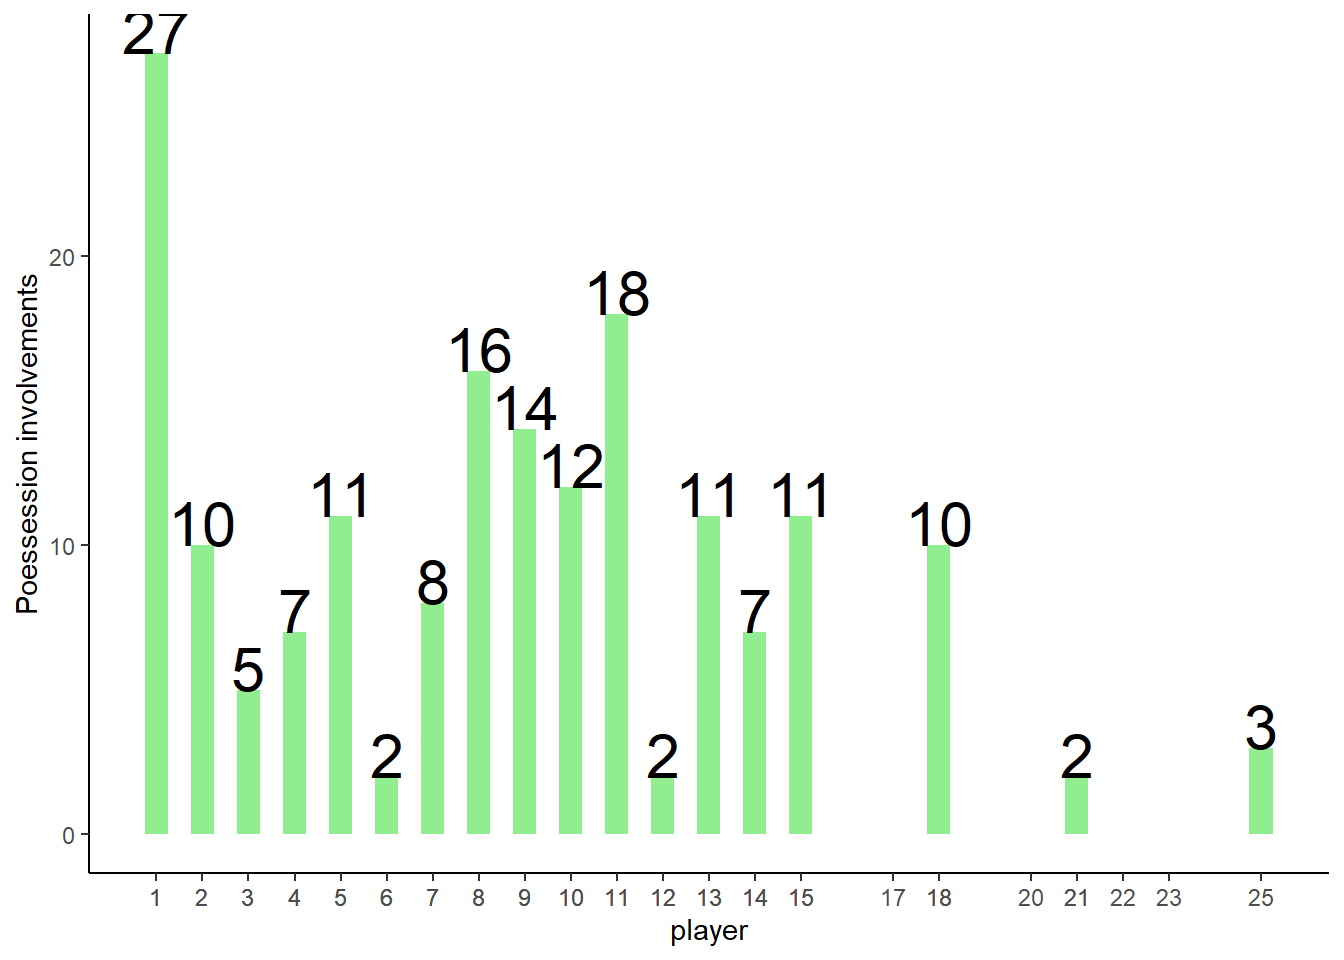
###Ballyboden 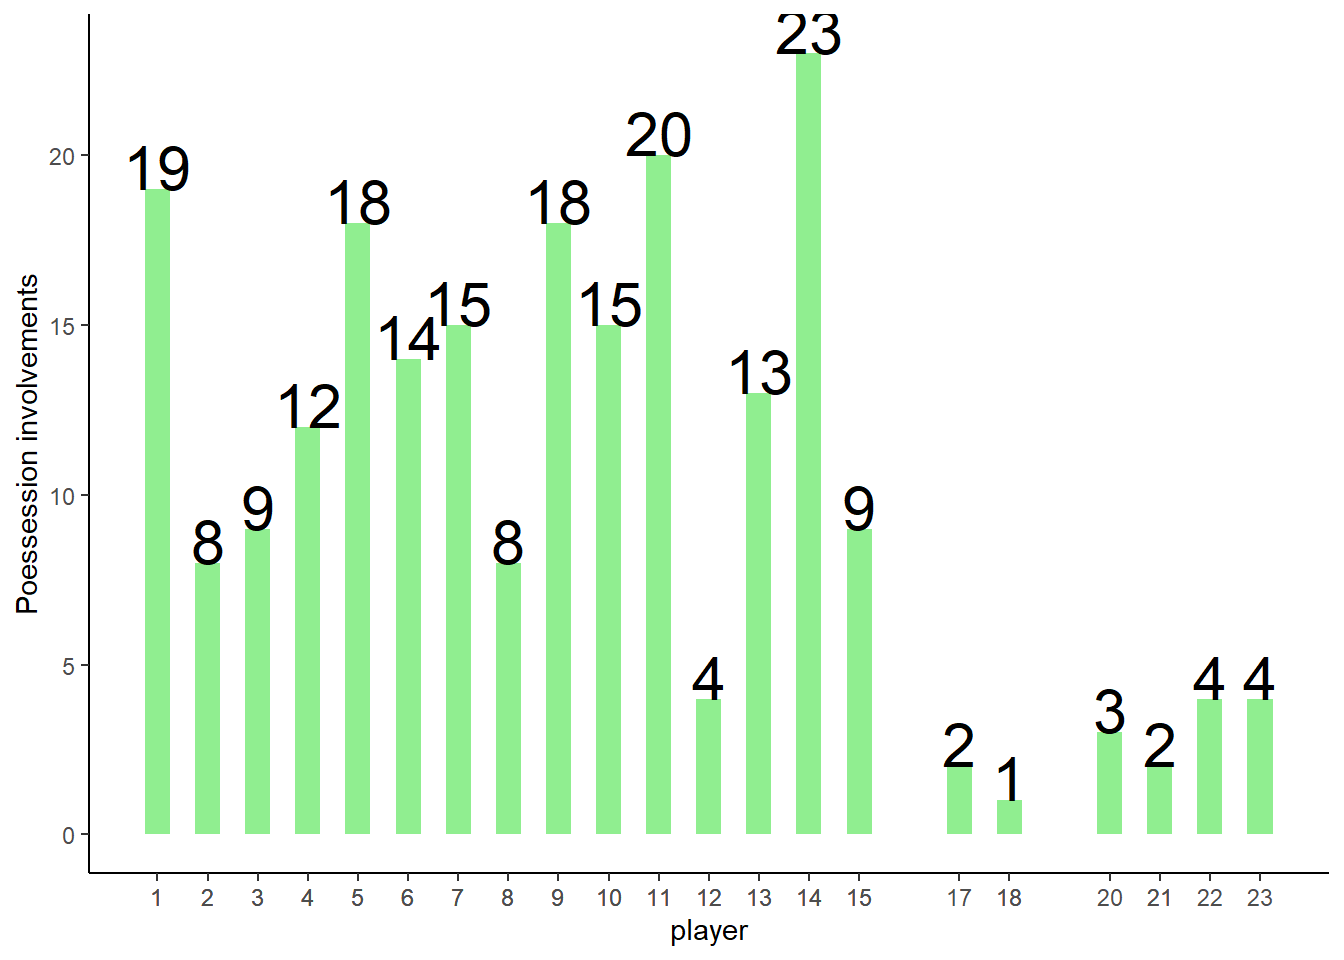
##Player Shot Involvement
###Thomas Davis 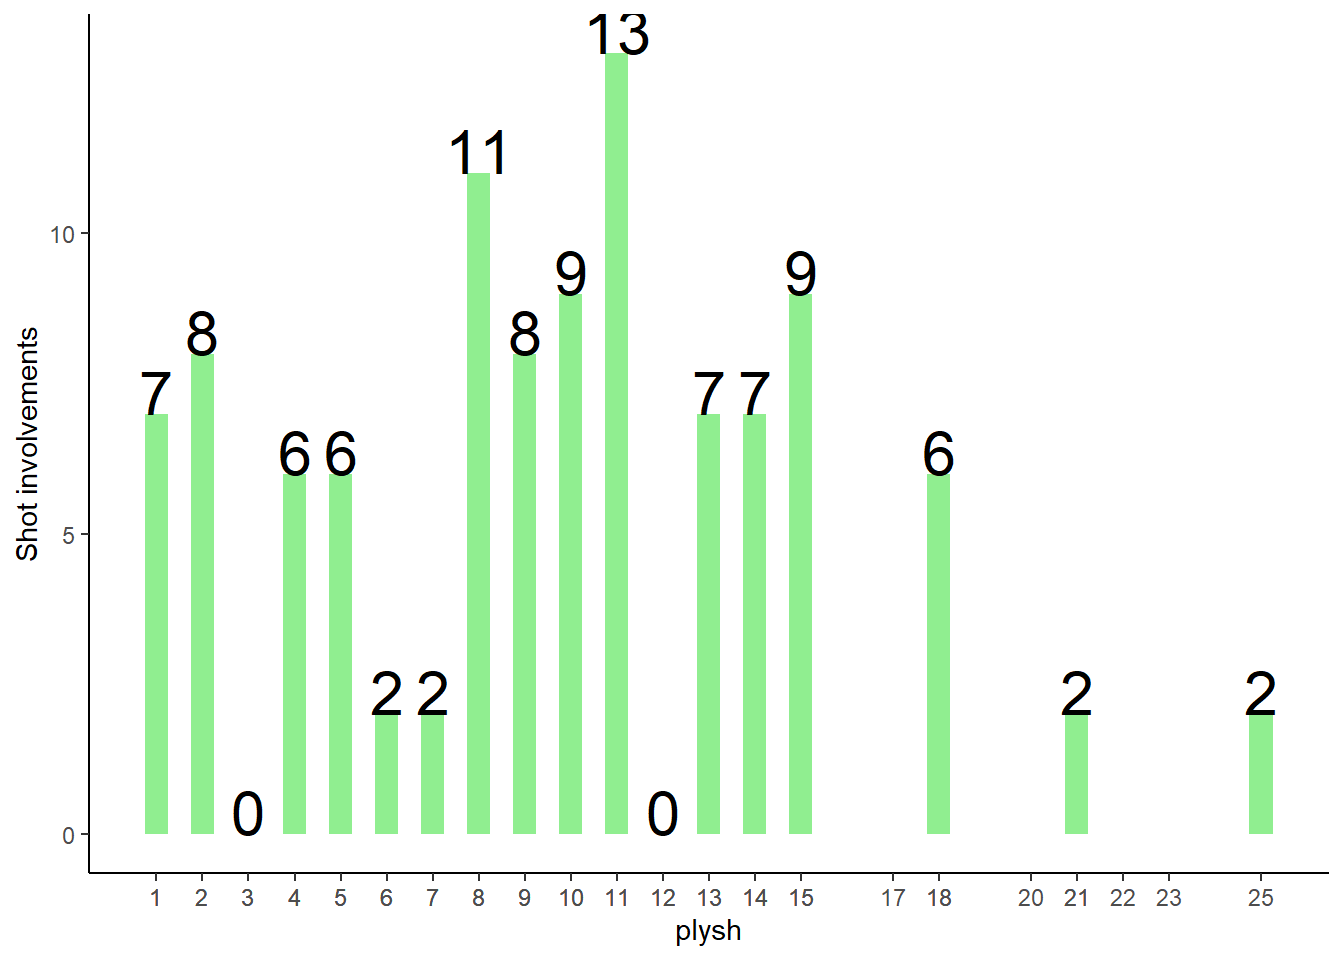
###Ballyboden 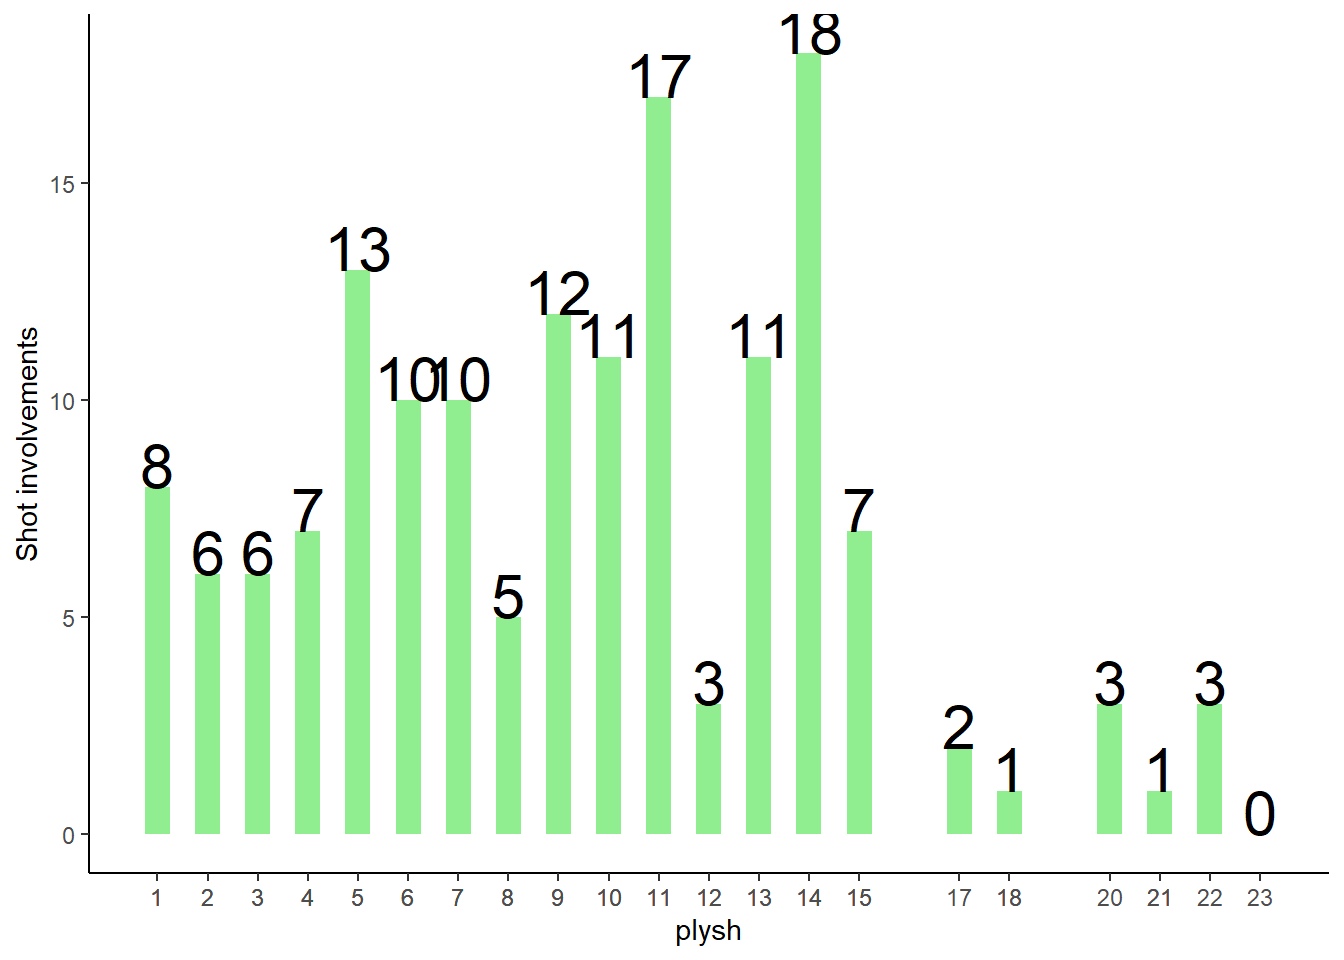
##Player Score Involvement
###Thomas Davis 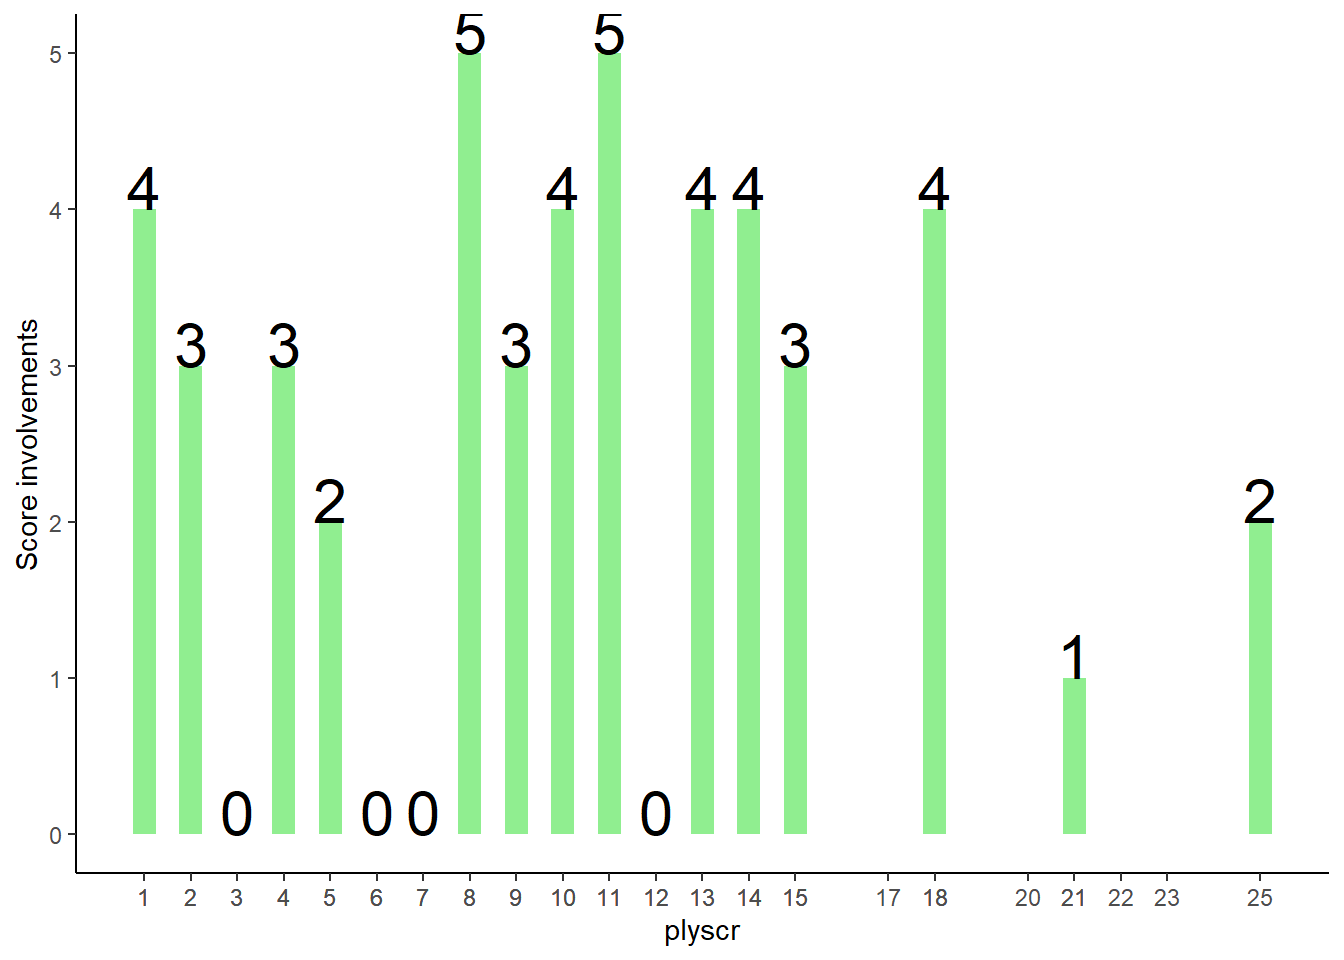
###Ballyboden 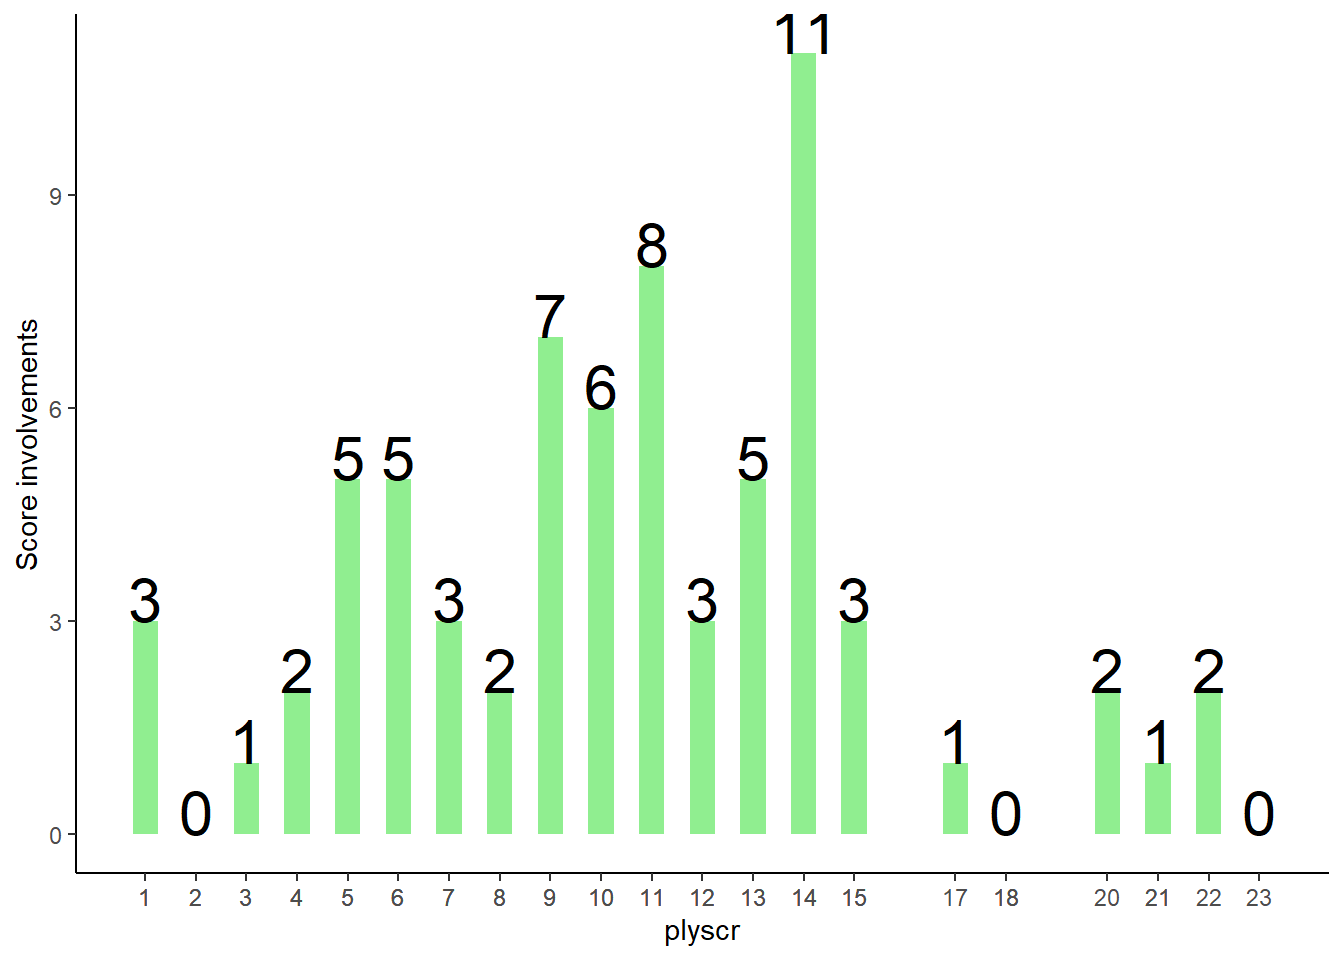
##Posessions Per Playing Time
| Team | ply | opshots | Totteamshot | opscr | Totteamscr | convrate |
|---|---|---|---|---|---|---|
| Thomas Davis | Crilly | 0 | 0% | 0 | 0% |
|
| Thomas Davis | Kennedy | 0 | 0% | 0 | 0% |
|
| Thomas Davis | Bri Kirby | 0 | 0% | 0 | 0% |
|
| Thomas Davis | Murphy | 0 | 0% | 0 | 0% |
|
| Thomas Davis | Fallon | 1 | 9% | 0 | 0% | 0% |
| Thomas Davis | Quinn | 0 | 0% | 0 | 0% |
|
| Thomas Davis | Shorten | 0 | 0% | 0 | 0% |
|
| Thomas Davis | E Kirby | 1 | 9% | 0 | 0% | 0% |
| Thomas Davis | Bre Kirby | 0 | 0% | 0 | 0% |
|
| Thomas Davis | McGrath | 2 | 18% | 1 | 33% | 50% |
| Thomas Davis | Deegan | 1 | 9% | 0 | 0% | 0% |
| Thomas Davis | Kelly | 0 | 0% | 0 | 0% |
|
| Thomas Davis | Keogh | 3 | 27% | 2 | 67% | 67% |
| Thomas Davis | Farrelly | 2 | 18% | 0 | 0% | 0% |
| Thomas Davis | Lambert | 0 | 0% | 0 | 0% |
|
| Thomas Davis | O Toole | 1 | 9% | 1 | 33% | 100% |
| Thomas Davis | Reilly | 0 | 0% | 0 | 0% |
|
| Thomas Davis | Nolan | 0 | 0% | 0 | 0% |
|
| Team | ply | opshots | Totteamshot | opscr | Totteamscr | convrate |
|---|---|---|---|---|---|---|
| Ballyboden | Gogan | 0 | 0% | 0 | 0% |
|
| Ballyboden | Dwan | 1 | 5% | 0 | 0% | 0 |
| Ballyboden | Clayton | 0 | 0% | 0 | 0% |
|
| Ballyboden | Flaherty | 0 | 0% | 0 | 0% |
|
| Ballyboden | Nelson | 0 | 0% | 0 | 0% |
|
| Ballyboden | McDaid | 1 | 5% | 0 | 0% | 0% |
| Ballyboden | Waters | 1 | 5% | 0 | 0% | 0 |
| Ballyboden | Macauley | 0 | 0% | 0 | 0% |
|
| Ballyboden | O Mahony | 2 | 10% | 1 | 11% | 0.5 |
| Ballyboden | O Reilly | 0 | 0% | 0 | 0% |
|
| Ballyboden | C Basquel | 3 | 14% | 1 | 11% | 33% |
| Ballyboden | Gibbons | 0 | 0% | 0 | 0% |
|
| Ballyboden | McGarry | 5 | 24% | 4 | 44% | 80% |
| Ballyboden | R Basquel | 5 | 24% | 3 | 33% | 0.6 |
| Ballyboden | Egan | 2 | 10% | 0 | 0% | 0 |
| Ballyboden | Flood | 1 | 5% | 1 | 11% | 1 |
| Ballyboden | Hayes | 0 | 0% | 0 | 0% |
|
| Ballyboden | Bobbett | 0 | 0% | 0 | 0% |
|
| Ballyboden | Kennedy | 0 | 0 | 0 | 0 |
|
| Ballyboden | Holland | 0 | 0 | 0 | 0 |
|
| Ballyboden | Keaney | 0 | 0 | 0 | 0 |
|
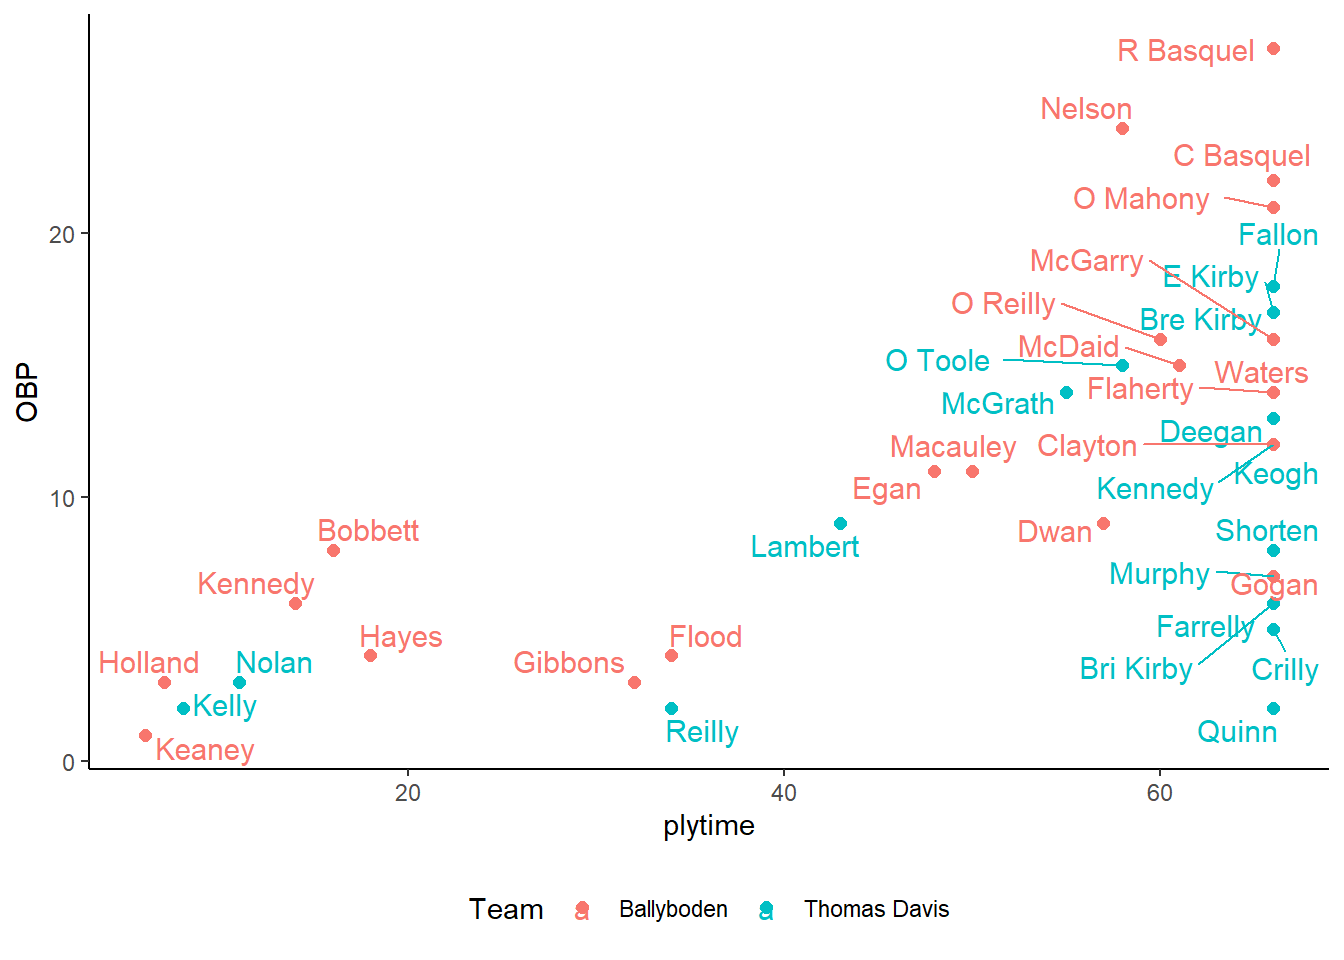
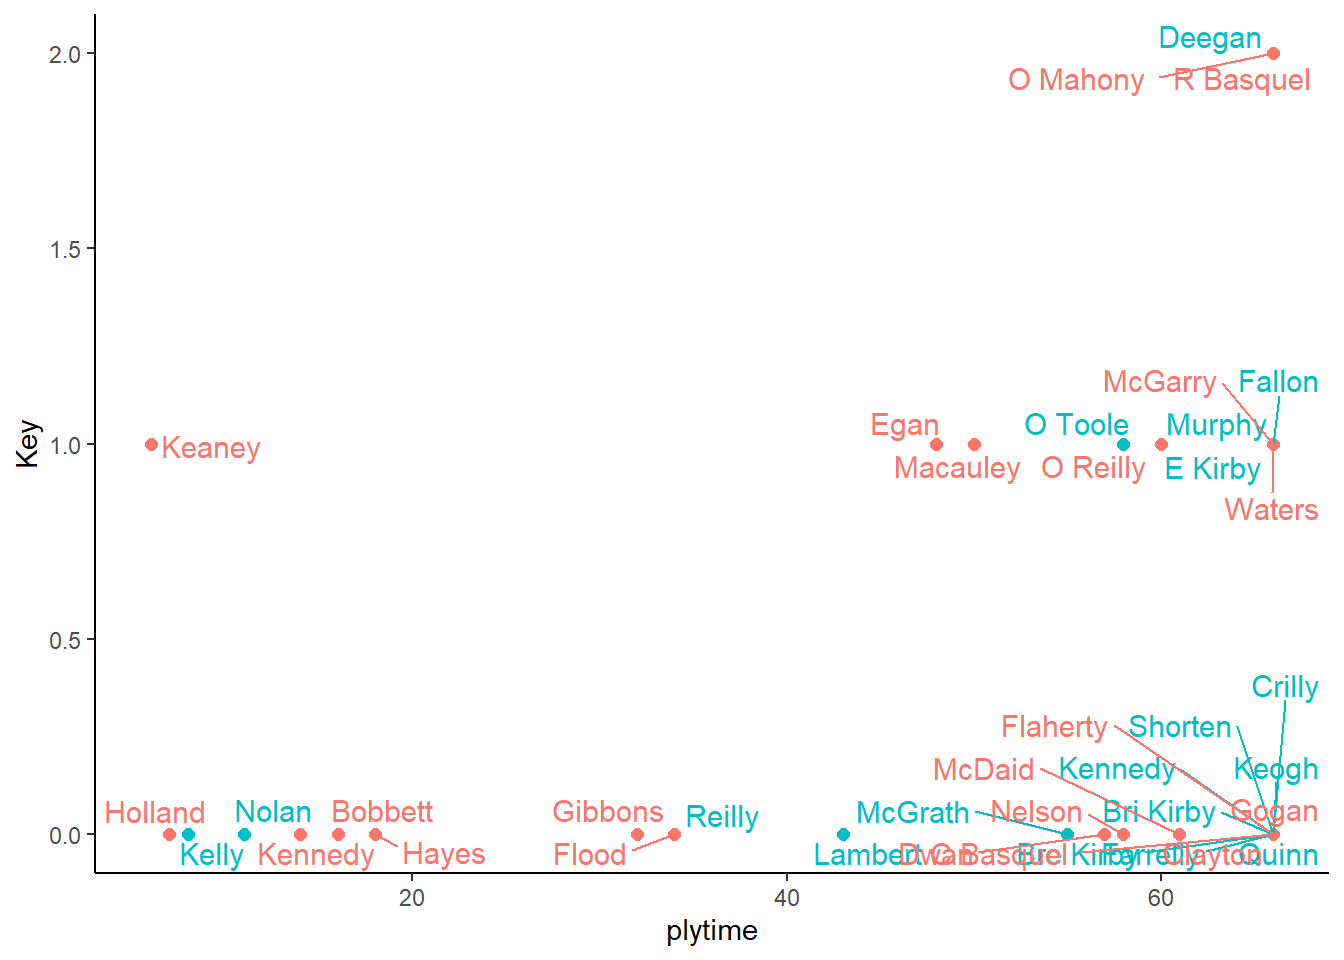
##Open Play Shots vs Playing Time 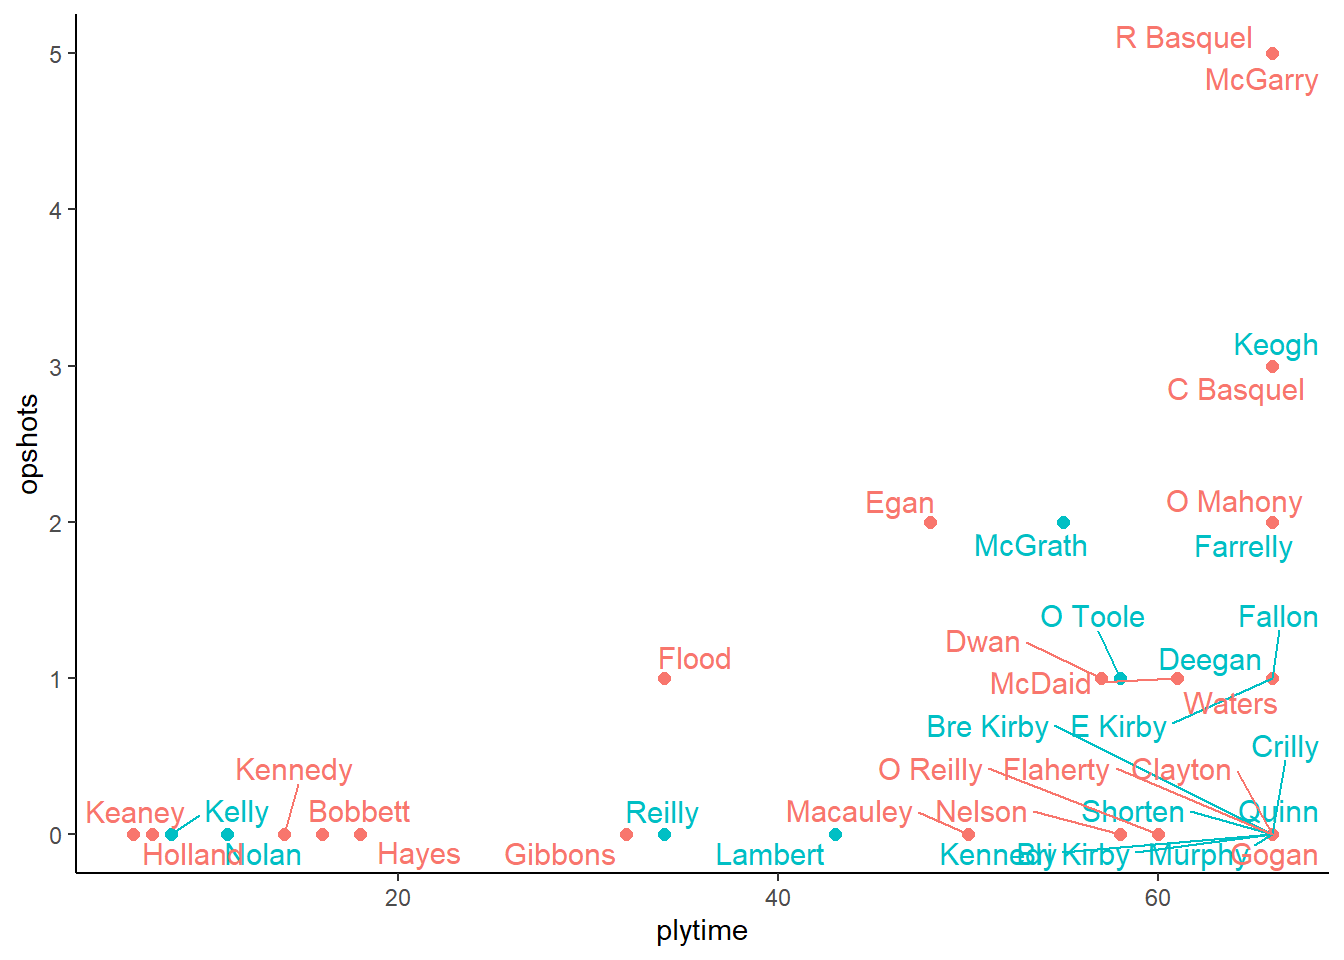
##Open Play Scores vs Playing Time 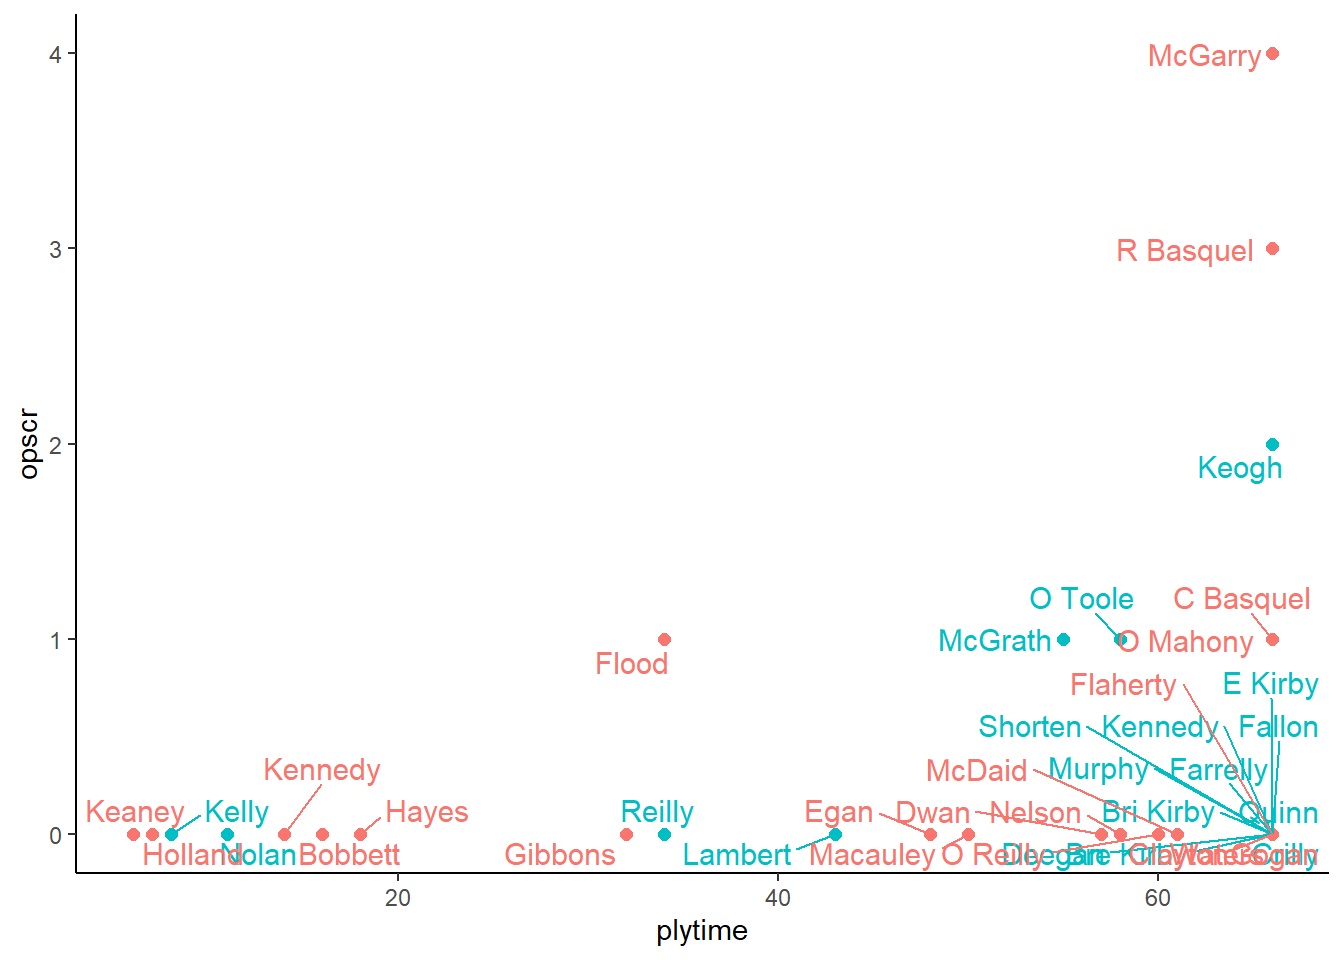
##Open Play Shots vs Open Play Score 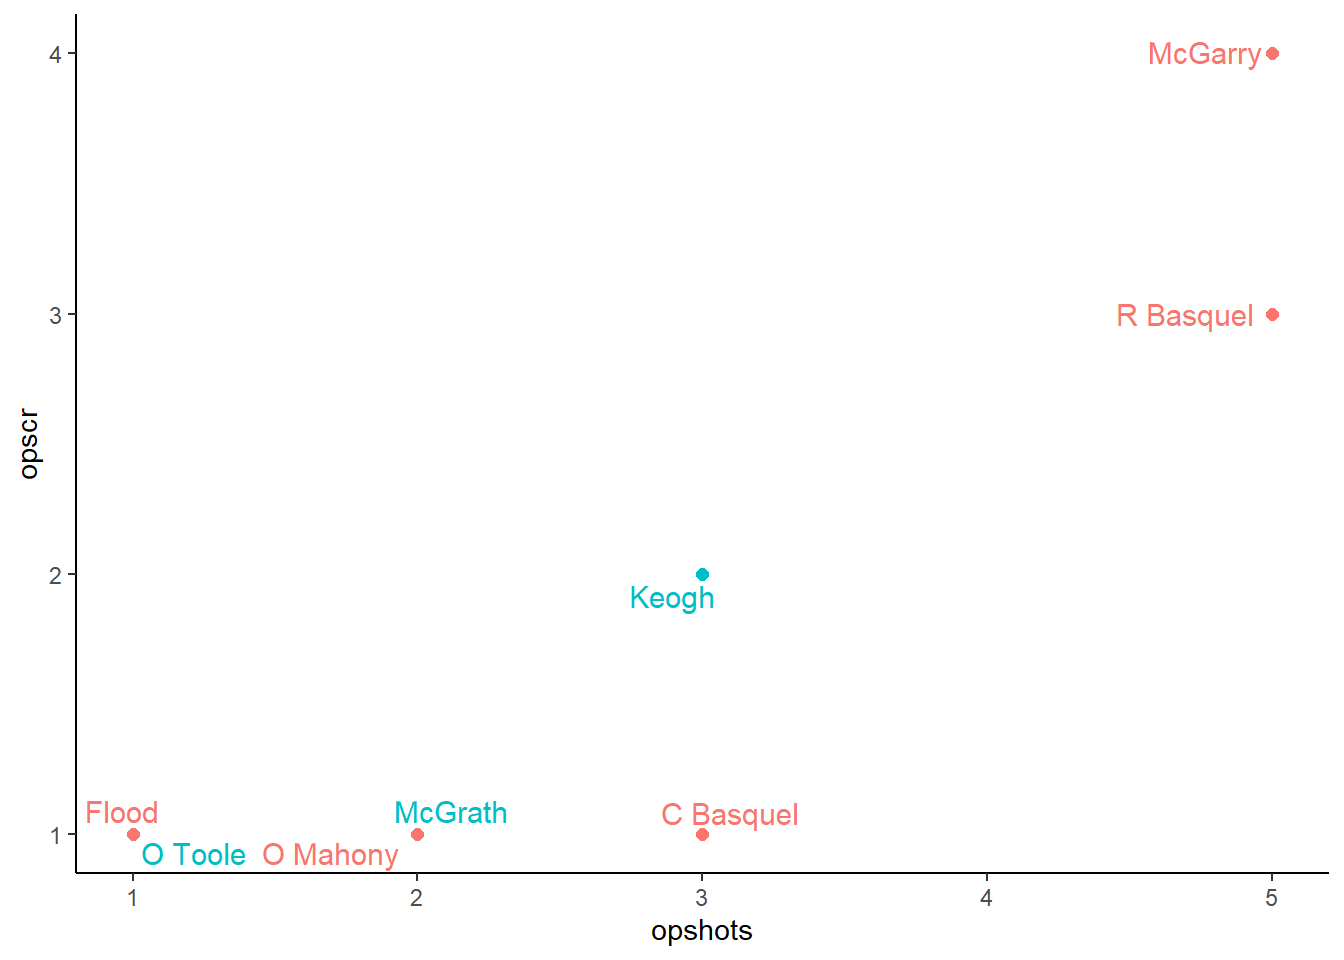
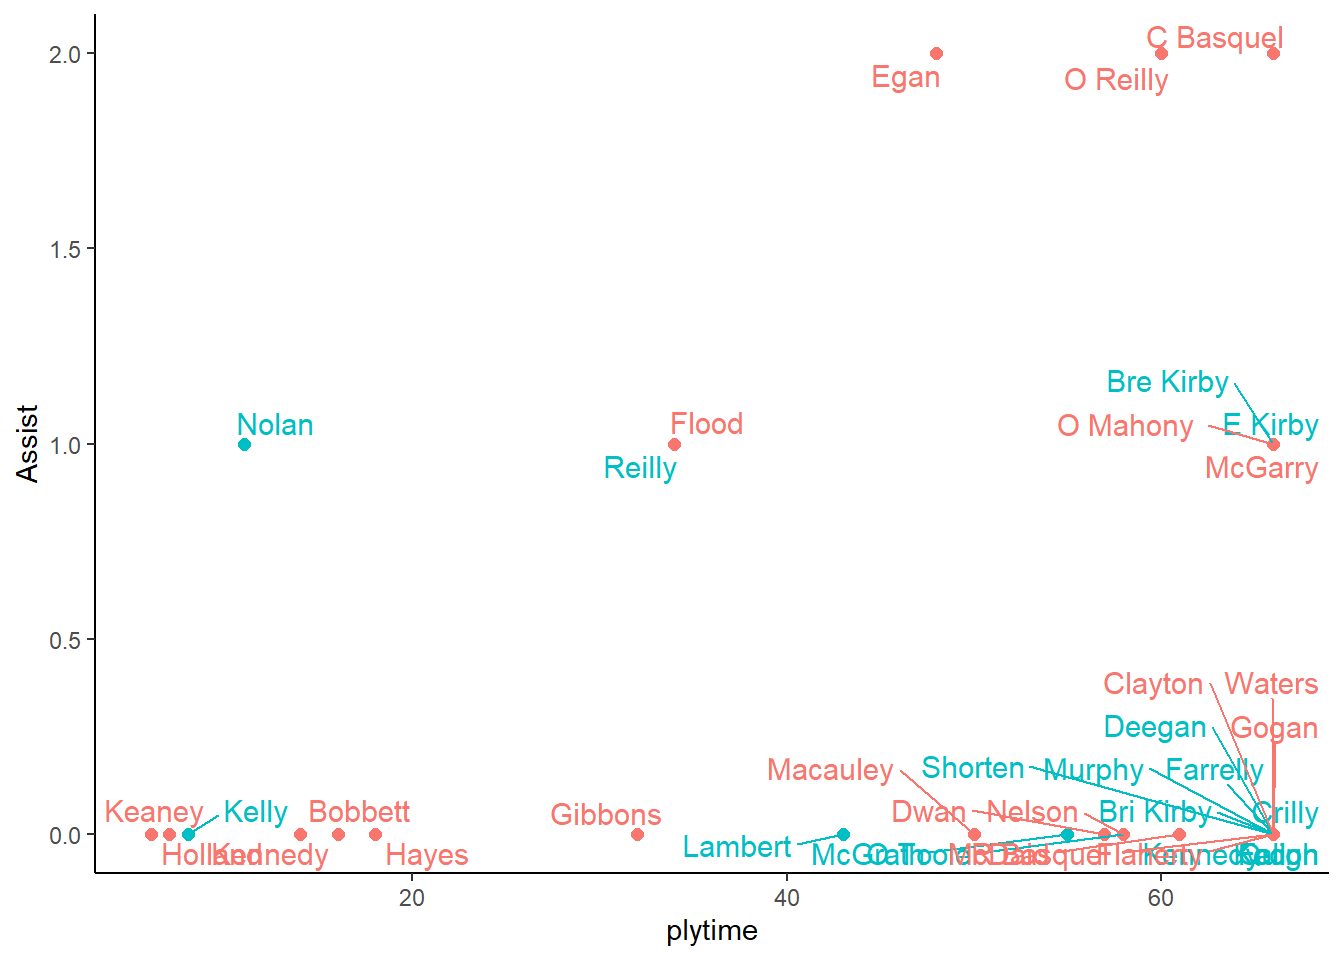
##Open Play Assists vs Playing Time
##Open Play Key Passes vs Playing time
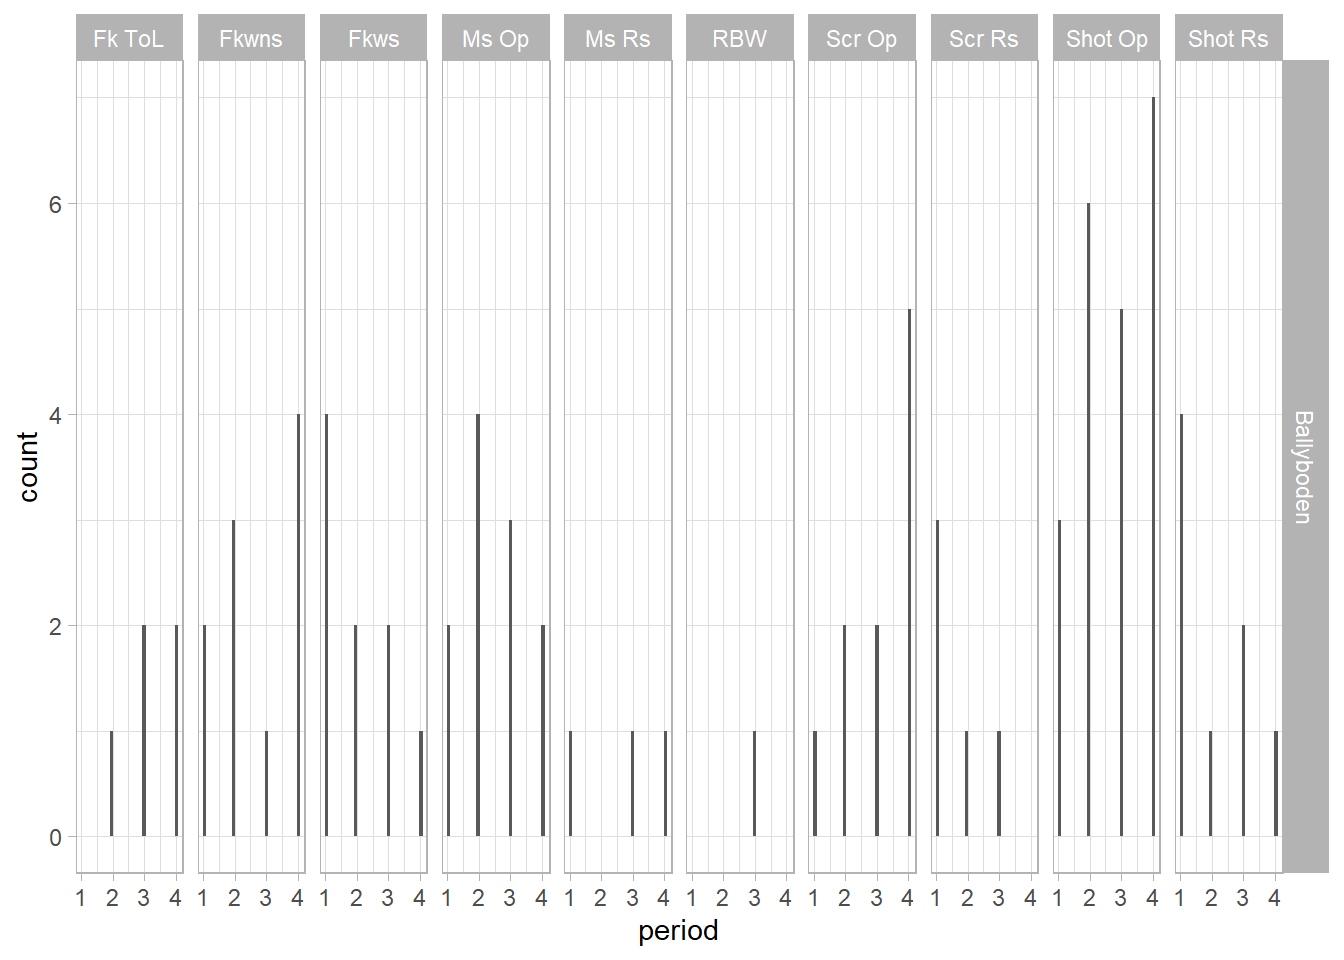
##Actions and Zones ##By Period ###Thomas Davis 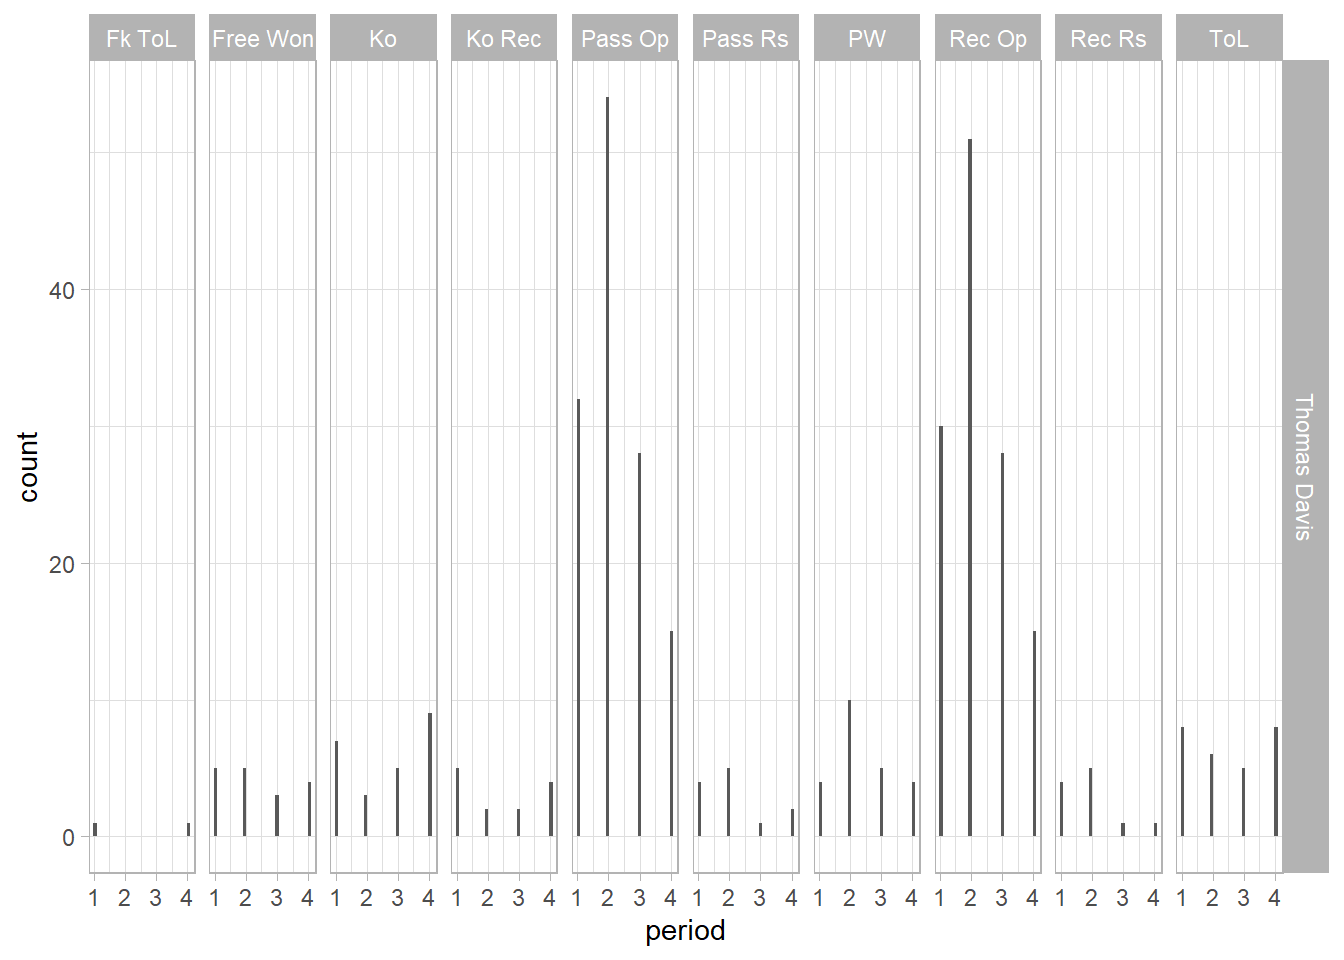
###Ballyboden 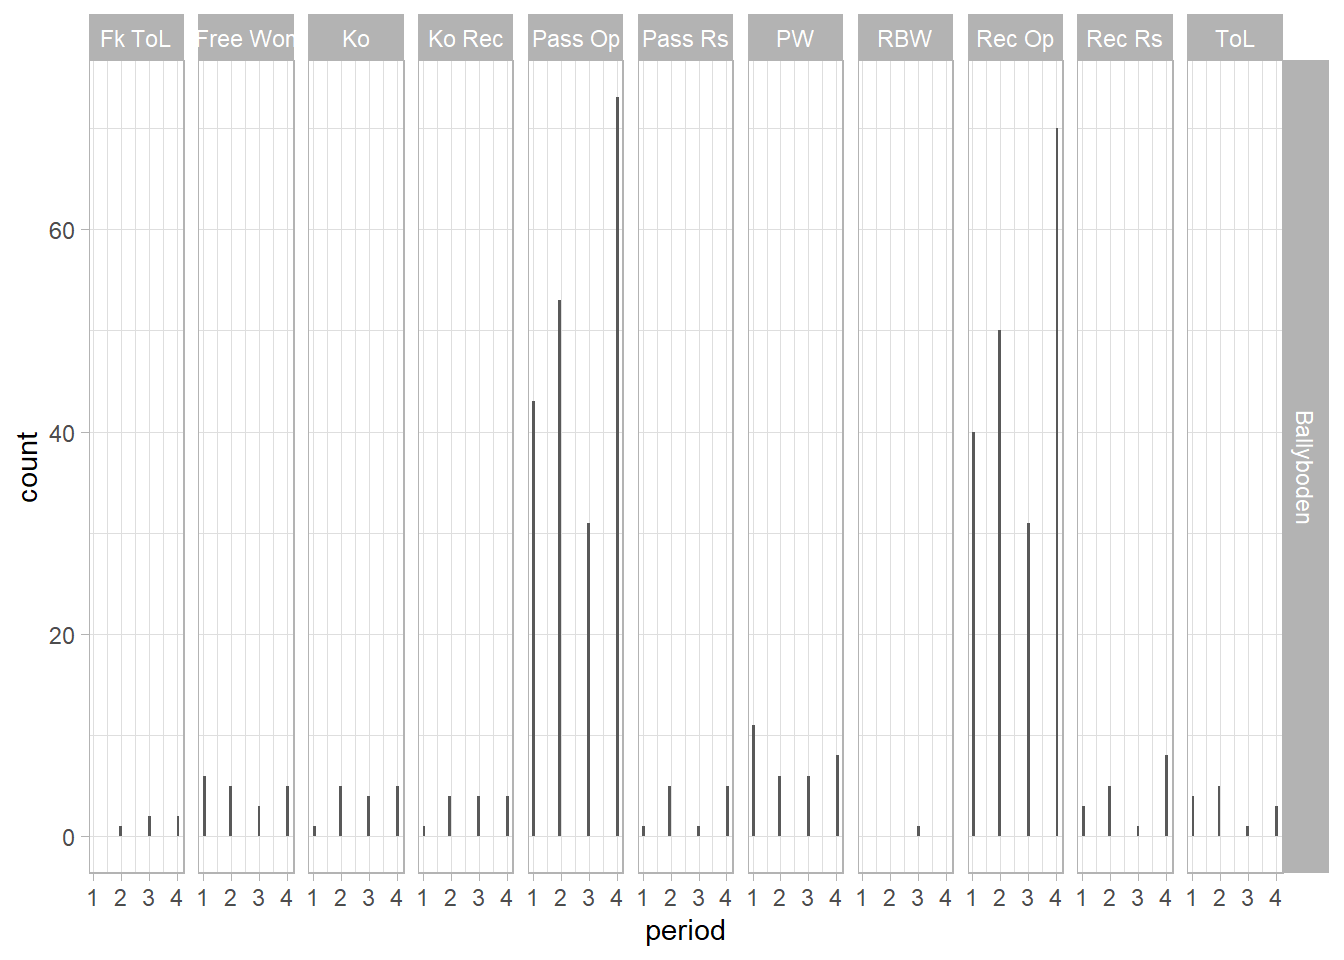
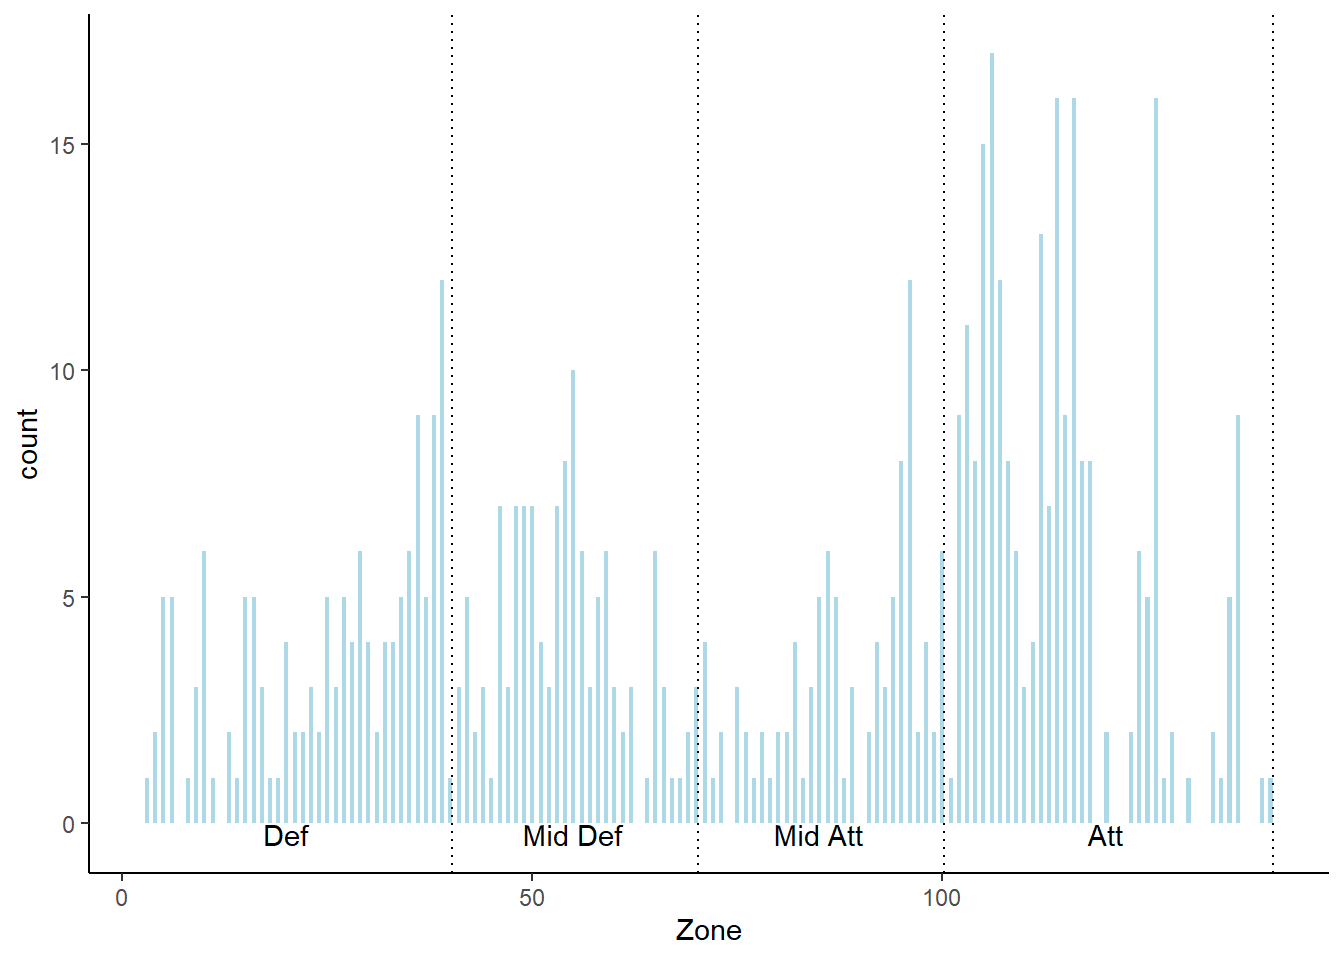
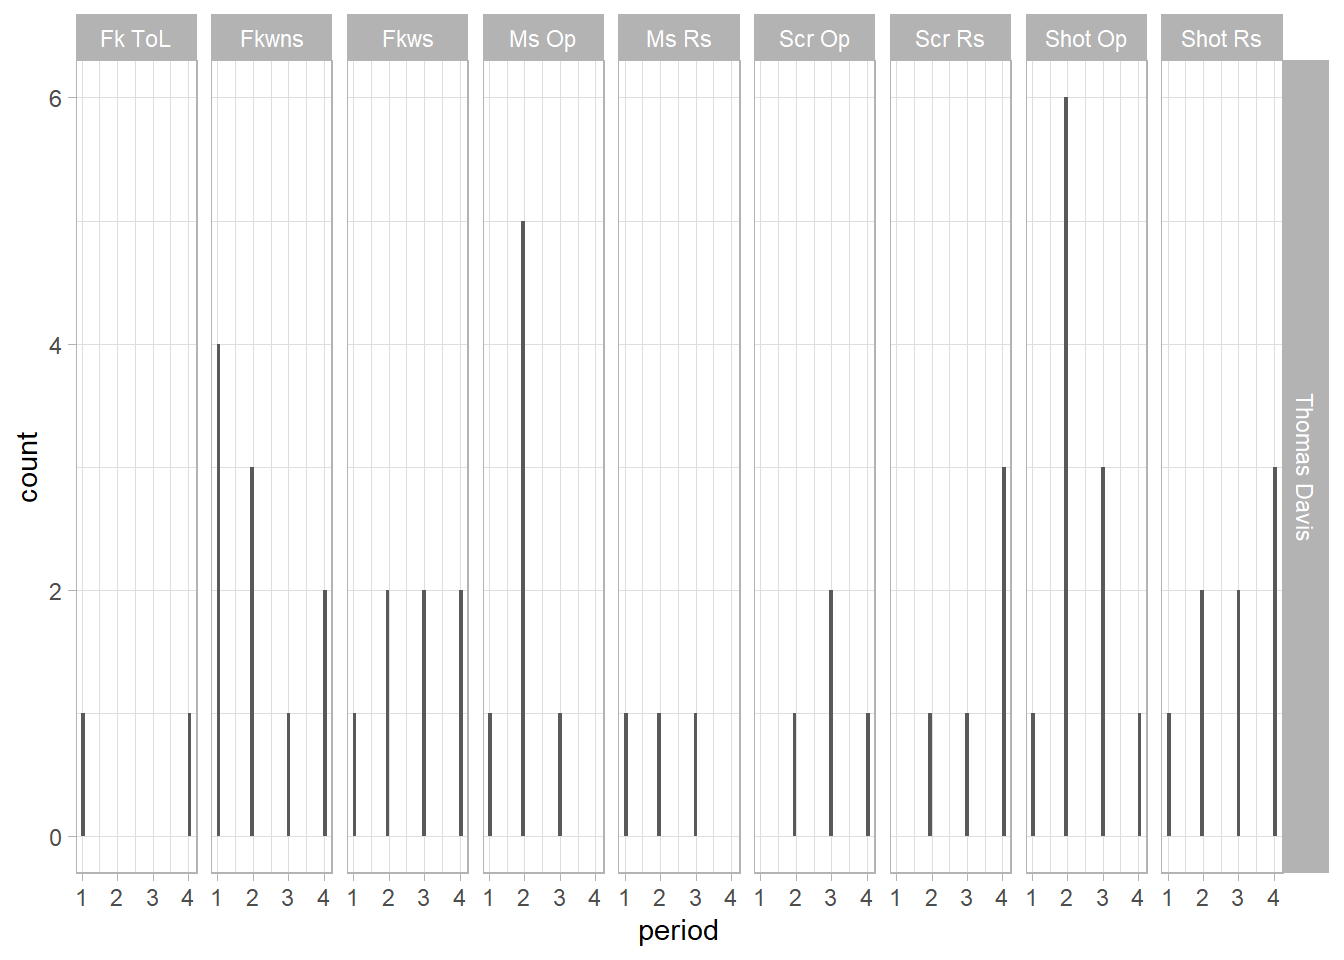
##Zones Frequency ###Thomas Davis
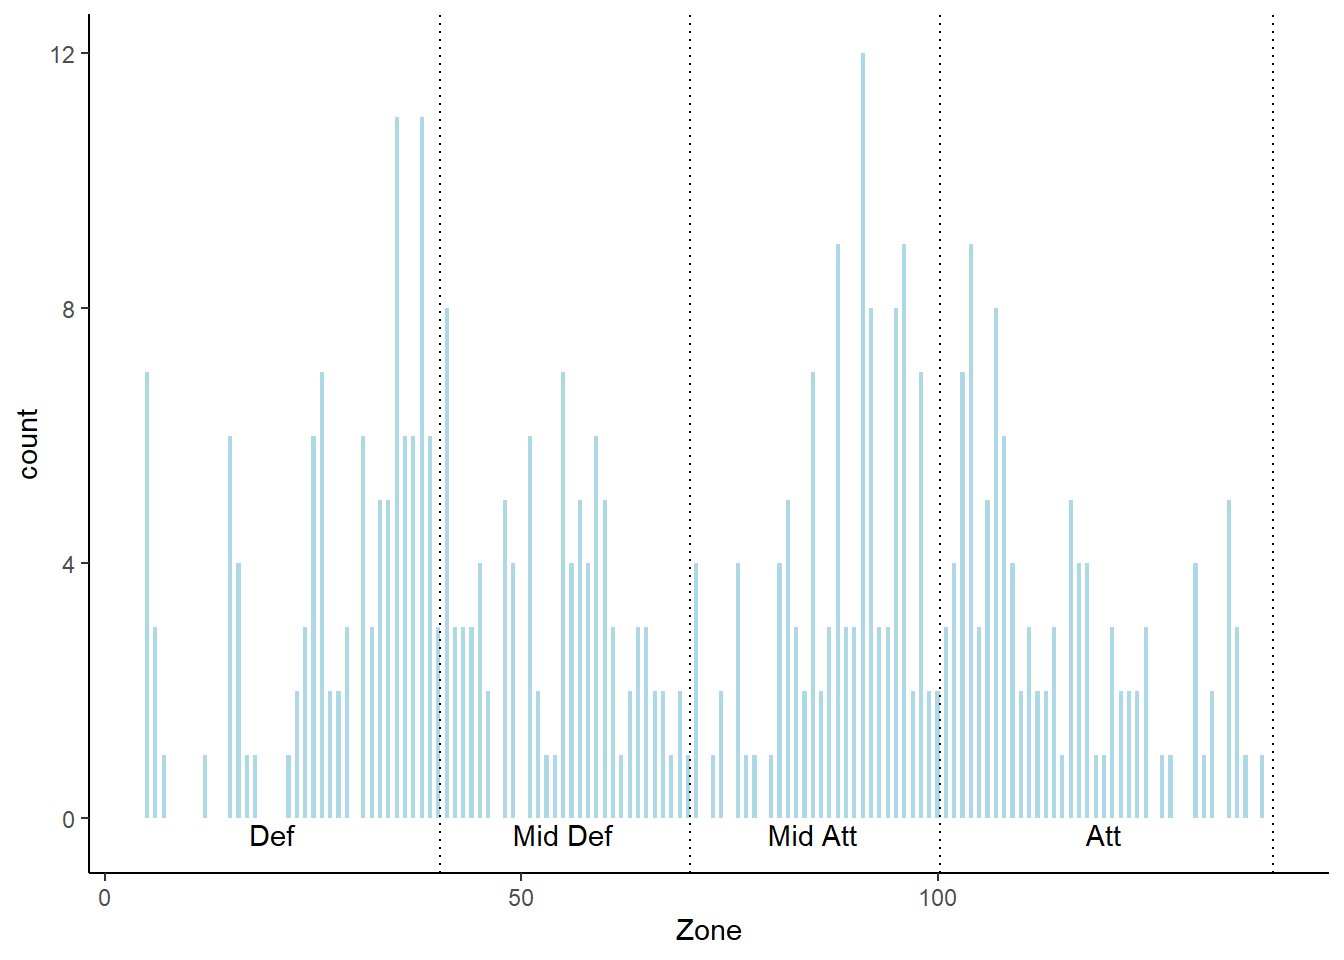
###Ballyboden